

Plate

June 11, 2021
April Import Market Share for Sheet and Plate Products
Written by David Schollaert
This report examines the import share of sheet and plate products. Imports’ share of total sheet product shipments was 12.5% in April, down from 12.7% in March. By comparison, the import share of total plate product shipments jumped to 19.9% in April, up from 15.7% the month prior.
Import share for sheet products has dipped consecutively over the past two months after jumping nearly 5.0% in February. Following simultaneous increases in domestic shipments and imports in March, both edged down in April; however, imports dipped at a greater rate than domestic shipments, -4.9% and -3.1% respectively.
Total plate product shipments rebounded month on month, driven by an increase of 33.4% in imports in April, while domestic shipments were sideways. Overall, total plate products were up 5.3% or 39,889 tons in April when compared to the month prior. Domestic shipments of total plate products remain below pre-pandemic levels; however, imports totaled 158,869 tons in April, the highest mark since July 2019.
Domestic sheet shipments in April totaled 4.364 million tons, down from 4.505 million tons in March. Despite the decrease, April’s domestic shipments of sheet products reached the second highest total in more than 12 months and were in line with pre-pandemic levels. Imports of sheet products in April totaled 625,414 tons, down from 657,978 tons, the second highest mark since January 2020 when imports totaled 714,092 tons. The import share of hot rolled coil (HRC) edged back up to 10.9% in April compared to 8.7% in March. HRC imports were up 16.1% month on month, while domestic shipments fell by 9.8% during the same period.
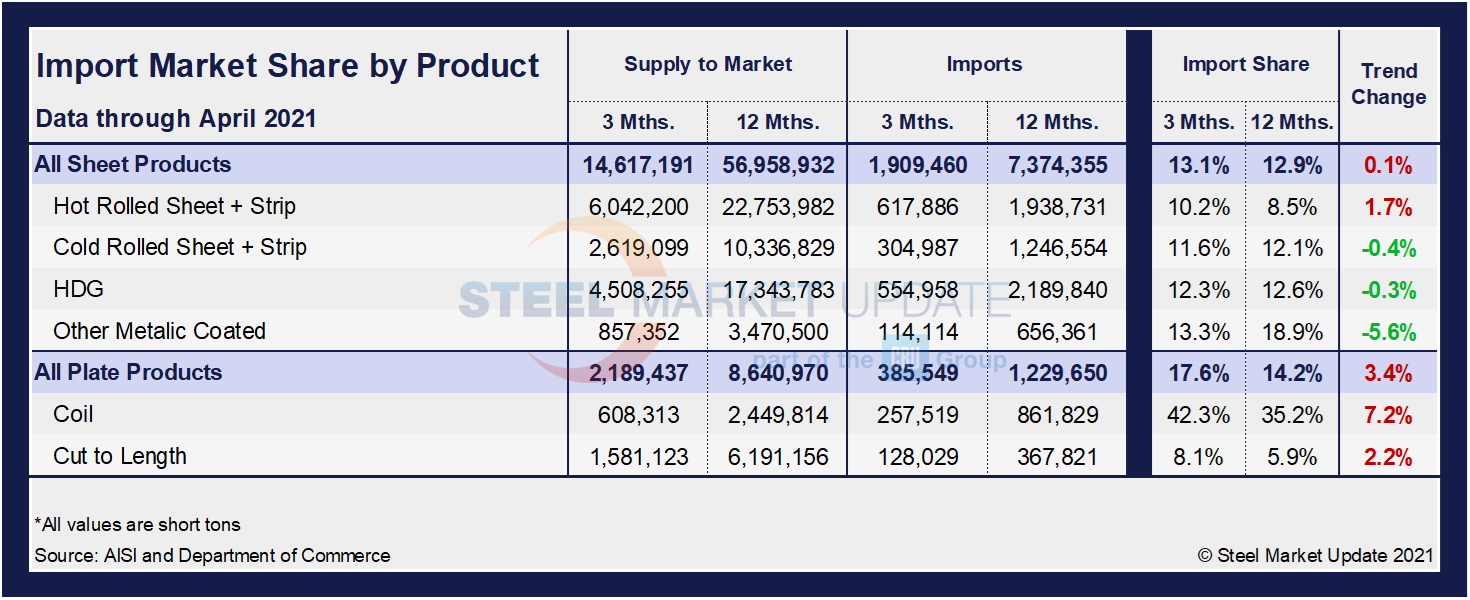
The table below shows total supply to the market in three months and 12 months through April 2021 for sheet and plate products and six subcategories. Supply to the market is the total of domestic mill shipments plus imports. It shows imports on the same three- and 12-month basis and then calculates import market share for the two time periods for six products. Finally, it subtracts the 12-month share from the three-month share and color codes the result green or red according to gains or losses. If the result of the subtraction is positive, it means that import share is increasing, and the code is red. The big picture is that import market share is up marginally in sheet products, but has gained significant momentum in plate products. Imports are sttill competing well with domestic products in three months compared to 12 months, a direct correlation to rising domestic prices as some supply is outsourced as demand remains strong. Most notable of those subcategories are plate in coil (7.2%) and HRC (1.7%) in three months compared to 12 months through April 2021. Import market share overall did gain slightly in April despite strong domestic shipments.
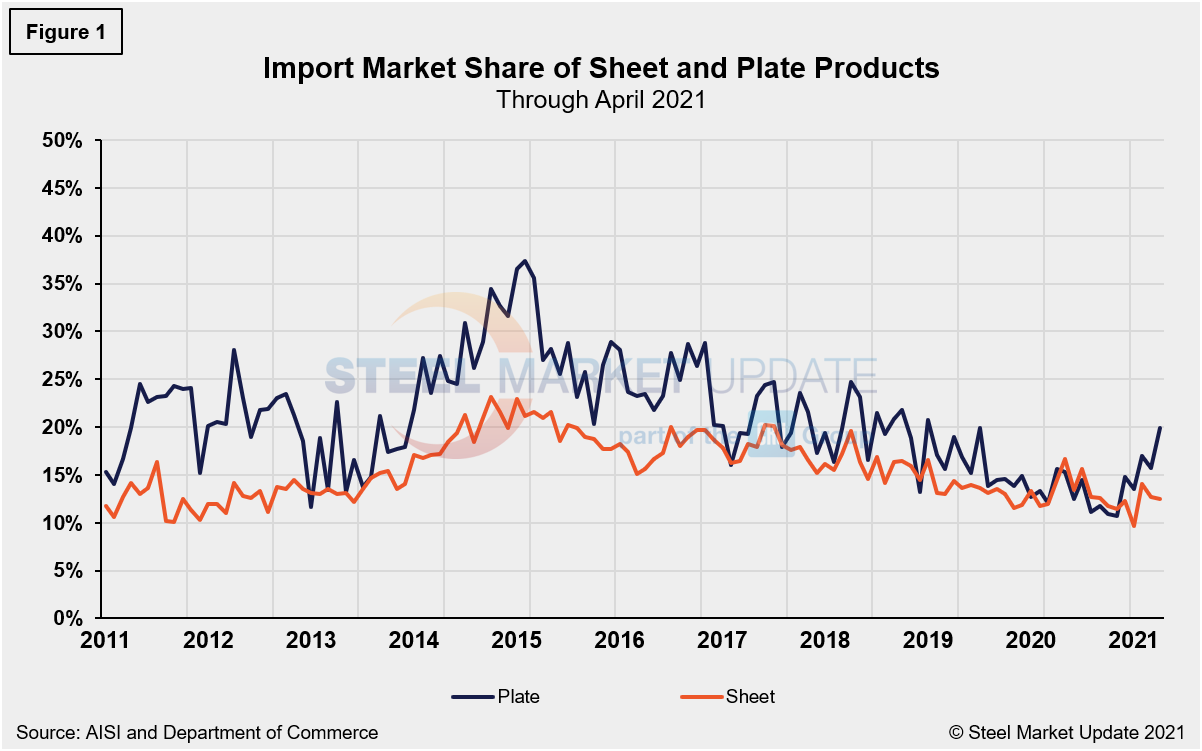
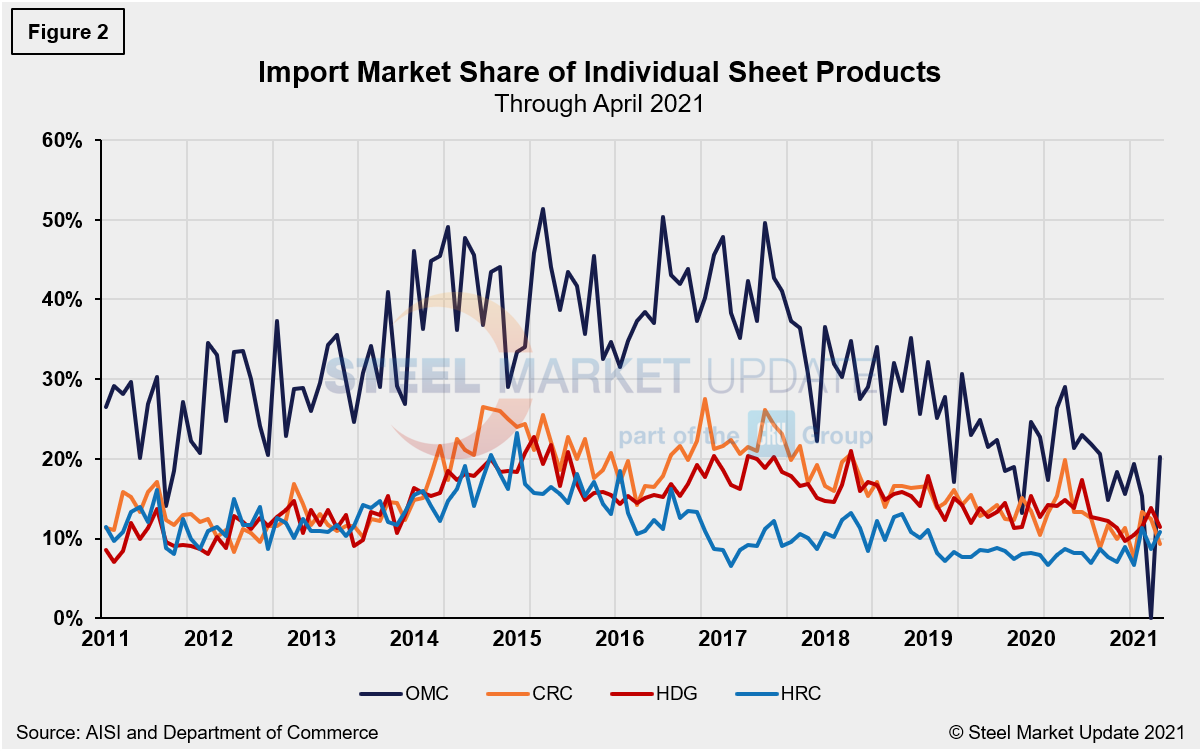
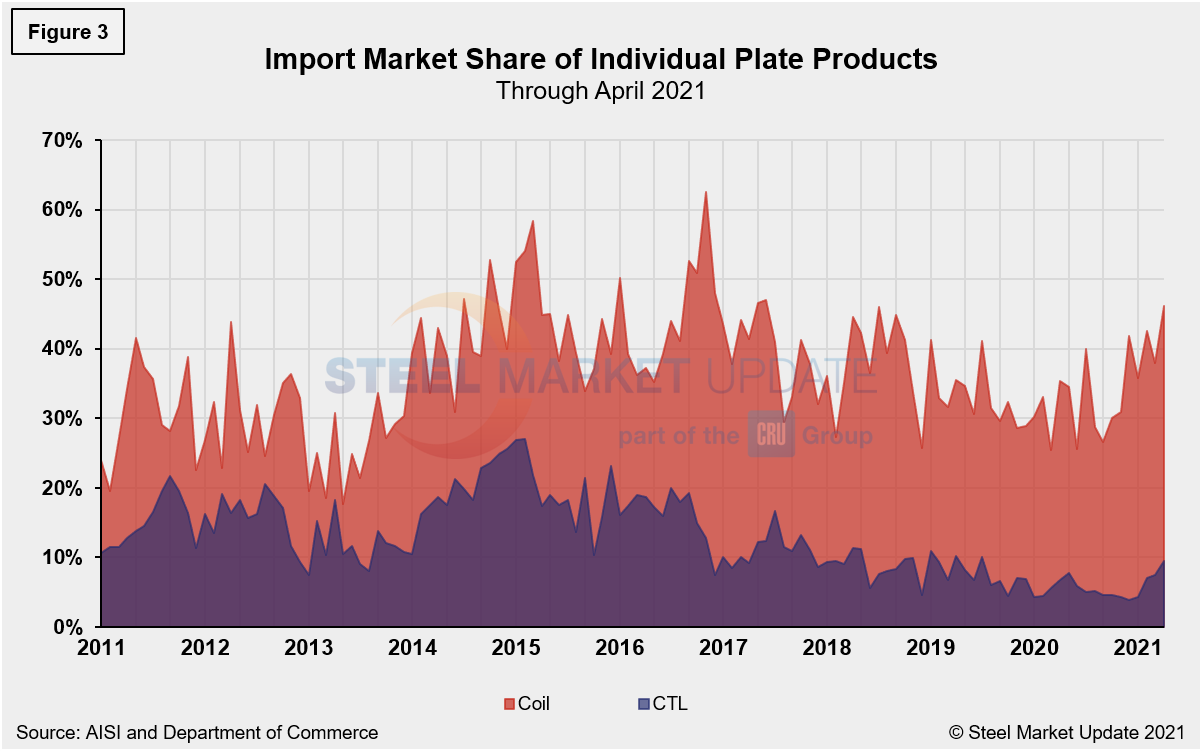
The historical import market share of plate and sheet products is shown in Figure 1, while the import market share of the four major sheet products is displayed in Figure 2. Lastly, the import market share of individual plate products is shown in Figure 3. The import share of plate has been decreasing erratically over the past six years, but has trended up this year and is back to pre-pandemic levels. Sheet product import share also has trended downward over the past several years and has continued to move lower in recent months despite some correction from the COVID-19-related doldrums.
By David Schollaert, David@SteelMarketUpdate.com


