

Prices

June 11, 2021
April Import Market Share for Tubular and Long Products
Written by David Schollaert
This report examines the import share of tubular and long products shipments. Imports’ share of total tubular products rose to 46.6% in April, up from 46.2% in March. Both domestic shipments (-7.0%) and imports of tubular products (-5.8%) fell month on month, yet domestic shipments edged down at a stronger clip when compared to March.
The total long products import market share was 11.8% in April, down from 12.7% the month prior. The shift month on month was due to a concurrent increase of 2.4% in domestic shipments and a decrease of 6.2% in imports. The change was largely due to a decrease of 18.6% in rebar imports in April, a big 84.2% swing month on month following an increase of 65.6% in rebar imports the month prior.
Tubular imports saw a 45.1% downswing in April when compared to the March’s leap, as April’s total of 247,575 tons remains well below pre-pandemic levels. For long products, the import share of wire rod fell to 22.9% in April, down from 26.1% in March. Although OCTG imports fell (-5.9%) in April, domestic shipments (-15.3%) fell at a faster pace and pushed the import market share up to 57.1% in April compared to 55.1% the month prior.
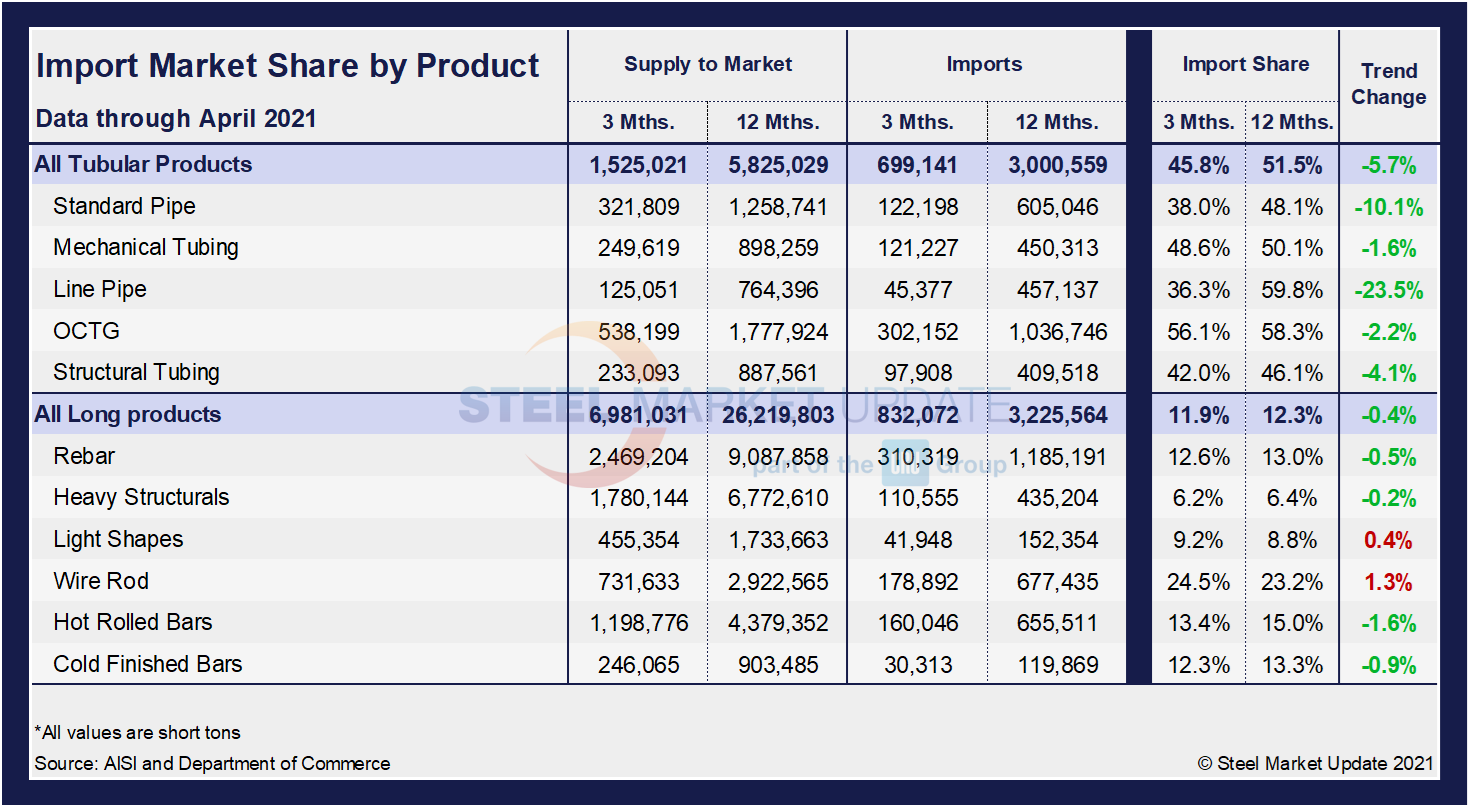
The table below shows total supply to the market in three months and 12 months through April 2021 for the tubular and long product groups and 11 subcategories. Supply to the market is the total of domestic mill shipments plus imports. It shows imports on the same three- and 12-month basis and then calculates import market share for the two time periods for 11 products. Finally, it subtracts the 12-month share from the three-month share and color codes the result green or red according to gains or losses. If the result of the subtraction is positive, it means that the import share is increasing, and the code is red. Most importantly, regarding tubular and long products, the import market share has decreased in three months compared to 12 months across product groups except for light shapes (0.4%) and wire rods (1.3%), which saw inconsequential increases through April 2021.
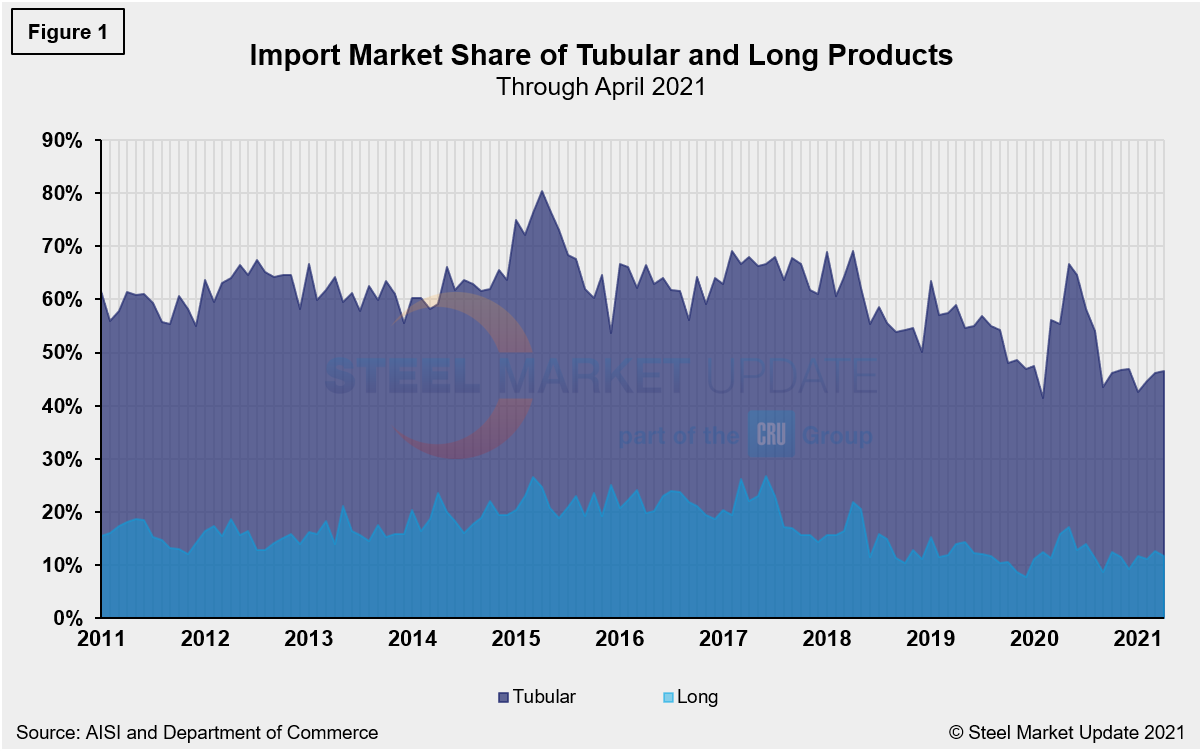
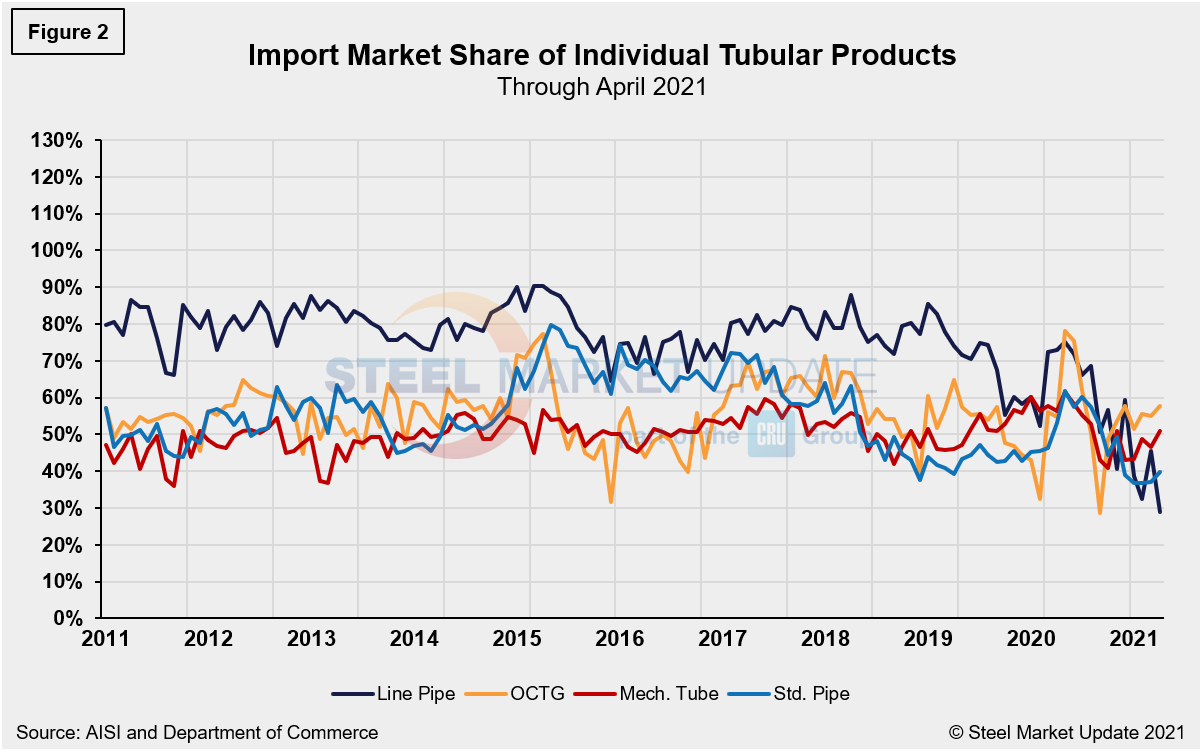
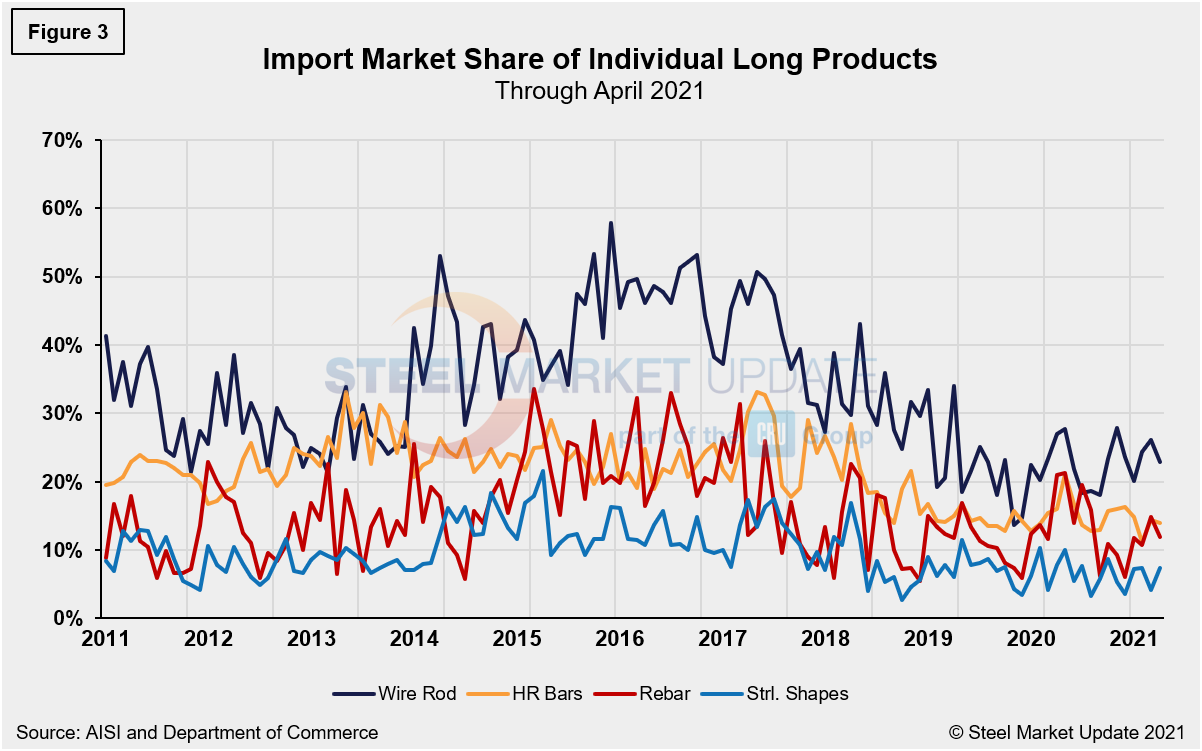
The historical import market share of tubular and long products is shown in Figure 1, while the import market share of the four major tubular products is displayed in Figure 2. Lastly, the import market share of individual long products is shown in Figure 3. The import share of tubular products is nearly four times that of long products. Despite general decreases in April, imports of tubular goods equate to nearly half of domestic consumption. While both long products and tubular goods were impacted by COVID-19-related disruptions, long products have returned to pre-pandemic levels. Tubular products are not far behind, but they have had more ground to cover as they were far more impacted than long products over that period. In April, structural shapes saw the strongest swing in imports month on month; after seeing imports fall by 31.2% in March, they rebounded by 75.1% in April. By comparison, standard pipe imports rose by 24.5% in March followed by an increase of 11.2% in April.
By David Schollaert, David@SteelMarketUpdate.com


