

Market Data

June 18, 2021
SMU Key Market Indicators: Still Improving
Written by David Schollaert
Steel Market Update’s latest analysis of monthly Key Market Indicators underscores that the recovery is still under way. Markers for both the Present Situation and Trends show small but positive moves from a month ago and now exceed pre-pandemic levels.
SMU’s Key Market Indicators include a host of data on the economy, raw materials, manufacturing, construction, and steel sheet and long products, offering a snapshot of current sentiment and the near-term expected trajectory of the economy.
In the latest data, only 3 of the 38 Present Situation indicators are negative, a mark seen for the first time since February 2020. At its worst, 18 of the 38 indicators shifted negative last year as the economy struggled with COVID-related disruptions. The continual improvements since point towards an economy and marketplace distancing itself from the crippling effects of the global health crisis.
SMU’s Present Situation and Trends analyses in the table below are based on the latest available data as of June 18, 2021. Readers should regard the color codes in the “Present Situation” column as a visual summary of the current market condition. The “Trend” columns are also color coded to give a quick visual appreciation of the market’s direction. All data included in this table was released within the past month. The month or specific date to which the data refers is shown in the second column from the far right. Click to expand the table below.
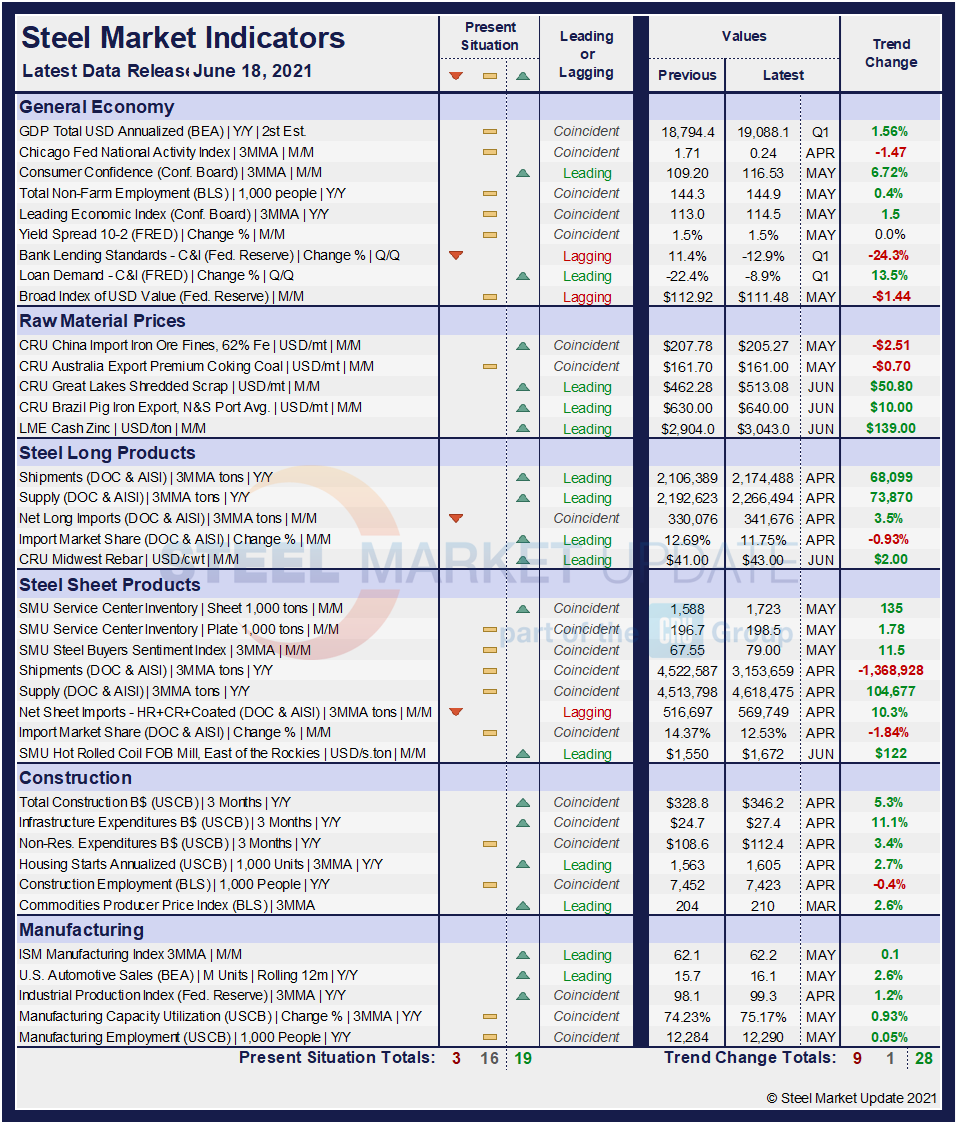
Present Situation
SMU’s Present Situation indicators below show that the road to recovery has been bumpy. The month-on-month improvement was a shift from negative to neutral indicators, as positive metrics were unchanged. We currently view 19 of the 38 indicators as positive, 16 as neutral and just 3 as negative. Although there was no change in positive indicators, these results still show an encouraging shift when compared to last month’s data when 13 indicators were neutral and 6 negative.
Different from the fallout from the pandemic, which was sharp but relatively brief, the recovery pace continues to vary from month to month. The ebb and flow of the U.S. marketplace working itself back to health has fluctuated as it contends with numerous variables such as a shift in presidential administration, less-than-stellar jobs reports in April and May, and an unemployment rate still hovering around 5.8%. Yet, considering unemployment hit a record high of 14.7% just a little over a year ago, the market has made considerable progress.
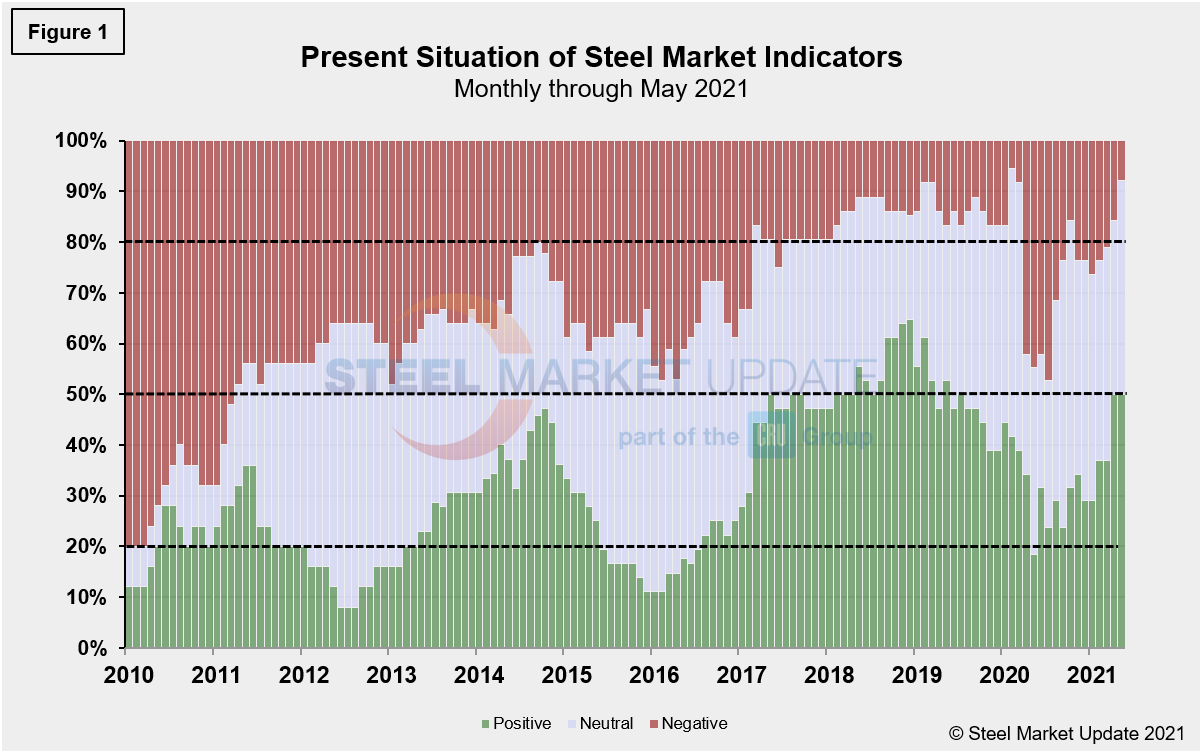
Present results show a positive shift when compared to last month’s data, with both the neutral and negative totals improving despite the positive view remaining unchanged. The marketplace has continued to respond to reopening efforts and mass vaccinations, but with some trepidation. Our most recent assessment indicates only 7.9% see the market’s present situation as negative, an improvement from 15.8% the month prior. Neutral rose from 34.2% to 42.1% during the same period, while positive was unchanged at 50.0%. Presently, 92.1% of our indicators are neutral/positive, pointing towards a generally bullish sentiment regarding domestic economic progress.
Our monthly assessment of the Present Situation since January 2010 on a percentage basis is shown in Figure 1. Early on in the pandemic, a shift in our indicators from positive to negative was clearly seen. The neutral category then gained ground in late 2020, reflecting a cautiously optimistic transition in the marketplace. Note that SMU’s measure of the Present Situation, as indicated by the green bars on the right, shows sentiment has exceeded pre-pandemic levels.
Trends
Unlike the Present Situation, SMU’s Trends indicators saw just a slight positive move, perhaps due to the disappointing workforce gains in April and May—8.8 million Americans currently remain unemployed—and rising inflation. However, with most of the country now lifting health-related restrictions, general sentiment and consumer confidence are likely to rise in the weeks ahead.
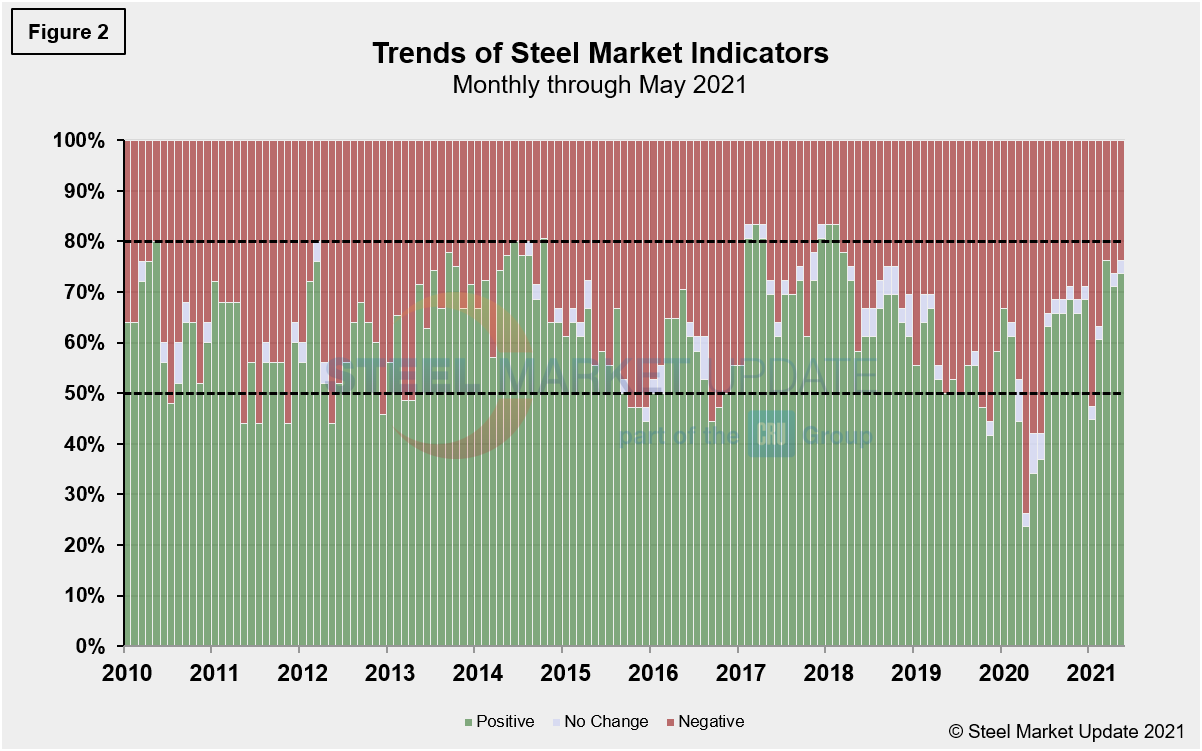
Most values in the Trends columns are three-month moving averages (3MMA) to smooth erratic monthly data. Note that in many cases this is not May or June data, but data that was released in May and/or June for previous months. Compared to month-ago data, the negative trend decreased to 23.7% at present, compared to 26.3% last month. Additionally, the neutral trend was unchanged at 2.6% during the same period, while the positive trend gained ground from 71.1% to 73.7%. These results are positive and continue to point toward general market improvement, yet suggest there’s still more work to be done. Figure 2 shows the recent movement of the trends as well as the post Great Recession situation at the far left of the chart for comparison.
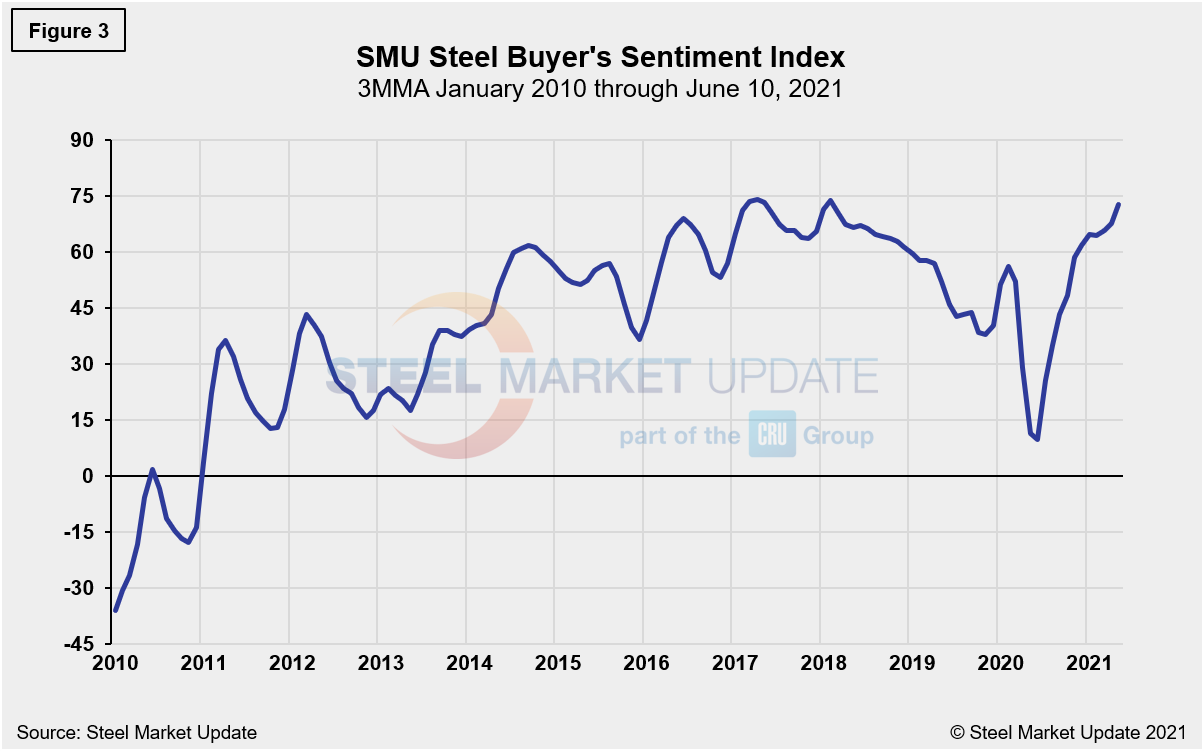
The SMU Steel Buyers Sentiment Index is a measure of the current attitude of North American steel buyers regarding their company’s chances for success in today’s market. The single value of the current sentiment index fell from +58 in early March 2020 to -8 less than a month later. It has since rebounded to a healthy +79 as of June 10, reaching historic highs. Figure 3 shows the 3MMA of the index since 2010. A reading above the neutral point of zero indicates that buyers have a positive attitude about their prospects. Rising demand and historically high steel prices should keep the Steel Buyer’s Sentiment Index at a highly optimistic level for the foreseeable future.
By David Schollaert, David@SteelMarketUpdate.com


