

Market Data

July 1, 2021
Chicago PMI Edges Down in June
Written by David Schollaert
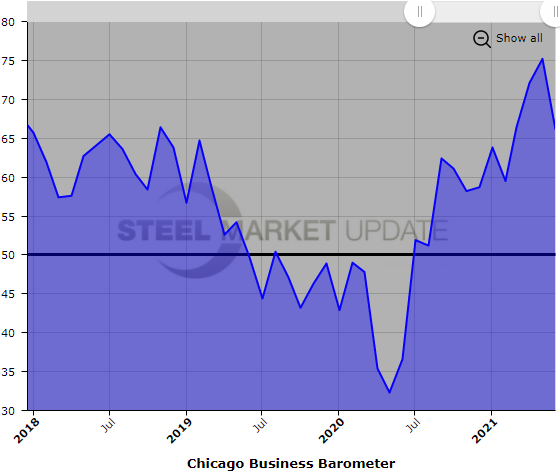
The Chicago Business Barometer fell to a four-month low in June with a PMI reading of 66.1, according to MNI Indicators. The June PMI slipped 9.1 points from May. Through Q2, however, the index jumped by 7.9 points to 71.1, its highest quarterly reading since Q4 1973.
Demand was not as robust as anticipated. Supplier deliveries were the sole indicator to post a gain in June, a 4.2-point increase month on month. Among the main five indicators, order backlogs saw the largest decline, falling by 14.1 points.
New orders languished markedly, dropping to a three-month low in June. However, the index jumped to 73.0 over Q2, its highest reading since Q3 1983. Production eased slightly in Q2 to 67.9, while the monthly index slipped 10.6 points. Some firms reported lower production levels due to material shortages, while others noted that the shortages created new business.
Inventories declined 4.3 points to the lowest level since August 2020 and the third successive reading below the 50-mark. Over the second quarter, inventories fell sharply, down 11.6 points to a reading of 42.1.
Employment slipped to the lowest level since January with firms noting difficulties in finding new staff. Through Q2 the index gained 1.1 points, rising to 50.1.
Supplier deliveries rose 4.2 points to the highest level since March 1974, though logistical problems persisted. The index rose to 81.7 in Q2, its highest level since Q1 1974.
Prices paid at the factory gate surged to the highest level since December 1979. Companies noted higher prices due to material shortages. Across Q2, prices rose to 90.6, also a near 41-year high.
Special question this month focused year-on-year comparisons. Most respondents—accounting for 41.0% of replies—reported that their firms are thriving and growing. The second question asked, “Are rising prices going to have a material impact on your business thinking?” Again, the common answer amongst respondents, totaling 82.1%, said their business decisions are impacted.
Below is a graph showing the history of the Chicago Business Barometer. You will need to view the graph on our website to use its interactive features; you can do so by clicking here. If you need assistance logging into or navigating the website, please contact us at info@SteelMarketUpdate.com.
By David Schollaert, David@SteelMerketUpdate.com


