

Prices

July 14, 2021
May Import Market Share for Tubular and Long Products
Written by David Schollaert
This report examines the import share of tubular and long products shipments. Imports’ share of total tubular products rose to 47.9% in May, up from 46.6% in April. Total tubular imports rose by 6.4% month on month, while domestic shipments ticked up only slightly by 0.4% during the same period. Overall supply was up as well in May, totalling 549,547 tons or 3.2% higher than the month prior.
Total long products’ import market share was 11.9% in May, largely sideways compared to 11.8% in April. The lateral move month on month was due to a concurrent increase of 4.5% in domestic shipments and an increase of 5.8% in imports. Despite the small variation month on month, rebar import market share fell for the second consecutive month, while wire rod saw a 58.1% increase in imports in May.
Most notable across the tubular market was a 59.0% increase in line pipe imports in May compared to the month prior. Imports of line pipe totaled 18,756 tons, just a fraction of the 326,334 tons imported in January 2019 when the natural gas boom was still in full effect. For long products, the import share of cold finished bar rose to 15.9% in May from 10.8% the month prior.
OCTG imports rose by 4.4% in May after slipping by 5.9% in April. Domestic shipments were also up 4.0% for OCTG after falling by more than 15.0% during the same period. The import market share for OCTG was largely unchanged month on month at 57.8% versus 57.7% in April.
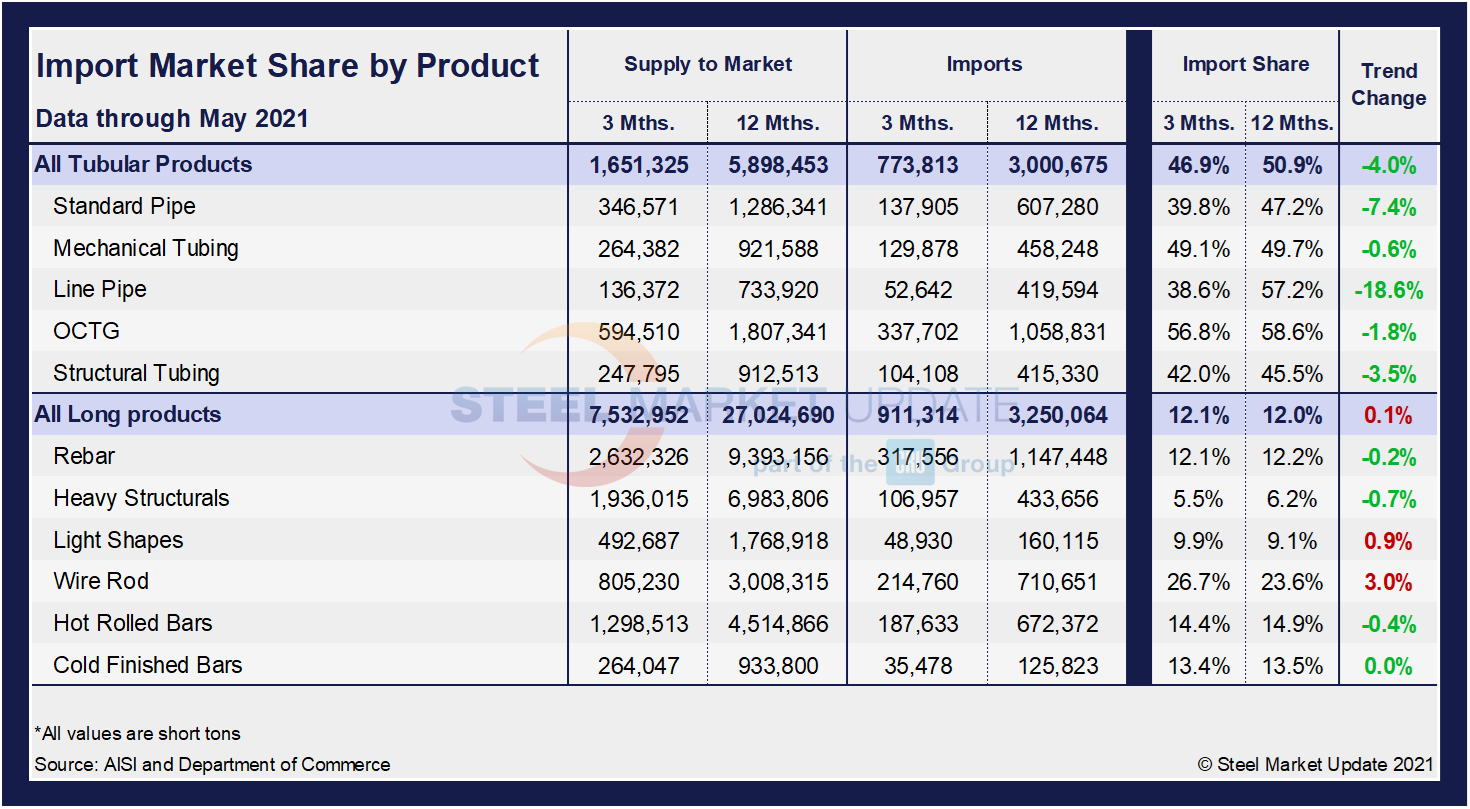
The table below shows total supply to the market in three months and 12 months through May 2021 for the tubular and long product groups and 11 subcategories. Supply to the market is the total of domestic mill shipments plus imports. It shows imports on the same three- and 12-month basis and then calculates import market share for the two time periods for 11 products. Finally, it subtracts the 12-month share from the three-month share and color codes the result green or red according to gains or losses. If the result of the subtraction is positive, it means that the import share is increasing, and the code is red. Most importantly, regarding tubular and long products, the import market share has decreased in three months compared to 12 months across product groups except for light shapes (0.9%) and wire rods (3.0%), which saw inconsequential increases through May 2021.
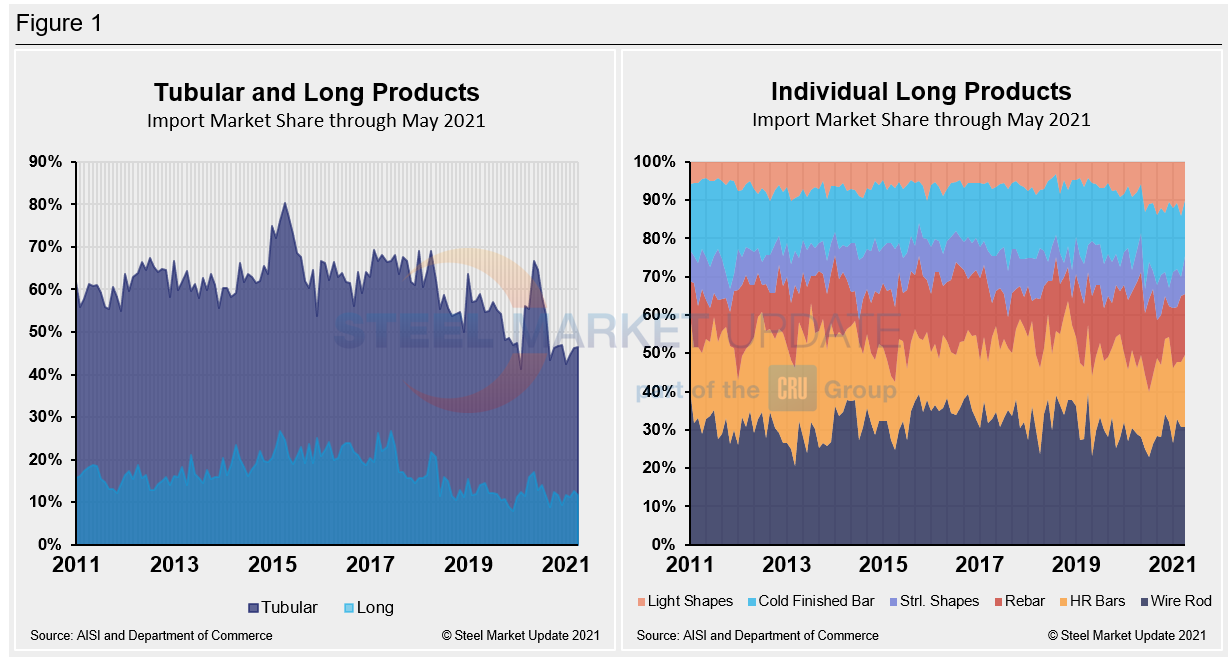
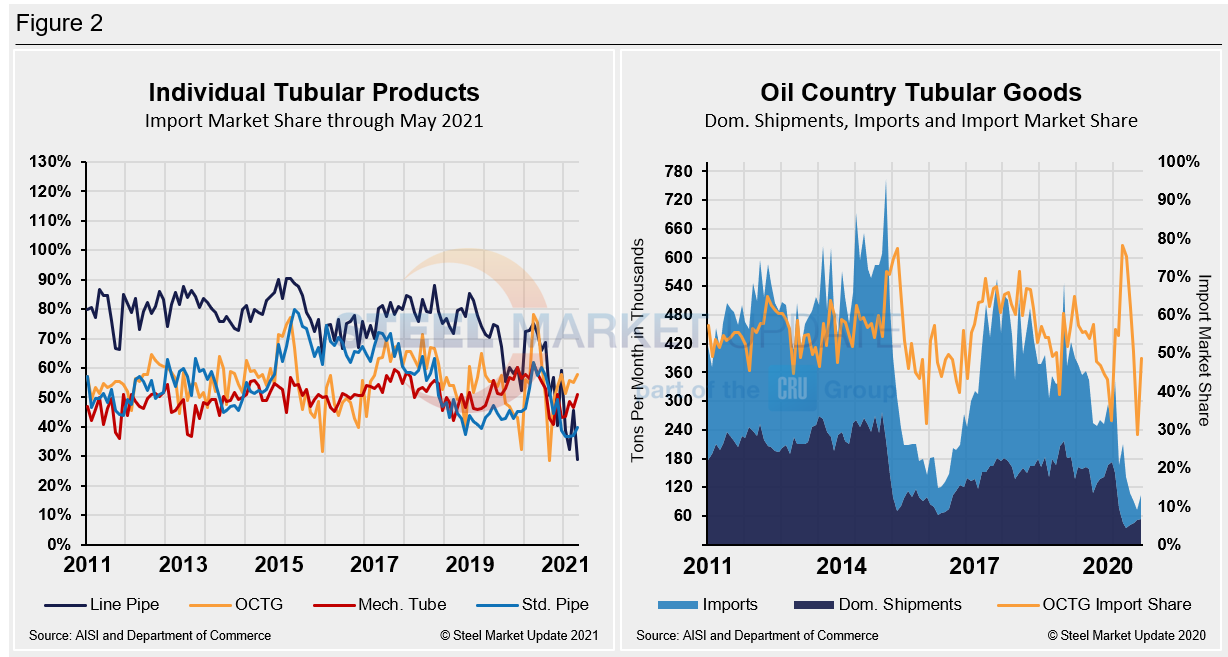
The historical import market share of tubular and long products and the import market share of individual long products are displayed together in Figure 1. The import market share of the four major tubular products and the breakdown of the OCTG market are shown side-by-side in Figure 2. The import share of tubular products is nearly four times that of long products. Following a 6.4% increase in May, imports of tubular goods edged up further and equate to nearly half of domestic consumption. While both long products and tubular goods were impacted by COVID-19-related disruptions, long products have returned to pre-pandemic levels. Tubular products are not far behind, but they have had more ground to cover as they were far more impacted than long products over that period. Additionally, the tubular market, especially line pipe and OCTG’s downward move, was only accentuated by the pandemic.
By David Schollaert, David@SteelMarketUpdate.com


