

Market Data
July 27, 2021
Consumer Confidence: July Data Suggests Stability
Written by David Schollaert
U.S. consumer confidence remained steady in July following more accentuated gains in five of the past six months, according to the latest data from The Conference Board. The July index rose by just 0.2 of a point month on month, on top of increases totaling nearly 34 points from February through June.
“Consumer confidence was flat in July but remains at its highest level since February 2020 (132.6),” said Lynn Franco, senior director of economic indicators at The Conference Board. “Consumers’ appraisal of present-day conditions held steady, suggesting economic growth in Q3 is off to a strong start. Consumers’ optimism about the short-term outlook didn’t waver, and they continued to expect that business conditions, jobs, and personal financial prospects will improve. Short-term inflation expectations eased slightly but remained elevated. Spending intentions picked up in July, with a larger percentage of consumers saying they planned to purchase homes, automobiles and major appliances in the coming months. Thus, consumer spending should continue to support robust economic growth in the second half of 2021.”
Following the second largest month-on-month jump in June, The Conference Board’s consumer confidence index saw the smallest increase in nearly a year in July. Although momentum eased noticeably compared to the month prior, the index has grown sequentially since February. The recovery from the COVID-19 doldrums was especially significant from February through April when the consumer confidence index rose from 87.1 to 117.5, but has since been inconsistent in spite of the continuing upward trend. Despite the continued gains, the index is still behind pre-pandemic levels, but the stability in the latest results is an encouraging sign that the marketplace continues to work towards a full post-pandemic recovery.
July’s present situation index, which is based on consumers’ assessment of current business and labor market conditions, saw a 0.7-point increase month on month to 129.1, following a 10.9-point jump in June. The expectations index, which is based on consumers’ short-term outlook for income, business and the labor market, slipped by 0.1 point to 108.4 after rising by 7.6 points the month prior. Although the two indexes experienced differing moves, they were largely unchanged from one month ago.
Calculated as a three-month moving average (3MMA) to smooth out the volatility, The Conference Board’s composite index rose in July to 126.0 compared to 122.1 in June – still well below the pre-pandemic high of 130.4 last February, yet noticeably higher than the 92.0 seen a year ago. The composite index is made up of two sub-indexes: the consumer’s view of the present situation and his or her expectations for the future. Figure 1 below notes the 3MMA linear trend lines from January 2012 through July 2021 versus the trend lines of all three subcomponents of the index: present situation, composite and future expectations. All three were above the average composite line in October 2020 before falling consecutively through February. The surge from March through June pulled all three indexes above the composite line once again, with present situation and composite still trending up.
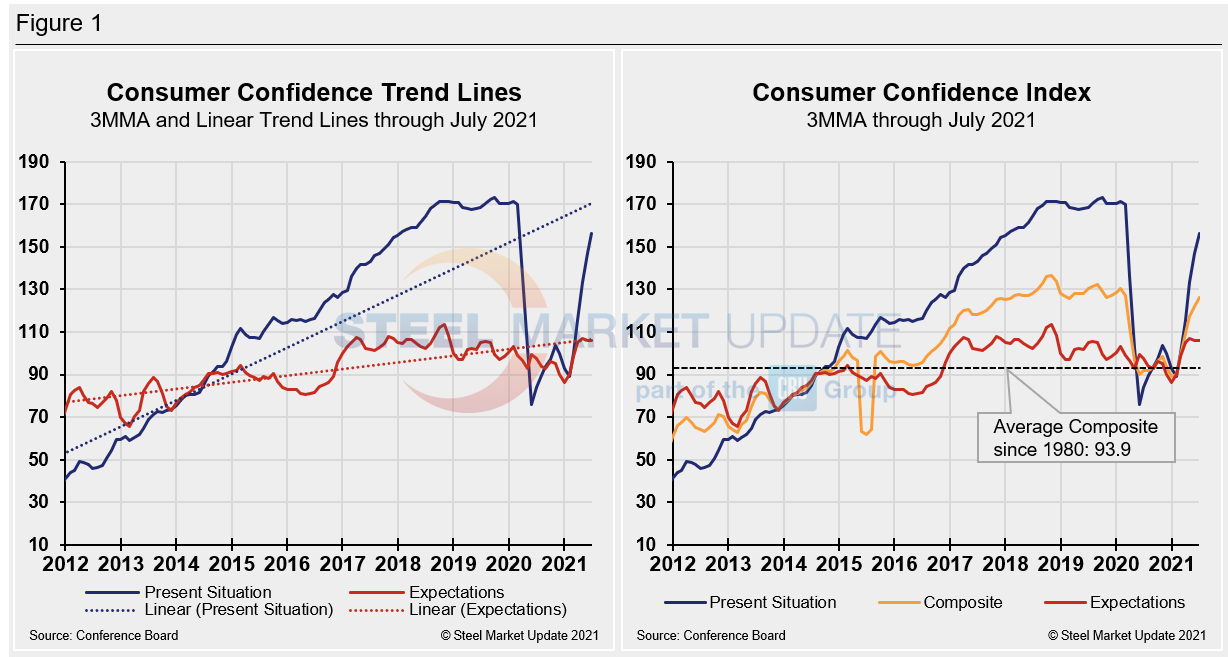
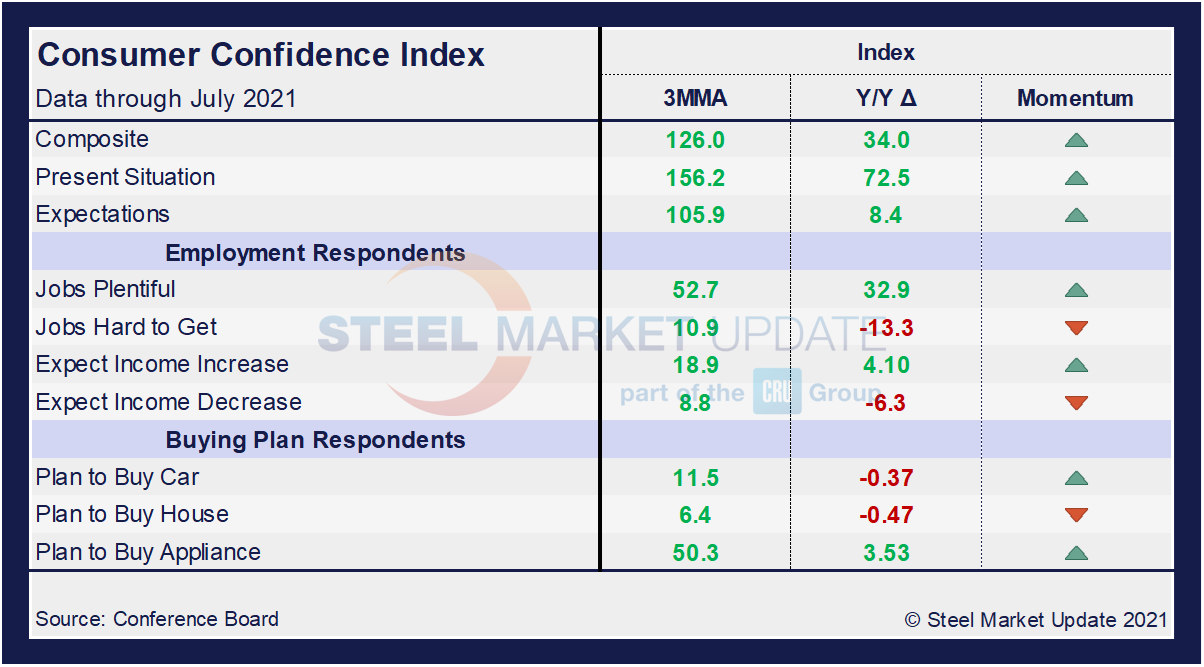
On a 3MMA basis comparing July 2021 with July 2020 in the table below, the present situation is up by 72.5 points, largely sideways from the 70.1 points the month prior. Expectations are a positive 8.4, up from 5.9 in June. The index has experienced less dramatic shifts over the same period, as expectations have been more tempered while the marketplace recovers. Nevertheless, all three indexes show positive gains against year-ago measures. When comparing current 3MMA totals to the 2019 pre-pandemic year, however, the composite is still down 4.5 points while the present situation is down 12.4 points. Only expectations are showing a fractional increase of 0.9 points over that same period. Despite the improvements, the recovery still has more ground to make up. The consumer confidence report also includes both employment data and some purchase plans and these are likewise summarized in the table below. The color codes show improvement or deterioration of the individual components.
The composite, present situation and expectations are not only trending up, but have recovered much of what was lost over the past 12 months from the fallout from the global pandemic. Buying plans for autos, homes and appliances are also up both on a 3MMA basis as well as when compared to year-ago levels; however, the momentum has turned as month-on-month buying plans have slowed since the last round of economic impact payments. The labor market landscape has shifted. Job openings continue to rise and optimism regarding the prospect of increased wages has also improved. The employment measures are all trending in the right direction. Plentiful jobs and expected income increases are trending up, while jobs being hard to get and expected income decreases are all trending down.
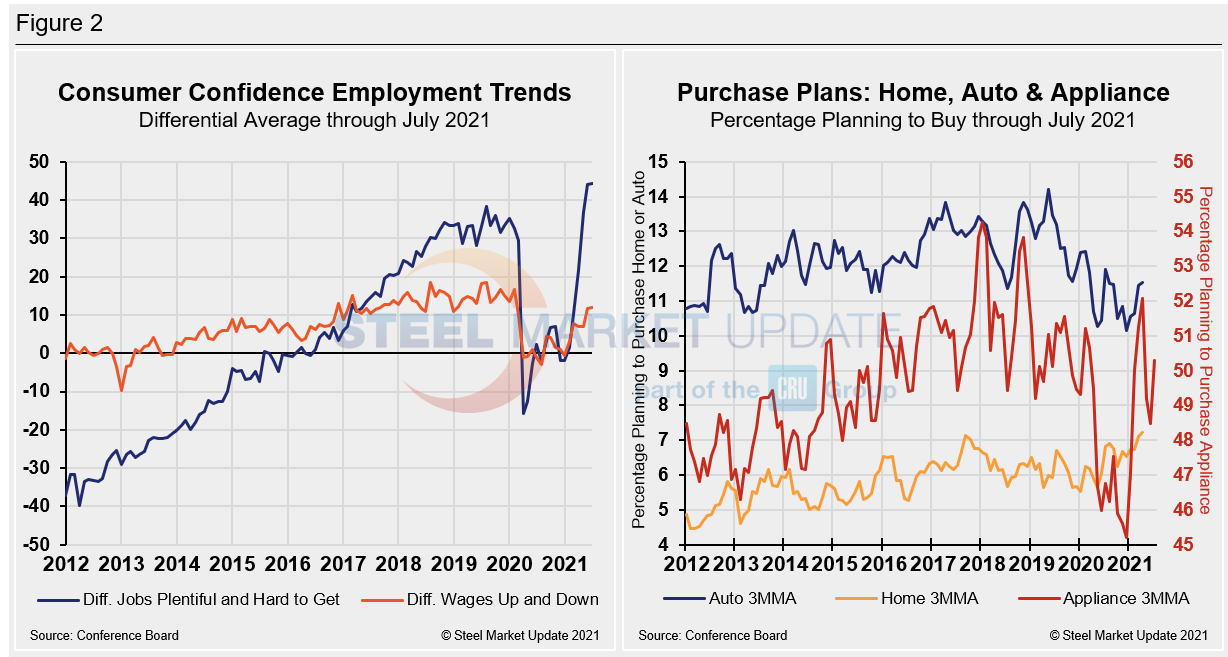
The differential between those finding jobs plentiful and those having difficulty edged up to a positive 44.4 in July, little changed from 44.2 in June. The measure has easily eclipsed the most recent pre-pandemic high of a positive 35.3 in January 2020, and is a strong rally from the negative 1.8 seen at the beginning of the year. It’s also a 60.1-point swing from the negative 15.7 seen at the height of the COVID-19 pandemic last April. Expectations for future wage changes were similarly affected during the peak of the pandemic, but not nearly as much. At its lowest, the measure fell to a negative 3.0 last August. The differential between those expecting wages to rise versus those expecting wages to fall is presently a positive 12.0, up 0.4 from June.
The spending plans for consumer goods as measured by automobiles, homes and appliances had been trending up over the past two consecutive months and following the growth in consumer confidence. Growth in July was marginal for both autos and homes, however, consumer spending on appliances has jumped by 12.5 points over the past two months. Buying plans for appliances were at 56.8 points in July, up from 49.9 the month prior. By comparison, automobile buying plans are presently at an index reading of 13.1, up from 11.5 in June, while home buying plans were 7.0 in July, up just slightly from 6.8 last month. These recent dynamics and historical movements are illustrated below in Figure 2.
SMU Comment: The apparent stability throughout the summer months is a positive mark, as all three main indexes, employment dynamics and buying plans were largely unchanged in July. The market remains in recovery mode, however, and consumer confidence is still a significant gauge of the economy’s present state and near-term direction. An improving job market and fiscal stability will be closely monitored and are key drivers of market growth and consumer confidence in Q3.
About The Conference Board: The Conference Board is a global, independent business membership and research association working in the public interest. The monthly Consumer Confidence Survey®, based on a probability-design random sample, is conducted for The Conference Board by Nielsen. The index is based on 1985 = 100. The composite value of consumer confidence combines the view of the present situation and of expectations for the next six months.
By David Schollaert, David@SteelMarketUpdate.com


