

Market Data

August 15, 2021
SMU Key Market Indicators: Mild Weakening
Written by David Schollaert
Mild weakening of monthly Key Market Indicators, as analyzed by Steel Market Update, may reflect the usual summer slowdown or perhaps growing concern over the latest COVID variant and its possible effects on the economy.
Markers for the Present Situation have contracted for the second straight month and Trends have now followed after a small but positive move the month prior. The markers are not necessarily an evaluation of the economy’s journey from affliction to health because of the pandemic, but rather a holistic assessment of the current situation.
SMU’s Key Market Indicators include a host of data on the economy, raw materials, manufacturing, construction, and steel sheet and long products, offering a snapshot of current sentiment and the near-term expected trajectory of the economy.
In the latest data, nine of the 38 Present Situation indicators are negative, compared to the month prior when seven of the 38 indicators were negative. Negative indicators trended down consecutively from February through May reaching as low as three. However, July’s indicator now stands at nine, which marks the second-highest score year-to-date and is in-line with last year’s slow recovery out of the COVID-doldrums. At its worst, 18 of the 38 indicators shifted negative last year as the economy grappled with pandemic-related disruptions. Even though current measures are far from the downturn seen roughly 18 months ago, the improvements have decelerated and turned, pointing to the complexities of the economic recovery.
SMU’s Present Situation and Trends analyses in the table below are based on the latest available data as of Aug. 18, 2021. Readers should regard the color codes in the “Present Situation” column as a visual summary of the current market condition. The “Trend” columns are also color coded to give a quick visual appreciation of the market’s direction. All data included in this table was released within the past month. The month or specific date to which the data refers is shown in the second column from the far right. Click to expand the table below.
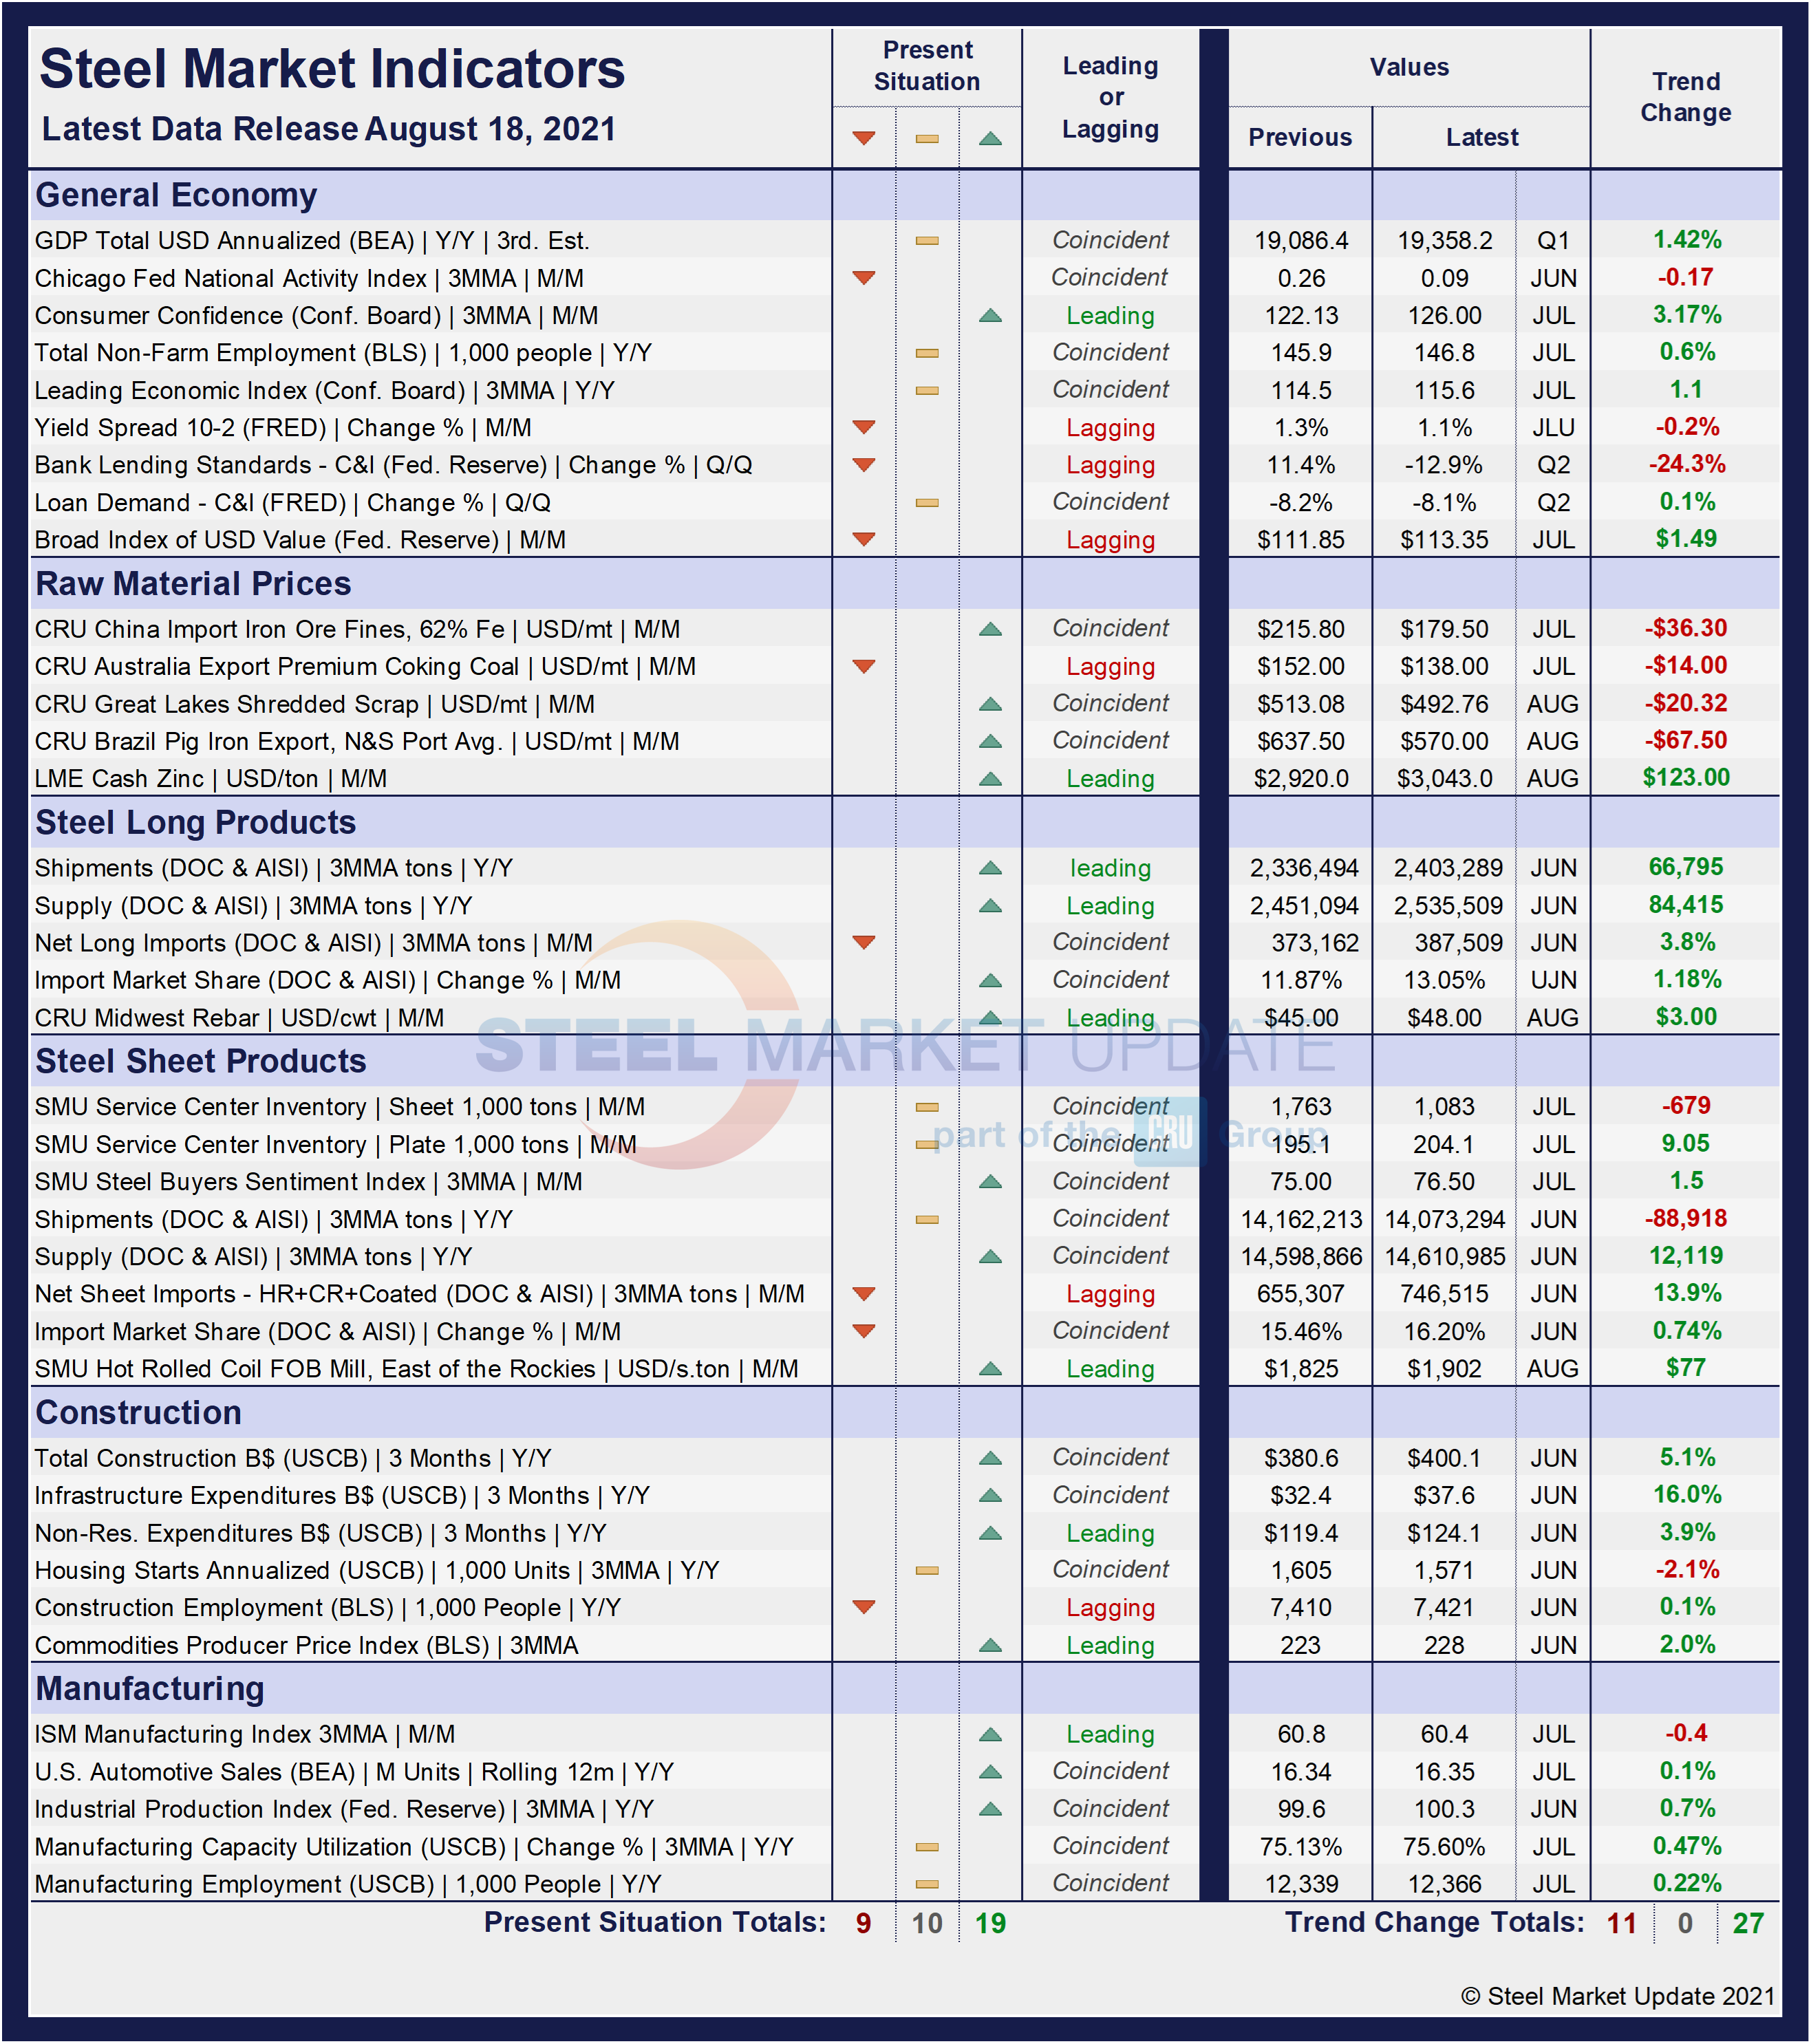
Present Situation
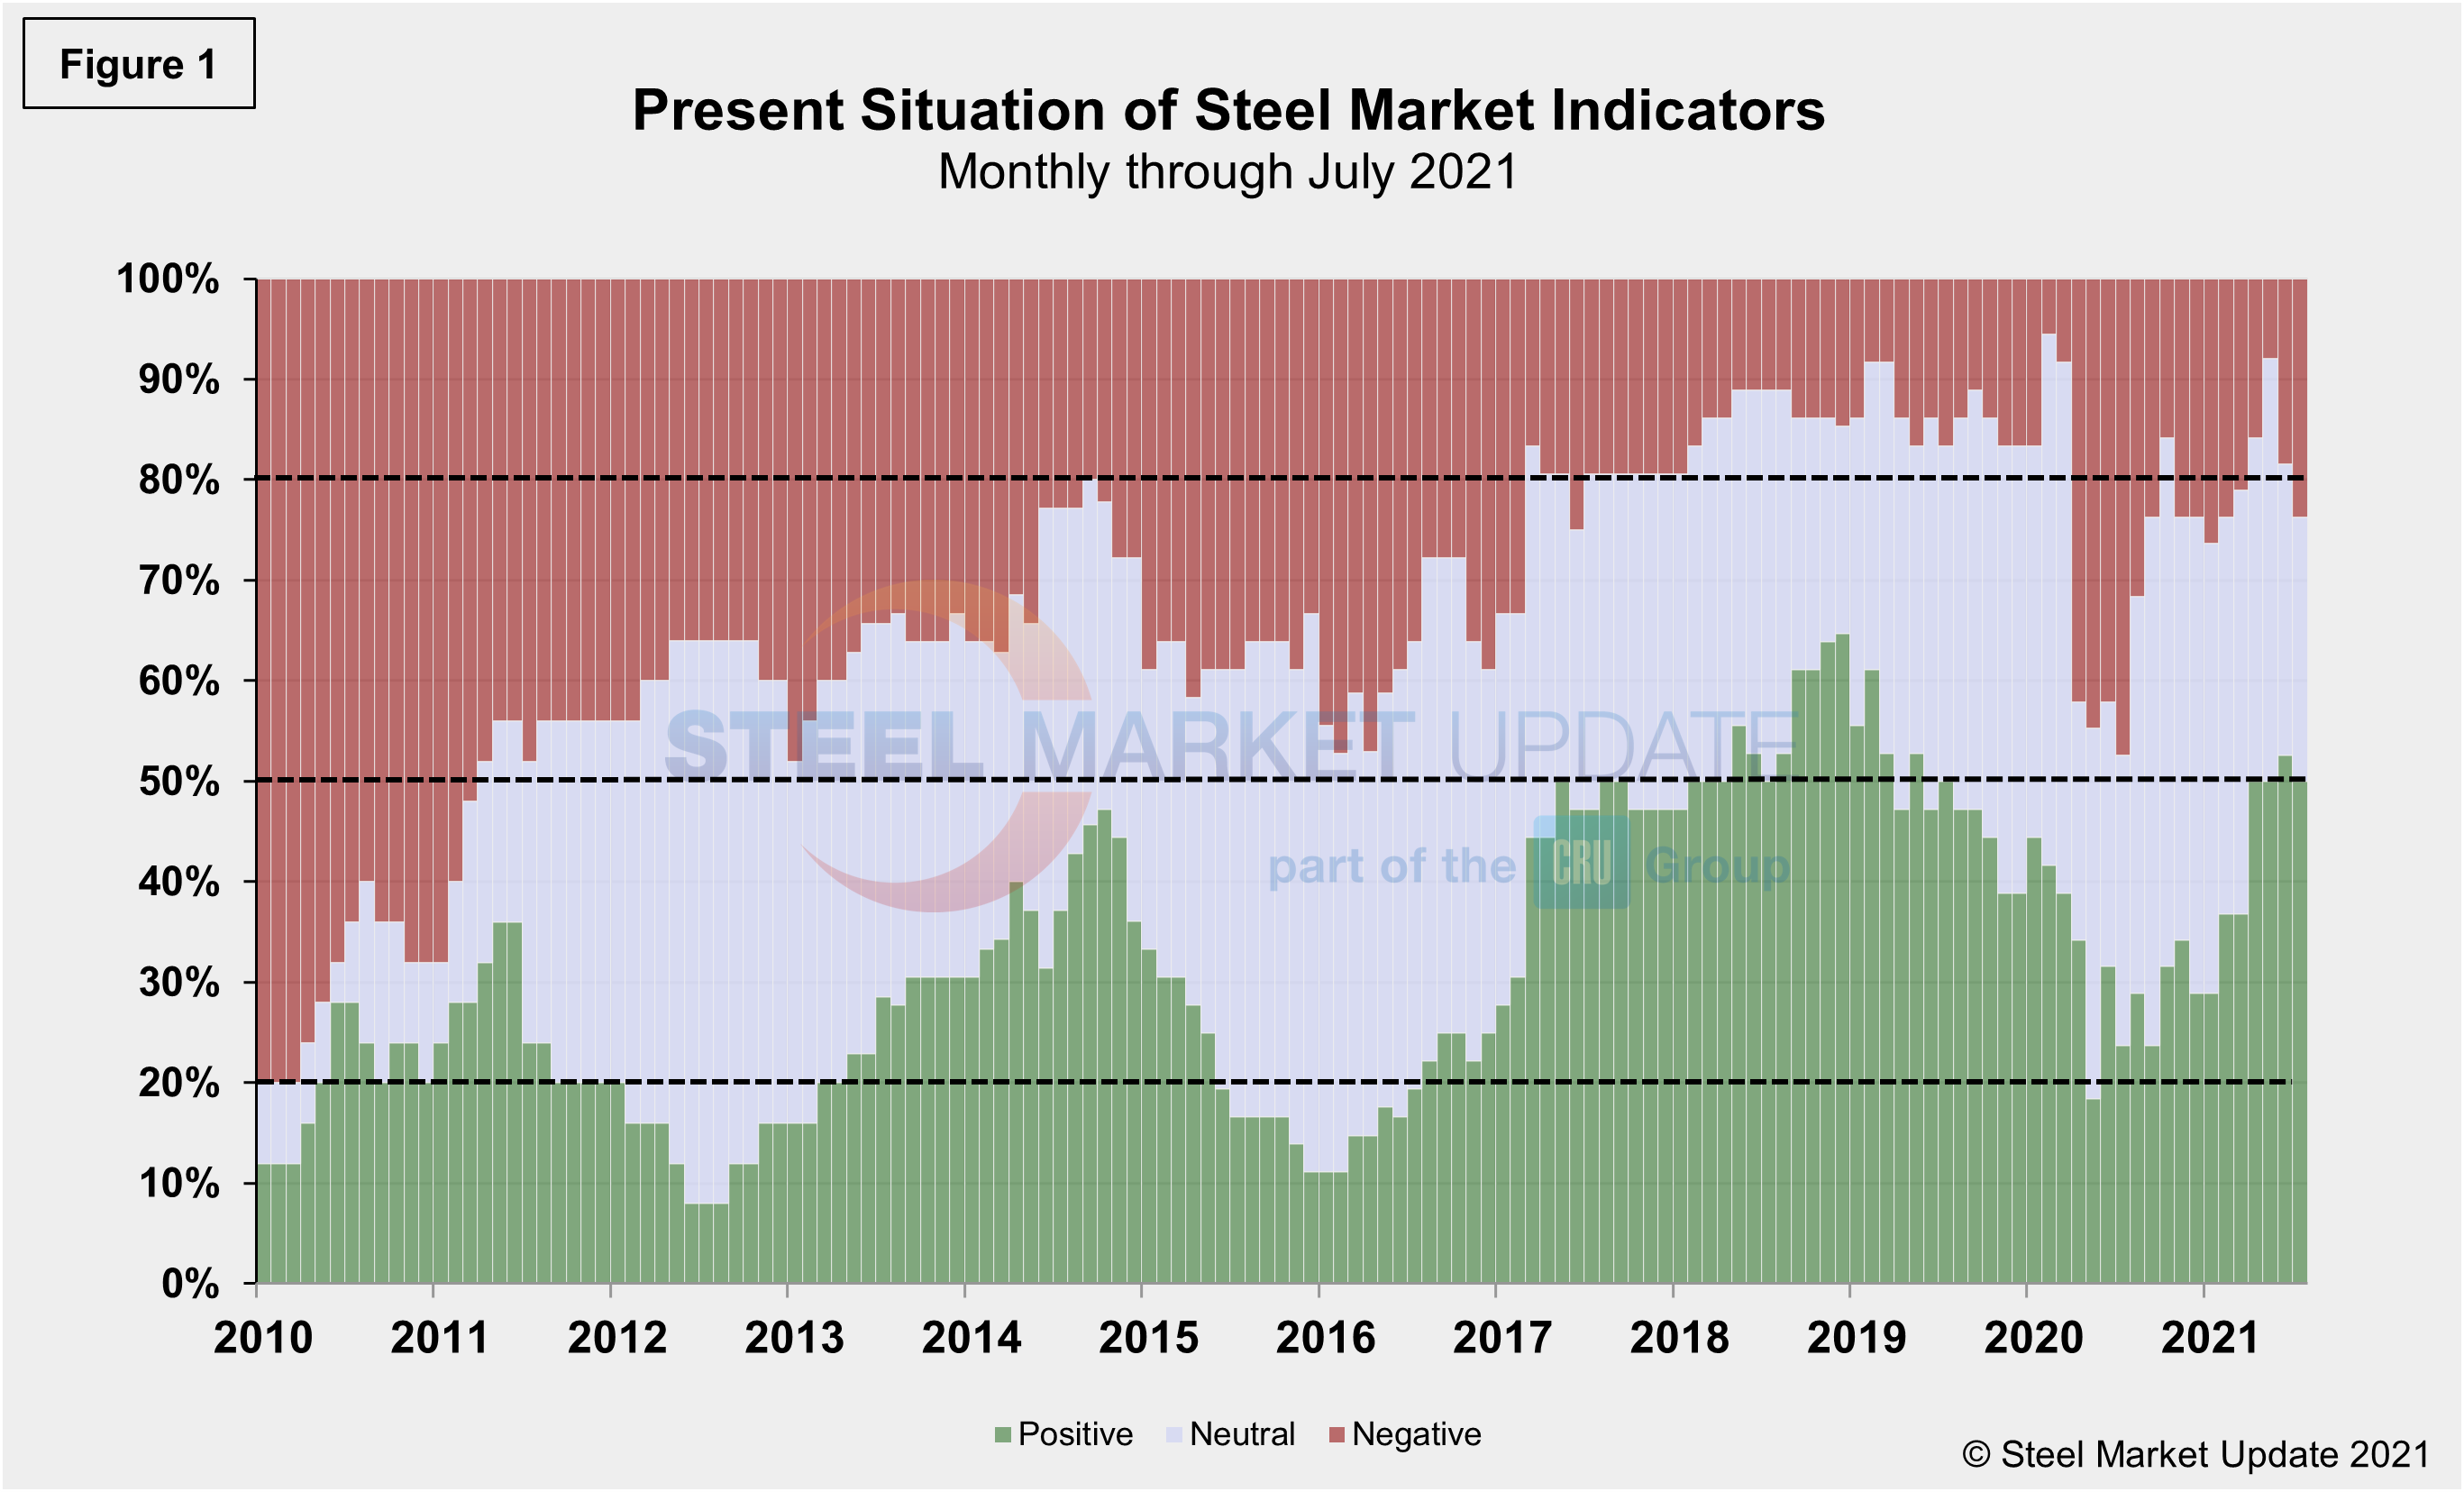
SMU’s Present Situation indicators below show that the road to recovery has been anything but smooth. The trend up until last month was gaining positive ground. Positive indicators rose from 11 to 20 through June, but lost momentum in July. Negative indicators grew twice in as many months. But what may be more telling is that the 16 neutral indicators in May have also faded consecutively in June and July and presently stand at 10.
Supply shortages in the auto and construction sectors, growing producer prices, rising cases of a new COVID-19 variant and other factors may be playing a role in the marketplace’s hesitation and recent turn downward. The Labor Department said that the consumer price index increased 5.4% from a year ago, in line with June’s figure and matching the highest 12-month rate since August 2008.
Present results show a negative shift when compared to last month’s data due to the rise in negative totals. Presently, nearly 24.0% of the marketplace is negative, a 6.0% increase from June and a nearly 16.0% jump from May’s totals. Nevertheless, 76.3% of the population still sees the marketplace as favorable, though that’s a 15.6% decrease from the most recent high in May.
Our most recent assessment indicates that 23.7% see the market’s present situation as negative, a notable deterioration from just 7.9% in May. Neutral fell from 42.1% to 26.3% during the same period, while positive shifted down to 50.0% from 52.6% the month prior. Our monthly assessment of the Present Situation since January 2010 on a percentage basis is shown in Figure 1.
Trends
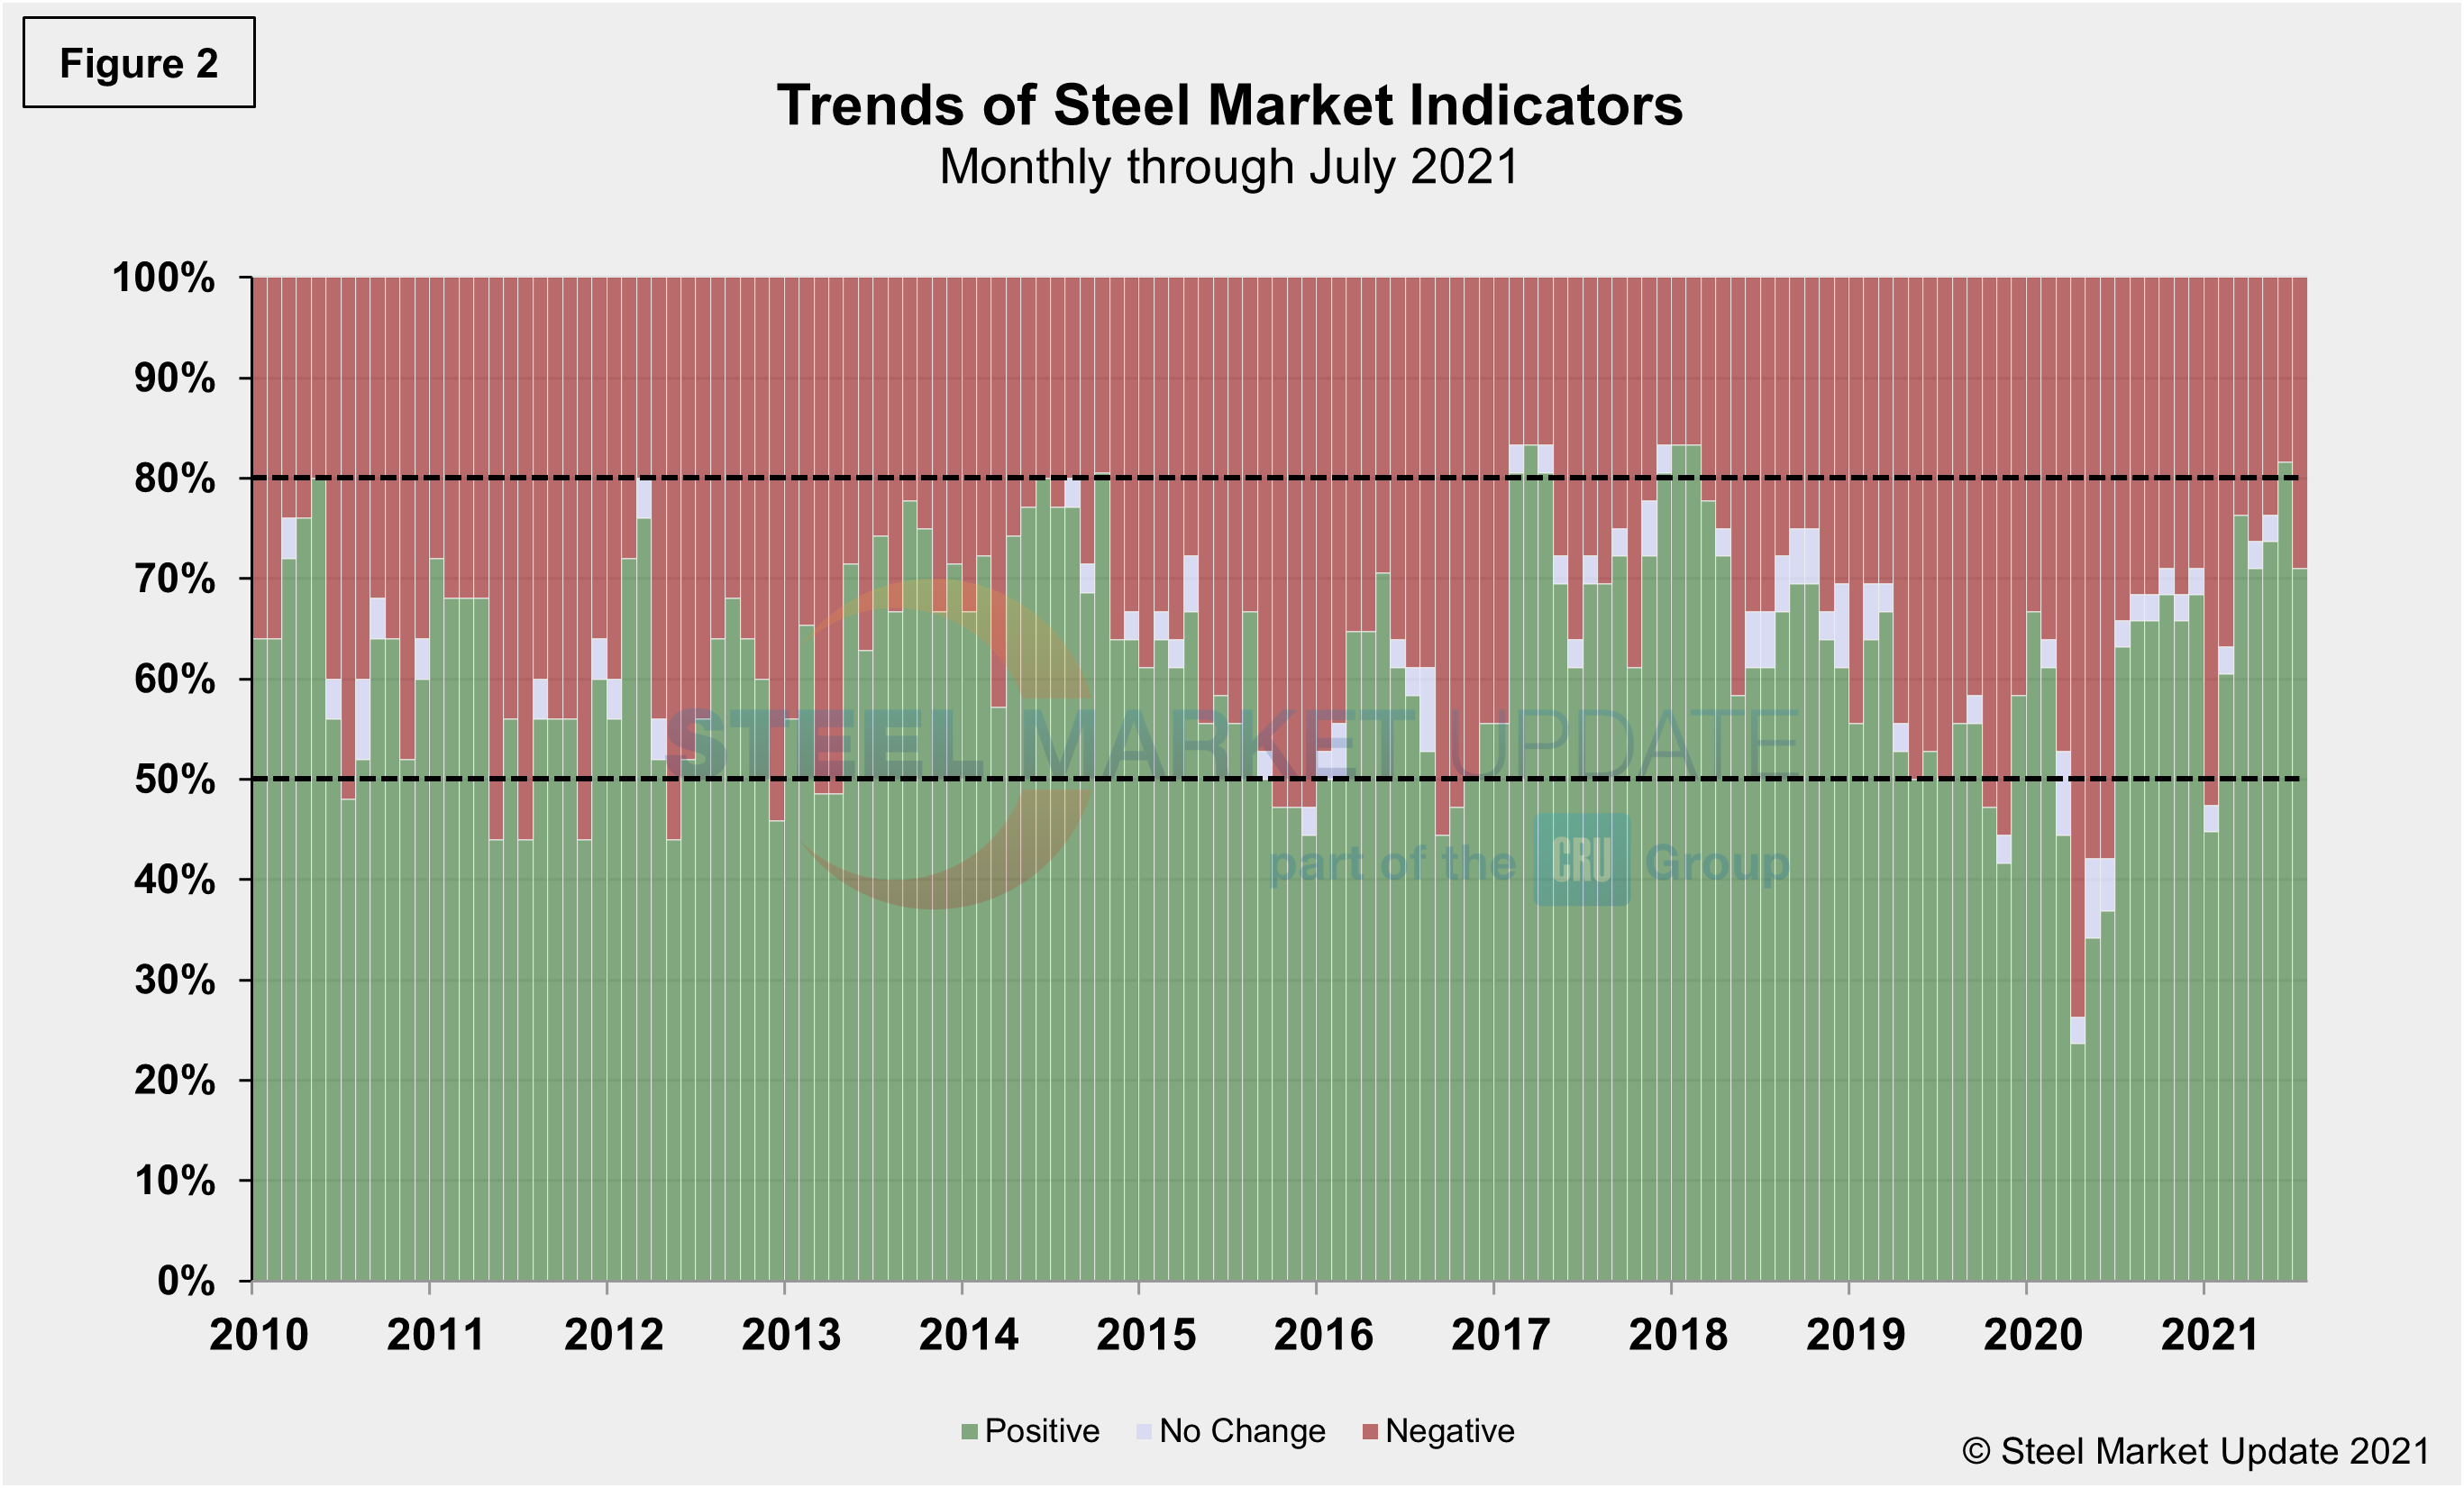
SMU’s Trends indicators saw movement similar to the Present Situation, however, most values in the Trends columns are three-month moving averages (3MMA) to smooth erratic monthly data. Nevertheless, there was a clear shift negative in the latest data. Note that in many cases this is not July or August data, but data that was released in July and/or August for previous months. Compared to month-ago data, the negative trend rose to 28.9%, compared to 18.4% last month. The neutral trend remained at zero, while the positive trend lost ground from 81.6% to 71.1%. These results were a disappointment as the marketplace was trending up, but likely point to some summertime seasonality compounded by continued roadblocks in the economic recovery. Figure 2 shows the recent movement of the trends and historical movement for comparison.
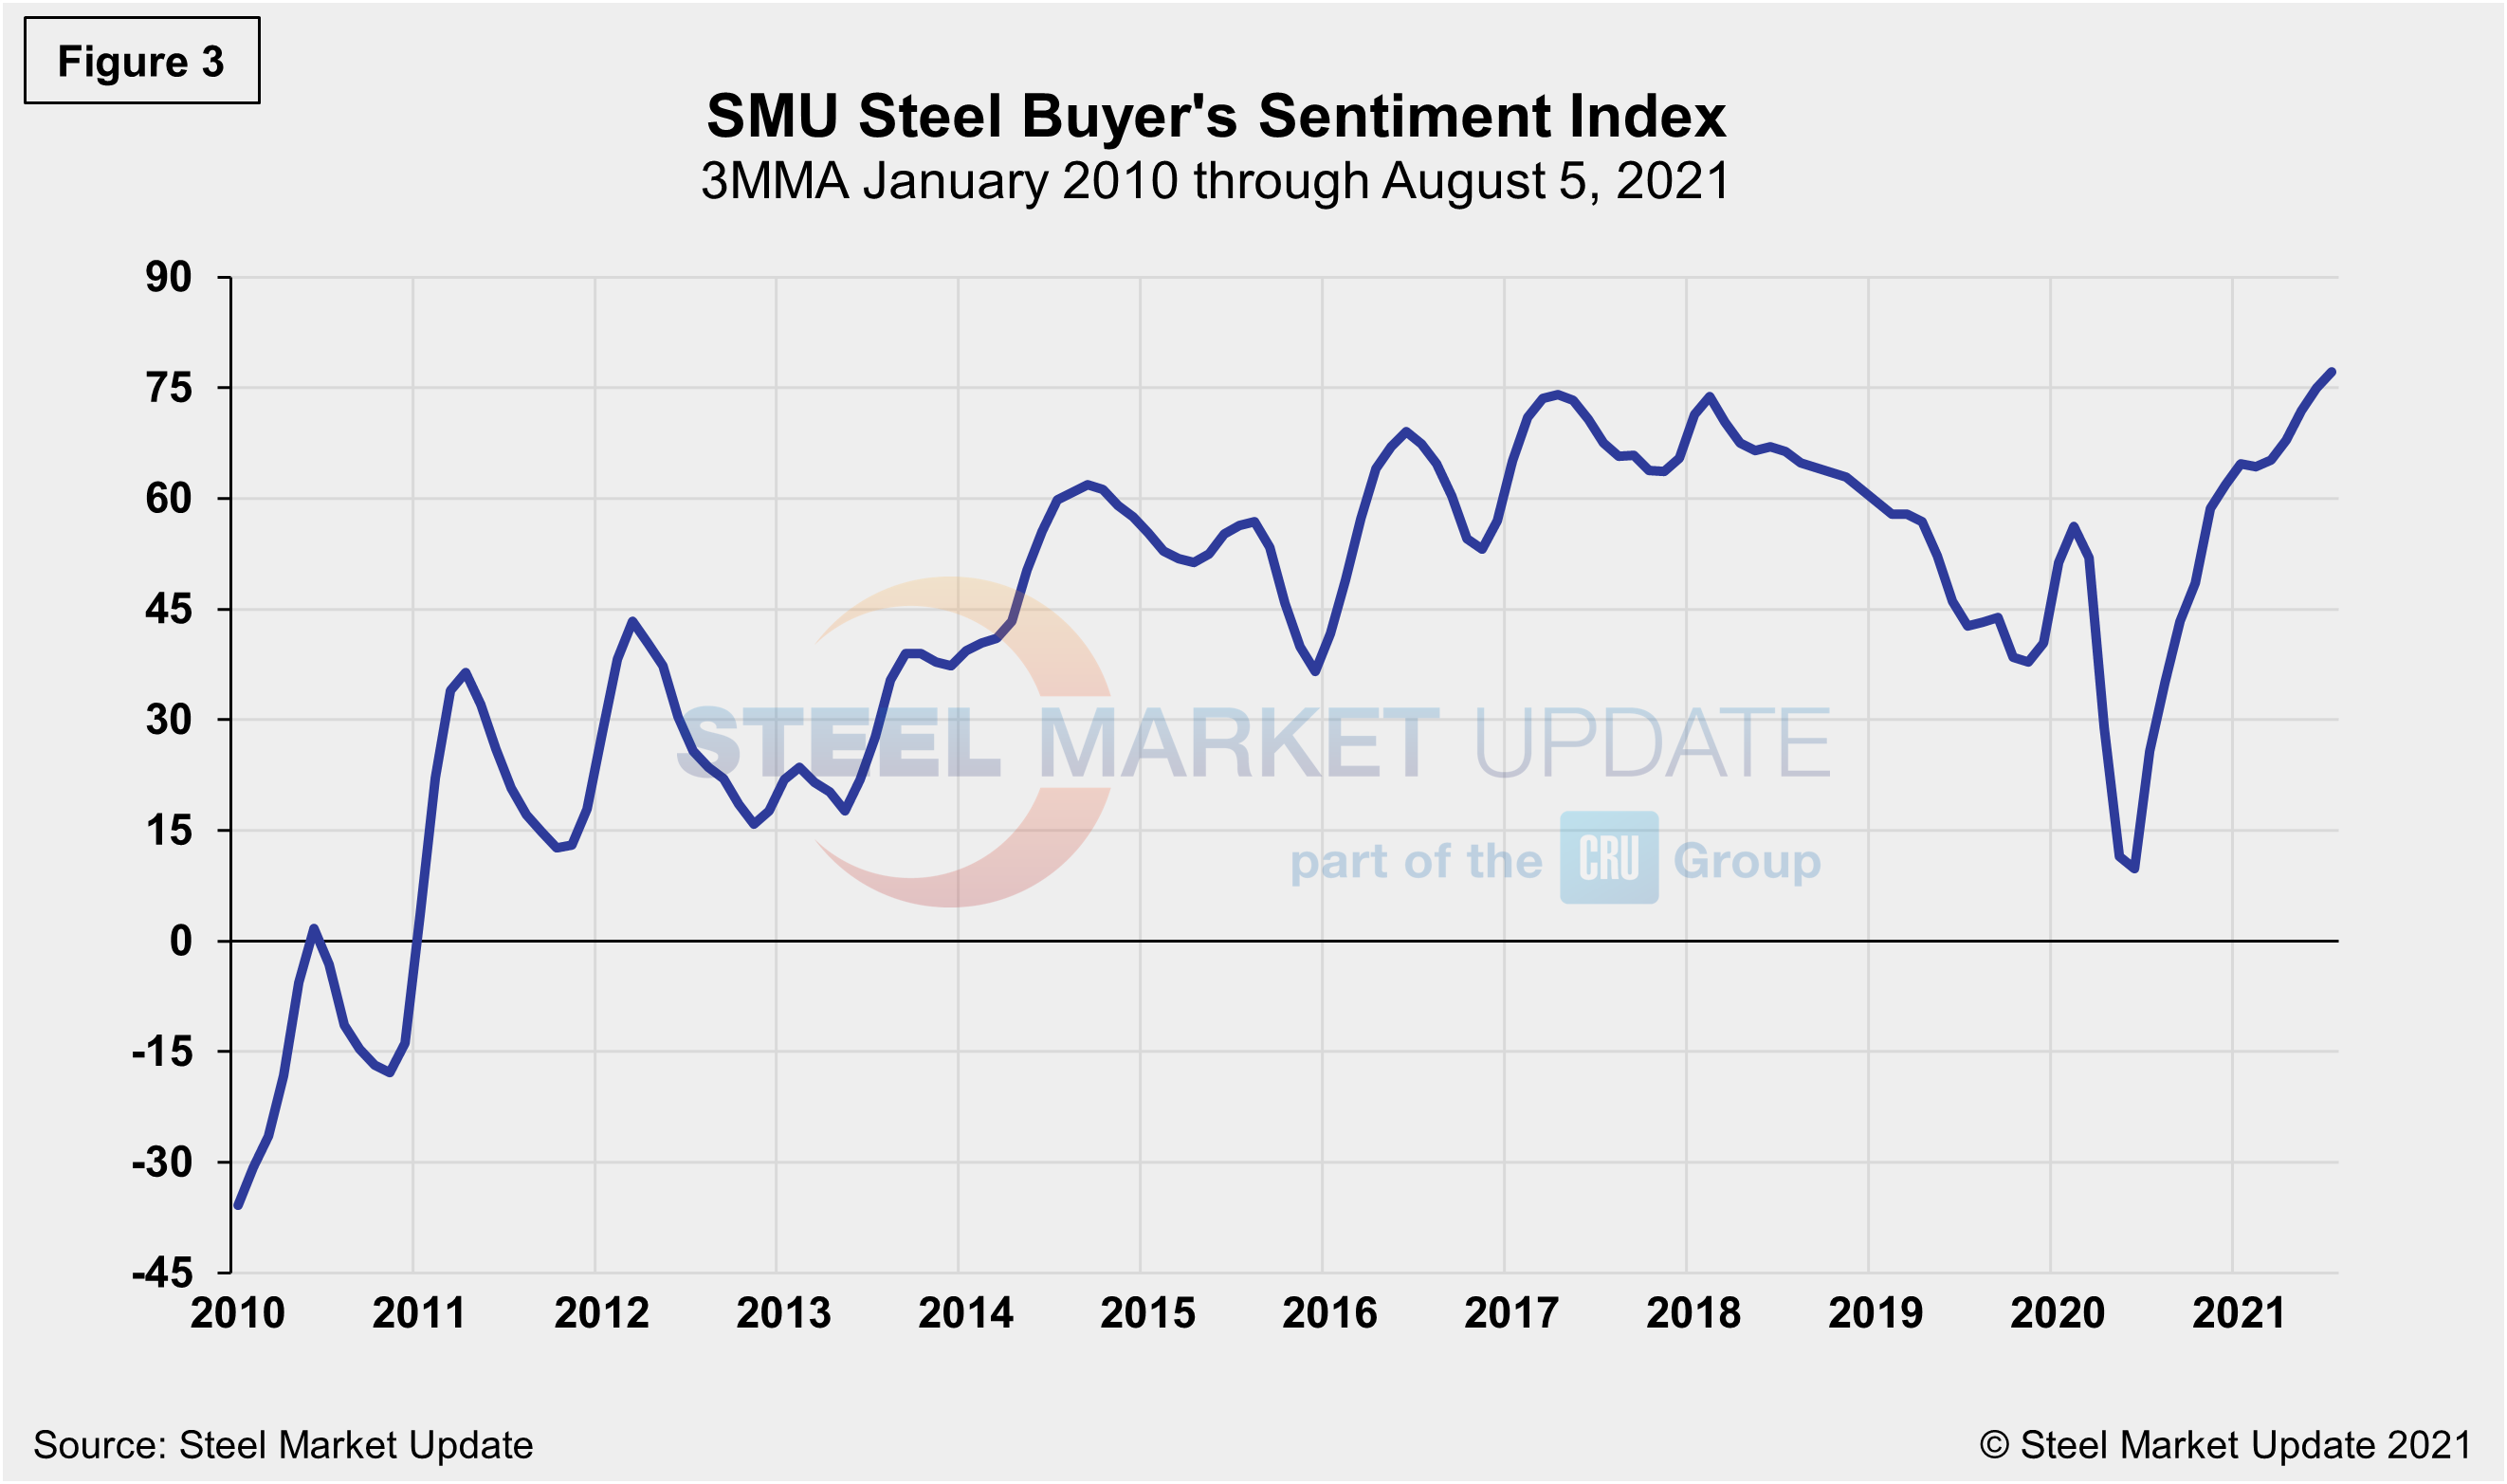
The SMU Steel Buyers Sentiment Index is a measure of the current attitude of North American steel buyers regarding their company’s chances for success in today’s market. The single value of the current sentiment index fell from +58 in early March 2020 to -8 less than a month later. It has since rebounded to a healthy +78 as of Aug. 5. Figure 3 shows the 3MMA of the index since 2010. A reading above the neutral point of zero indicates that buyers have a positive attitude about their prospects. Rising demand and historically high steel prices should keep the Steel Buyer’s Sentiment Index at a highly optimistic level for the foreseeable future.
By David Schollaert, David@SteelMarketUpdate.com


