Market Data

August 16, 2021
Service Center Shipments and Inventories Report for July
Written by Estelle Tran
Flat Rolled = 51.3 Shipping Days of Supply
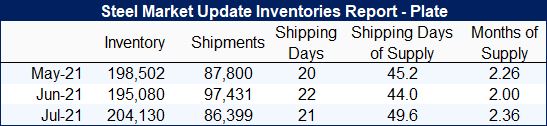
Plate = 49.6 Shipping Days of Supply
Flat Rolled
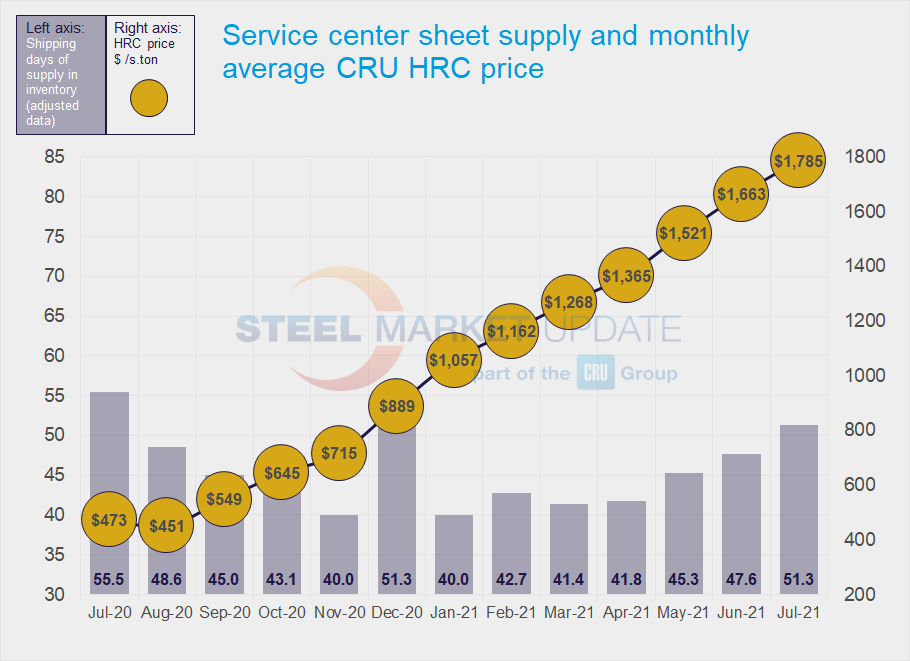
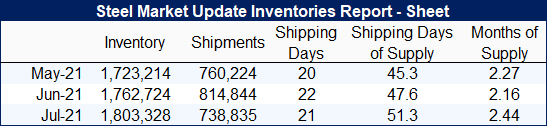
U.S. service center flat rolled inventories spiked in July with better on-time delivery from domestic mills, the arrival of imports and a slowdown in shipments. At the end of July, service centers carried 51.3 shipping days of supply, according to SMU data; this is up from 47.6 in June. In terms of months, flat rolled inventories represented 2.44 months of supply in July, compared with 2.16 months in June.
July had 21 shipping days, while June had 22. With one fewer shipping day and the July 4th holiday, shipments slowed in July, but maybe more than expected. Service center flat rolled shipments dropped 9.3% month on month. Though service centers reported being busy in July, the drop in shipments raises concern about order redundancies as material double-booked at service centers gets cancelled.
While intake went down in July, inventories increased as the daily shipping rate was the lowest level seen since December, and prior to that holiday-shortened month, the lowest level since July 2020. The drop in shipments put inventories in better balance; with 51.3 shipping days of supply in July, inventories are closer to the level seen in July 2019 of 56.1 days.
Anecdotally, service center contacts have said they’re seeing more customers lose out on business or sit out of the market because of the record-high steel pricing. At the same time, we are still seeing a lag in auto demand because of component shortages.
Mill lead times remain extended with HRC lead times over 10 weeks since mid-May, according to SMU survey data, however, service centers have seen better on-time delivery and increased mill production. At the same time, we’re seeing increased import volumes. In June, the U.S. imported one million metric tonnes of flat rolled products, and in July 916,000 tonnes were licensed for import, according to Department of Commerce data.
Imports and extended lead times have been major contributors to the elevated on-order levels. Inventory on order eased back in July, which shows a continuing trend of this measure going down.
With record high steel prices, service centers reported that 61.7% of their inventory was dedicated to contracts, nearly flat compared with June.
Plate
U.S. service center plate inventories also increased in July, perhaps in part because of a slowdown in shipments as well. At the end of July, service centers had 49.6 shipping days of supply on hand, compared with 44 in June. This represented 2.36 months of supply in July versus 2.0 in June.
The daily shipping rate in July was the lowest level reached since August 2020. Multiple market contacts noted the energy sector remaining depressed and a slowdown in business, however, the biggest issue remains constrained supply. Service centers have had to turn away business because they did not have the items in stock. With prices so elevated, service centers said they were only buying what they needed.
Because of the continued market tightness, sales among service centers are also down as service centers focus on their core customers. Some market contacts were optimistic about larger projects going to bid for Q1 2022 as well as the potential for more business next year if the infrastructure bill passes.
The percentage of plate inventory on order edged down month on month. Plate mill lead times remain extended with the latest SMU survey on Aug. 5 showing lead times at 9.83 weeks. Mills continue to tout their strong order books, and the lack of mill floor stock as well as low inventories at service centers should continue to support plate pricing.