

Market Data

September 1, 2021
Consumer Confidence Retreats in August on COVID Concerns
Written by David Schollaert
U.S. consumer confidence declined for the second straight month in August, following a downward revision for the month prior, according to the latest data from The Conference Board. The August index fell by 11.03 points month on month after slipping 3.8 points in July.
“Consumer confidence retreated in August to its lowest level since February 2021 (95.2),” said Lynn Franco, senior director of economic indicators at The Conference Board. “Concerns about the Delta variant—and, to a lesser degree, rising gas and food prices—resulted in a less favorable view of current economic conditions and short-term growth prospects. Spending intentions for homes, autos, and major appliances all cooled somewhat; however, the percentage of consumers intending to take a vacation in the next six months continued to climb. While the resurgence of COVID-19 and inflation concerns have dampened confidence, it is too soon to conclude this decline will result in consumers significantly curtailing their spending in the months ahead.”
Following the second largest month-on-month jump in June, The Conference Board’s consumer confidence index retreated in July and August. Momentum has halted and turned downward; a stark contrast from the growth seen in the five months prior. Consumers have grown uneasy and fatigue may be setting in as the recovery from last year’s COVID doldrums carries on. Strong upward momentum at the start of the year has waned as the index remains behind pre-pandemic levels.
August’s present situation index, which is based on consumers’ assessment of current business and labor market conditions, saw a 9.9-point downturn month on month to 147.3, following a revised decrease of 2.4 points in July. The expectations index, which is based on consumers’ short-term outlook for income, business, and the labor market, saw the sharpest decline, dropping by 12.9 points to 91.4, the lowest mark since January.
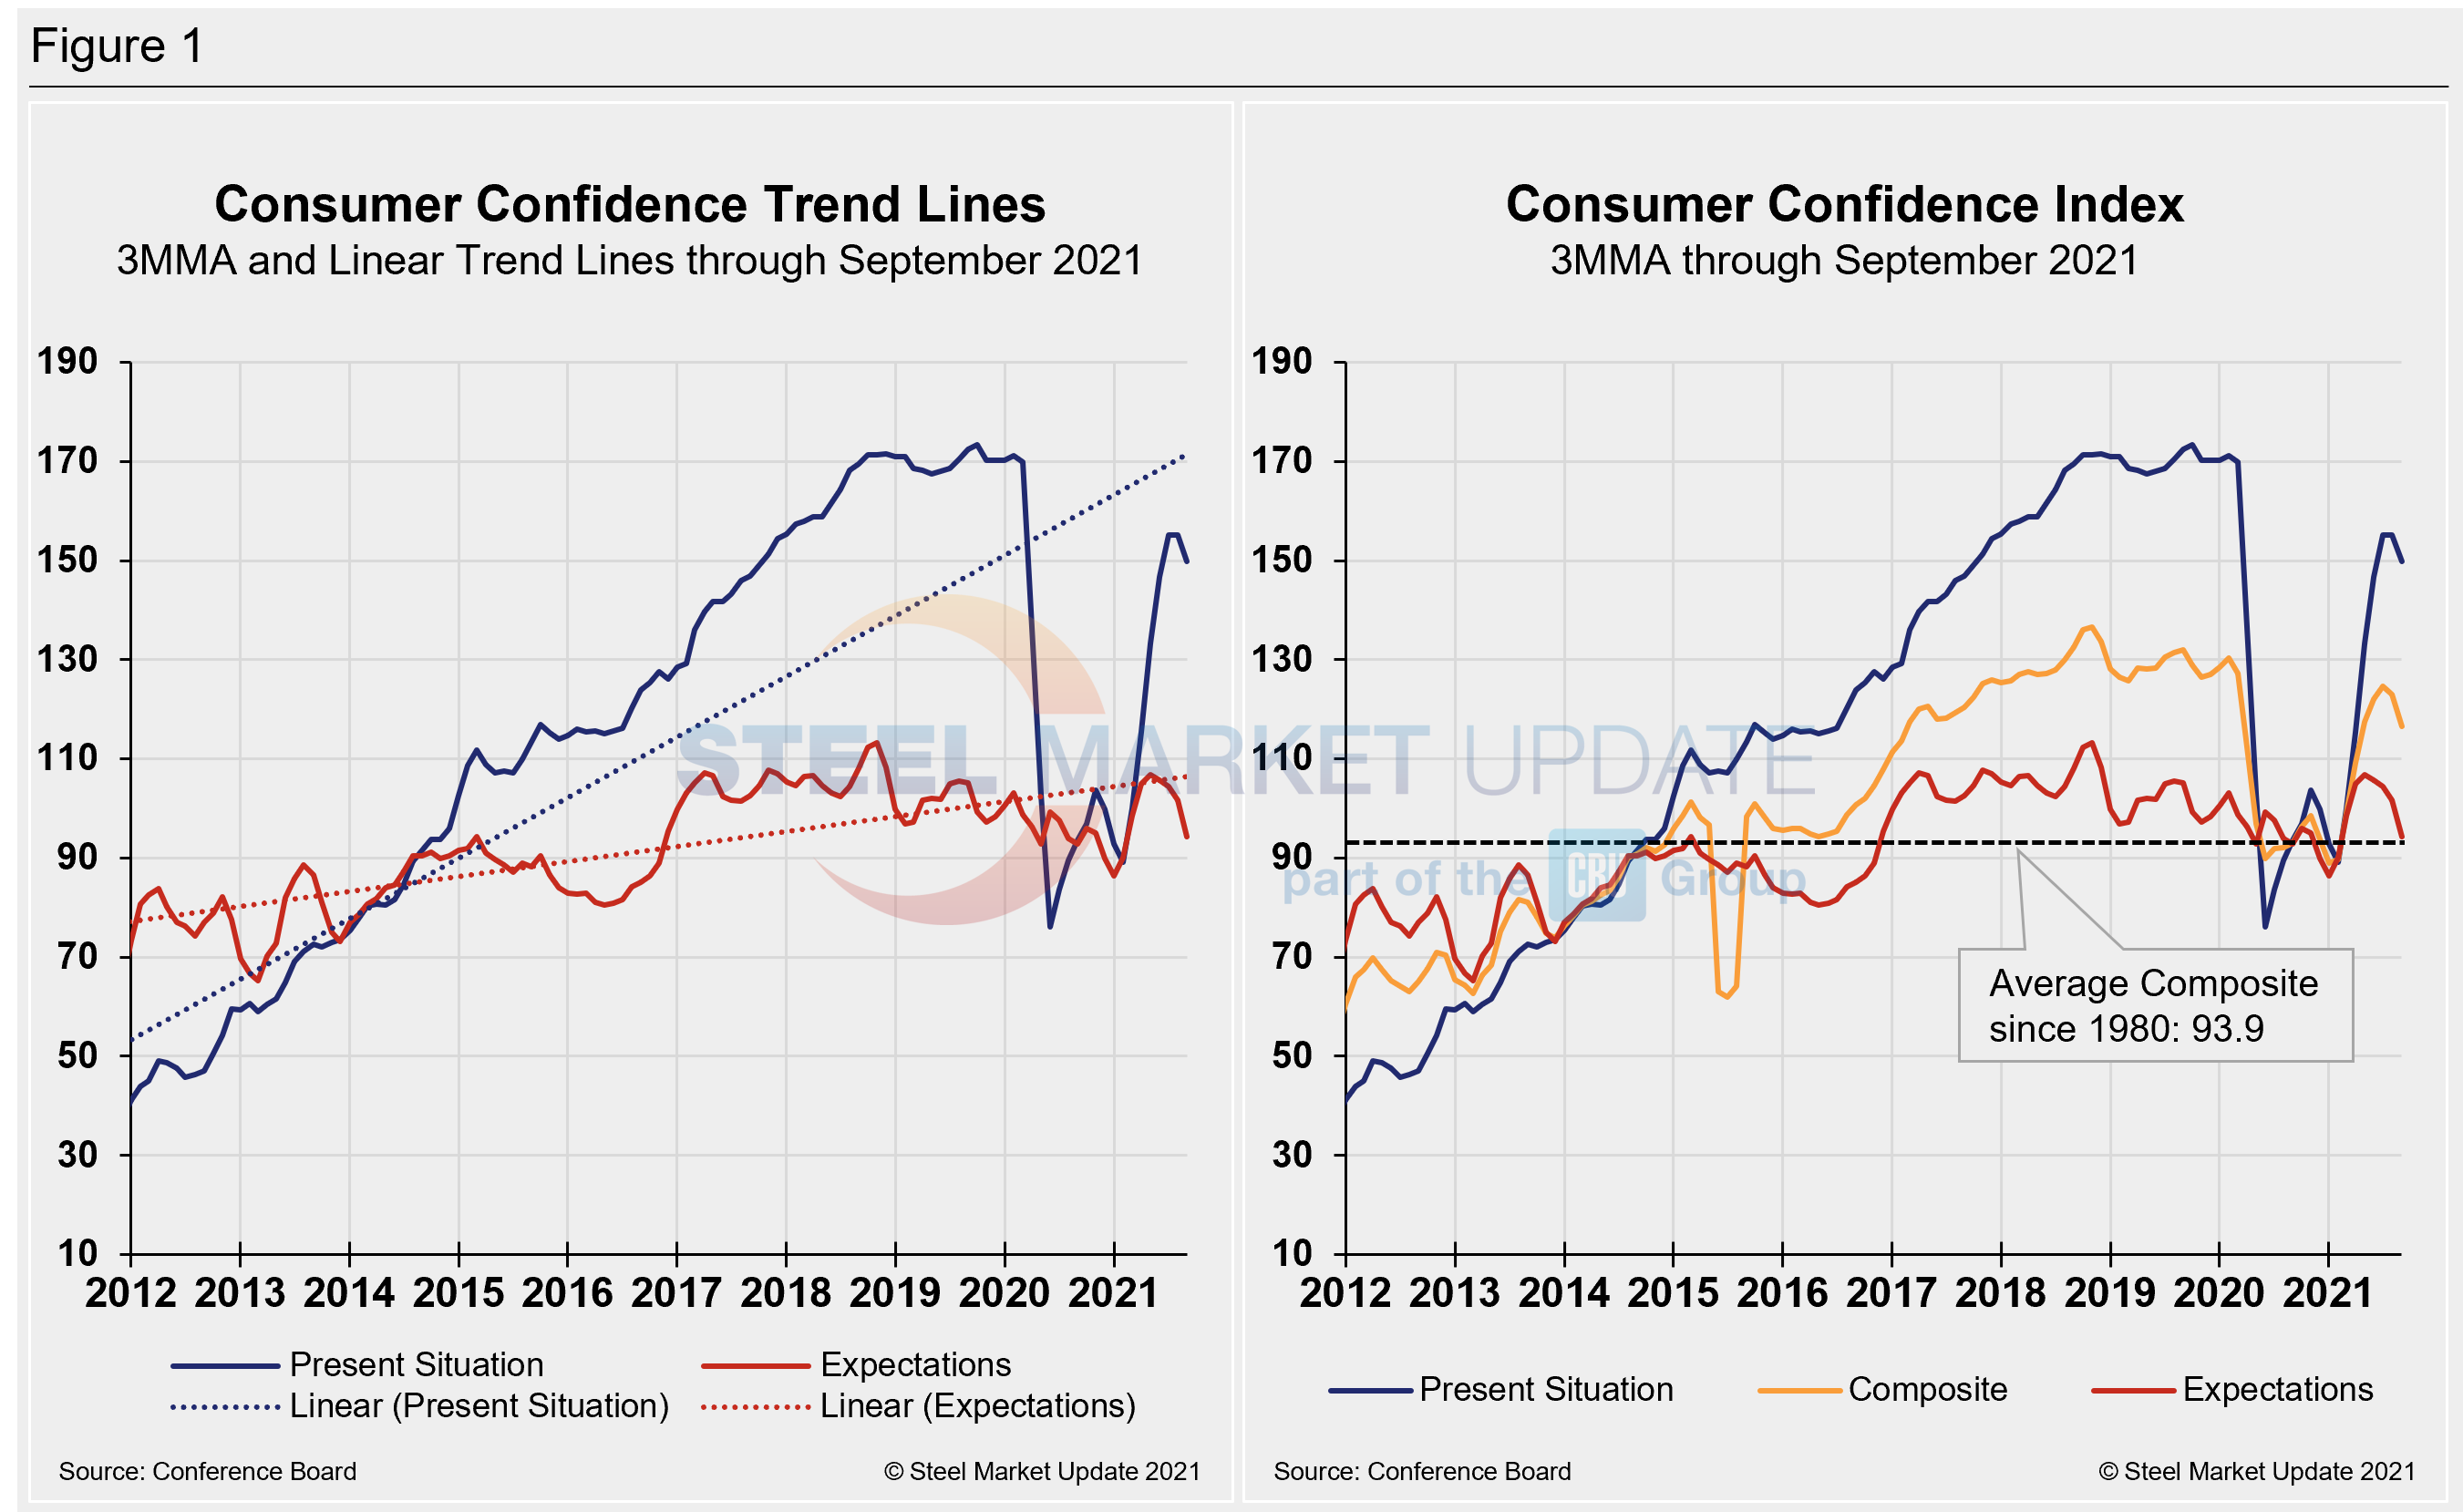
Calculated as a three-month moving average (3MMA) to smooth out the volatility, The Conference Board’s composite index fell in August to 122.6 compared to 124.7 in July – still below the pre-pandemic high of 130.4 last February. Despite the negative turn, the index remains distinctly higher than the 92.1 seen a year ago. The composite index is made up of two sub-indexes: the consumer’s view of the present situation and his or her expectations for the future. Figure 1 below notes the 3MMA linear trend lines from January 2012 through August 2021 versus the trend lines of all three subcomponents of the index: present situation, composite and future expectations. All three were above the average composite line in October 2020 before falling consecutively through February. The surge from March through June pulled all three indexes above the composite line once again, but all have started to erode.
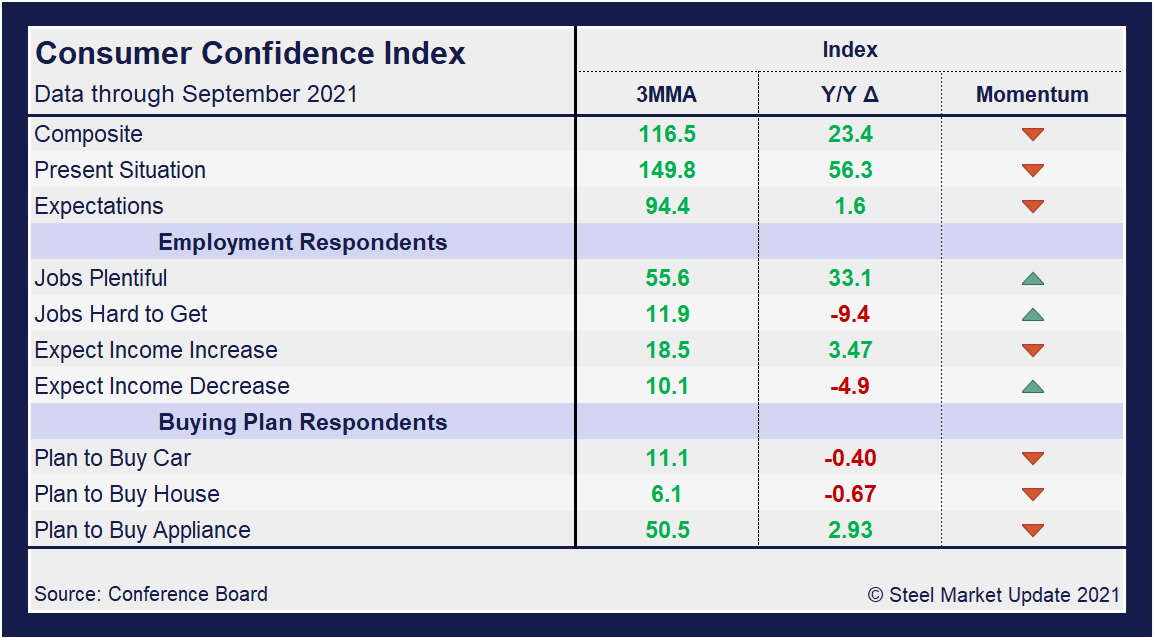
On a 3MMA basis comparing August 2021 with August 2020 in the table below, the present situation has an index reading of 65.2 points, a dip of 6.3 points from the month prior. Expectations are at 7.4, down from 8.4 in July. The index has begun to erode and expectations have been more tempered as the marketplace recovers. Nevertheless, all three indexes show positive gains against year-ago measures. When comparing current 3MMA totals to the 2019 pre-pandemic year, however, the composite is still down 8.8 points, while the present situation is down 15.7 points. The expectations reading, which saw a fractional increase of 0.9 point last month, declined 4.2 points in August year on year. The consumer confidence report also includes both employment data and some purchase plans and these are likewise summarized in the table below. The color codes show improvement or deterioration of the individual components.
The composite, present situation and expectations indices had been trending up, recovering much of what was lost from the fallout from the global pandemic, but momentum has shifted downward over the past two months. Despite recent contraction, buying plans for autos, homes and appliances are also up on a 3MMA basis, but have slipped slightly when compared to year-ago levels as momentum has turned and month-on-month buying plans have retreated.
The labor market landscape has shifted of late. Job openings continue to rise, but optimism regarding the prospect of increased wages has dipped.
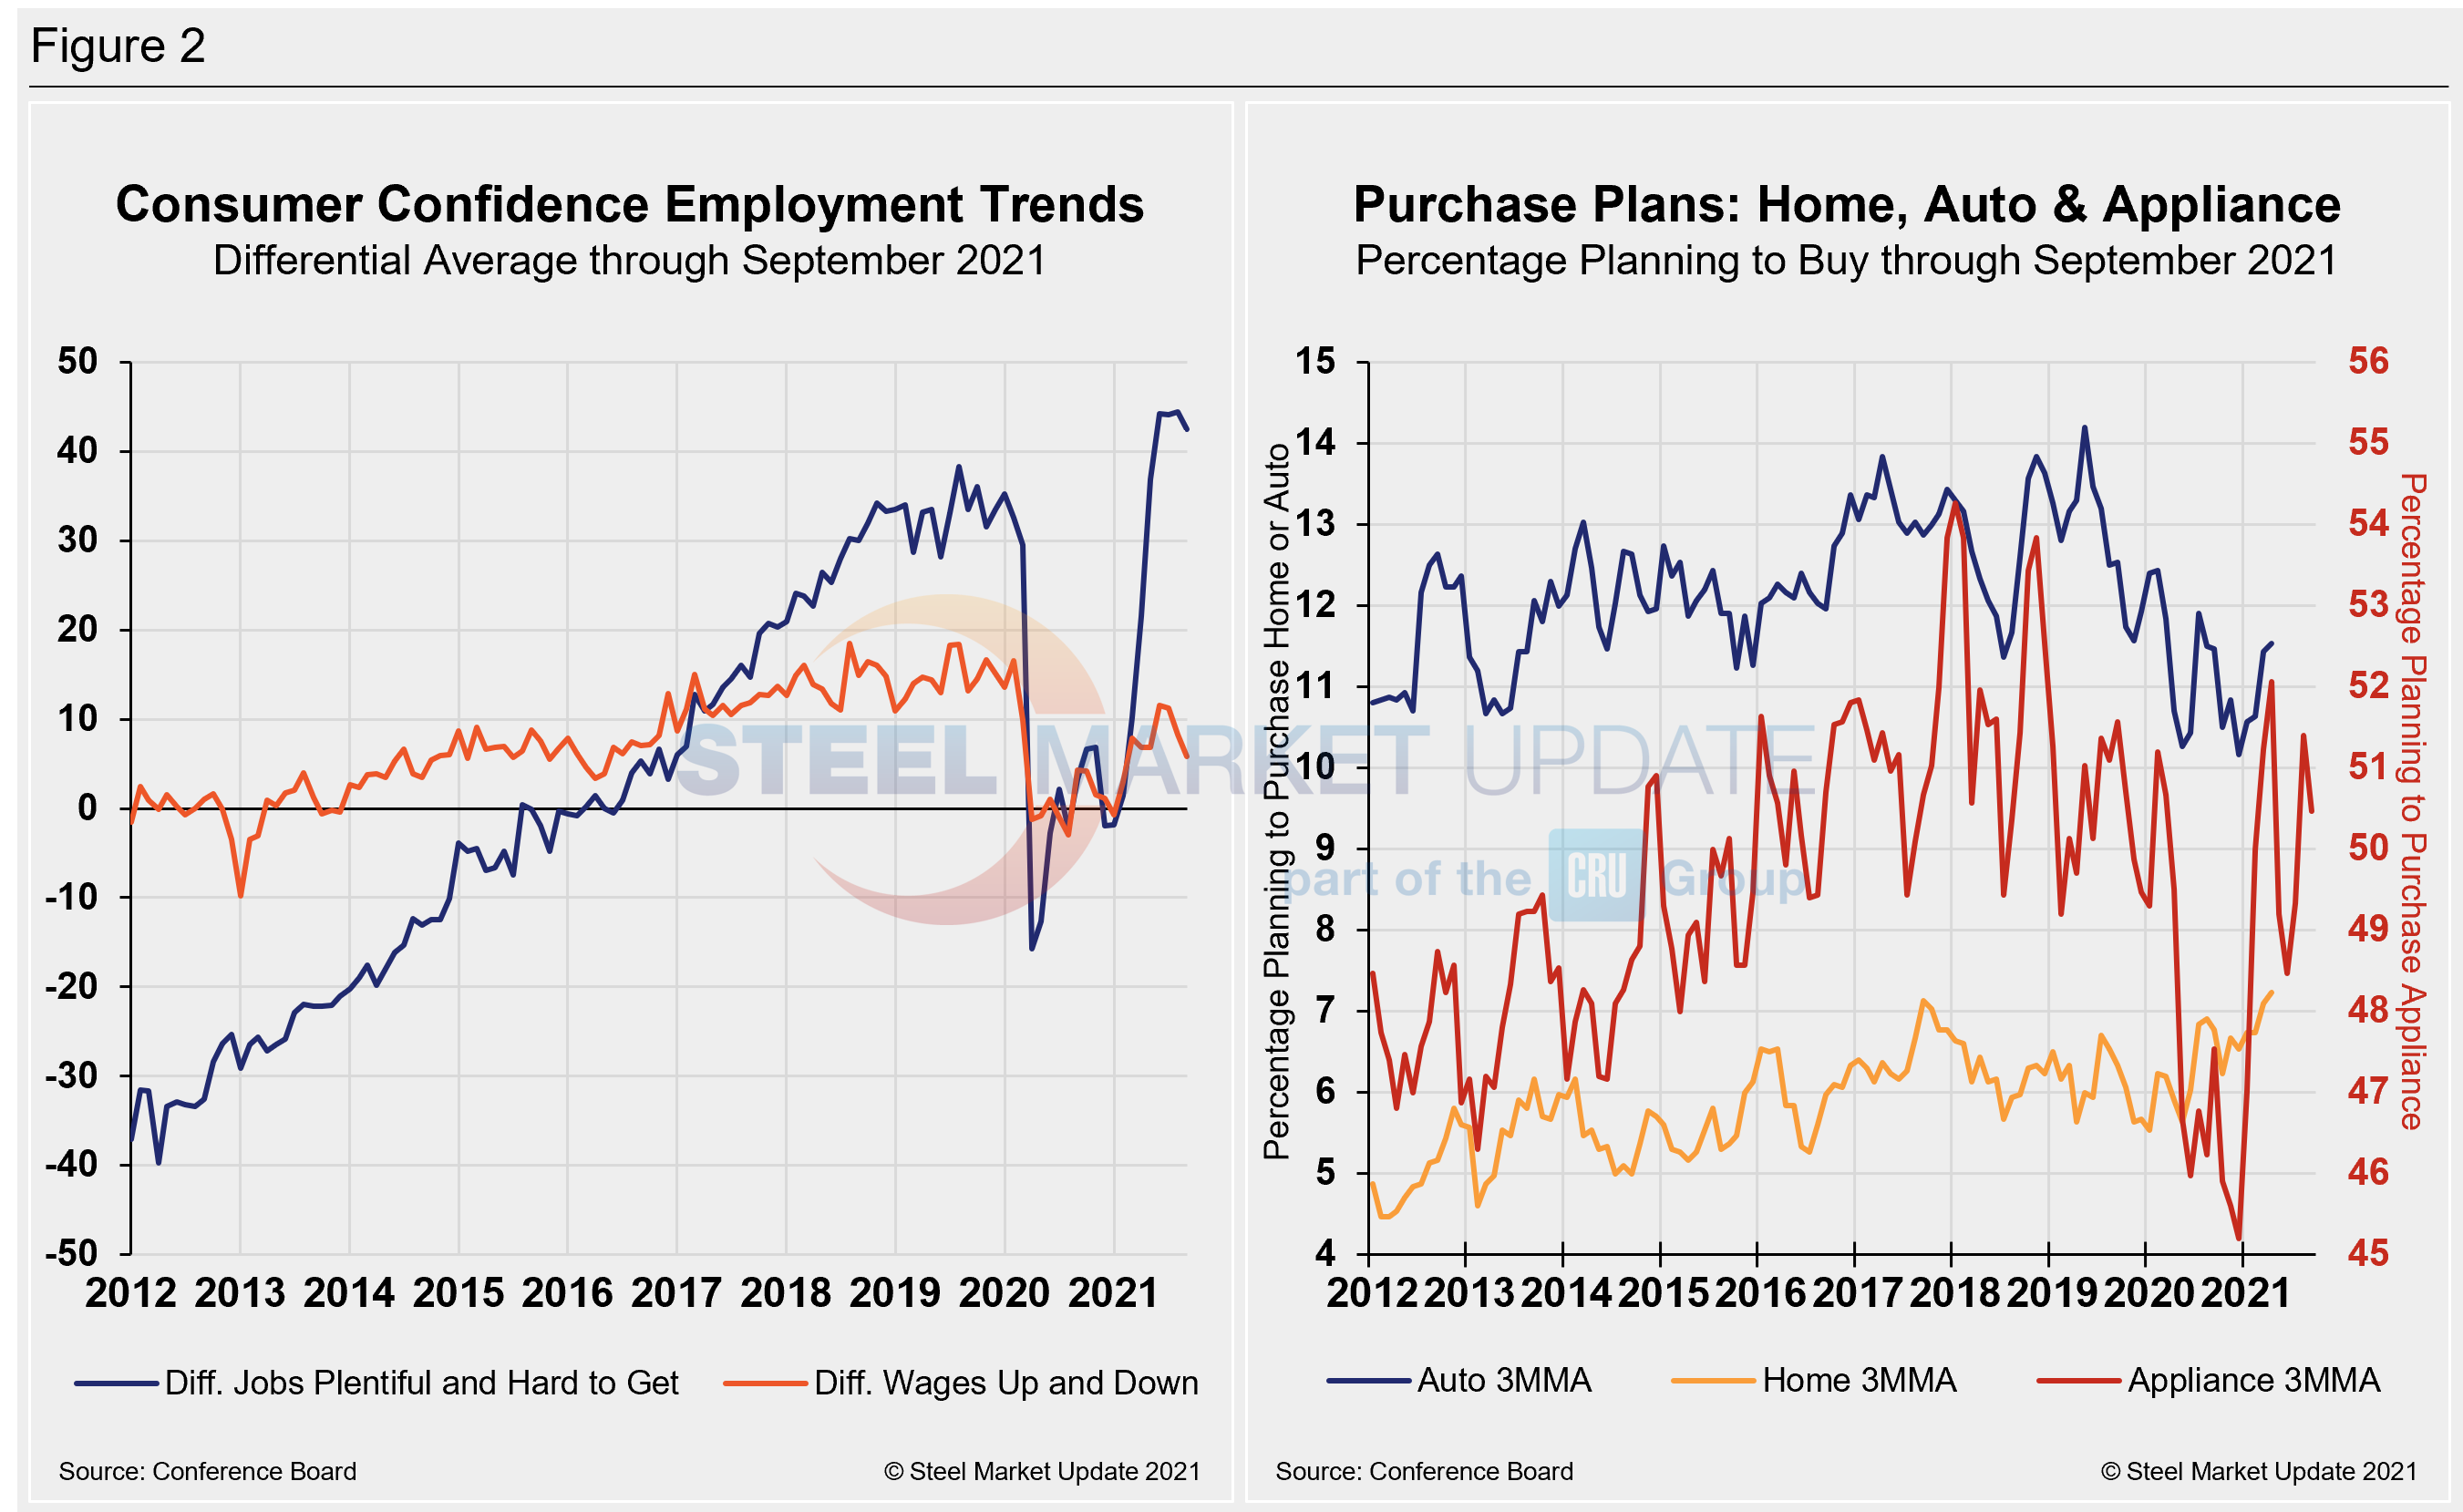
People found jobs more plentiful in August but have grown pessimistic when it comes wage increases. The differential between those finding jobs plentiful and those having difficulty was 44.4 in August, up marginally from 44.1 in July. The measure has easily eclipsed the most recent pre-pandemic high of 35.3 in January 2020, and is a strong rally from the -1.8 seen at the beginning of the year. The differential between those expecting wages to rise versus those expecting wages to fall is presently 7.8, down 3.4 points month on month and down from the recent high of 11.6 in June.
Spending plans for consumer goods as measured by automobiles, homes and appliances had been trending up through June, then it was a mixed bag in July. August figures, however, are all down, as spending on consumer goods has declined. Buying contracted across all three categories in August. Consumer spending on appliances saw the most agressive decrease, falling by 3.7 points to 50.2 in August. Automobile buying plans slipped to an index reading of 10.8, while home buying plans edged down to 6.2 in August. These recent dynamics and historical movements are illustrated below in Figure 2.
SMU Comment: The upward trajectory and momentum have given way to repeated decreases in July and August across all indexes. Although the contraction is not a cliff dive, the turn is concerning given there is still a long road ahead for the economic recovery. Renewed mandates for masks and other safety measures to thwart further advancement of the Delta variant may be shaking consumer confidence.
About The Conference Board: The Conference Board is a global, independent business membership and research association working in the public interest. The monthly Consumer Confidence Survey®, based on a probability-design random sample, is conducted for The Conference Board by Nielsen. The index is based on 1985 = 100. The composite value of consumer confidence combines the view of the present situation and of expectations for the next six months.
By David Schollaert, David@SteelMarketUpdate.com


