Market Data

September 16, 2021
Service Center Shipments and Inventories Report for August
Written by Estelle Tran
Flat Rolled = 51.6 Shipping Days of Supply
Plate = 54 Shipping Days of Supply
Flat Rolled
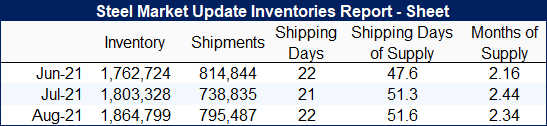
U.S. service center flat rolled inventories continued to grow in August, while shipments rose from the lower levels seen in July. At the end of August, service centers carried 51.6 shipping days of flat rolled supply on an adjusted basis, up slightly from July’s 51.3 shipping days of supply. In terms of months, supply edged down to 2.34 months of supply in August, compared to 2.44 months in July. August had 22 shipping days, which was one more than July.
In July, shipments were weaker than expected, even considering seasonality, however, August shipments picked up. The daily shipping rate is down from the strong levels seen in the spring, yet inventories continue to rise. Supply at service centers seems to be in balance with outbound shipments, though both remain below pre-pandemic levels. Shipments to the auto sector remain challenged by component shortages.
The amount of material on order edged down month on month, which was expected as inventories have found a better balance and mill lead times have shortened.
We continue to hear that inventories are leaner than many contacts would like – especially for light gauge and specialty products – and some mills are declining to offer material. At the same time, some buyers have noted that spot availability has increased, and mills are trying to offer higher-priced material with shorter lead times. Mills continue to control the amount of spot volume offered, which market participants say has helped to keep supply tight and prices high.
The lack of spot availability for certain products, large spread between domestic and import offerings and opportunities afforded by futures contracts are keeping buyers booking imports.
Plate
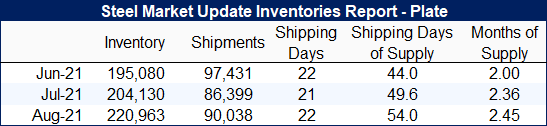
U.S. service center plate inventories also rose in August, as shipments increased modestly month on month. At the end of August, service centers carried 54 shipping days of plate supply; this is up from 49.6 in July. Plate inventories represented 2.45 months of supply in August, up from 2.36 months in July.
Though service centers have noted that inventories are low, and they do not have the stock to quote all items, they also said that they were only buying items they could sell because of high prices. At the same time, the plate mills have been disciplined about holding prices up and keeping buyers on allocation. Allocations have been less impactful lately, as service centers continue to focus on the items that they can move quickly to avoid carrying too much high-priced inventory.
Plate shipments increased only 4% in August, despite having one extra shipping day. Strong demand in the construction and manufacturing sectors has helped to support the plate markets, though some contacts have noted delayed projects. Demand from the energy sector continues to lag.
The amount of material on order is down from the peak seen at the end of July. Mill maintenance outages have helped to keep lead times extended, and mills have largely been successful enforcing price increases.