

Plate

October 11, 2021
August Import Market Share for Sheet and Plate Products
Written by David Schollaert
In the face of strong demand, limited availability and record-high prices in the U.S., steel buyers have looked overseas for relief. August Commerce Department data shows steel imports have been on the rise for the past three months, with imports’ share of total sheet product shipments reaching 17.5%, up from 16.7% the month prior, and the highest level in nearly four years. Market share of plate product imports edged down slightly in August to 21.1%, versus 21.7% the month prior, on an increase in domestic plate shipments.
Imports’ share of domestic sheet product shipments hit its lowest level in more than a decade at 9.7% at the beginning of 2020. Since then, except for a slight contraction in April, sheet imports into the U.S. have risen month on month. Even though shipments of sheet products by domestic mills were up 2.7% in August, imports of sheet products rose by 8.2% month on month, pushing imports’ share to the highest mark since October 2018, when the import share of sheet products was 18.0%.
Plate products in August saw an overall increase in shipments as apparent supply rose by 1.4% month on month. The gain was driven by domestic deliveries of plate products, up 2.2%, while imports edged down 1.6% during the month. Despite the slight decrease in total foreign plate products, August’s total at 169,004 tons was the second highest all year, only behind July’s 11.5% surge the month prior. Overall, despite the slight dip in foreign supply of plate products month on month, it was still the second highest since April 2019.
Domestic sheet shipments in August totaled 4.665 million tons, the highest total since March 2018. Imports of sheet products in August totaled 986,432 tons, up from 911,559 tons the month prior and the highest mark since April 2018 when imports totaled 1.074 million tons.
The import share of hot rolled coil (HRC) rose 2.2 percentage points to 16.0% in August, the highest mark since July 2016. The increase in share was driven by a 23.7% surge in imports month on month. HRC imports totaled 369,790 tons, more than tripling totals from last August.
Imports of galvanized (hot dipped and electrolytic) and other metallic coat products also accelerated in August. Galvanized imports totaled 276,421 tons in August – the highest total since June 2018 – pushing market share to 15.9%, up from 14.4% the month prior. Other metallic coat imports were up 6.5% month on month in August, pushing the import market share up to 25.0% or 109,616 tons.
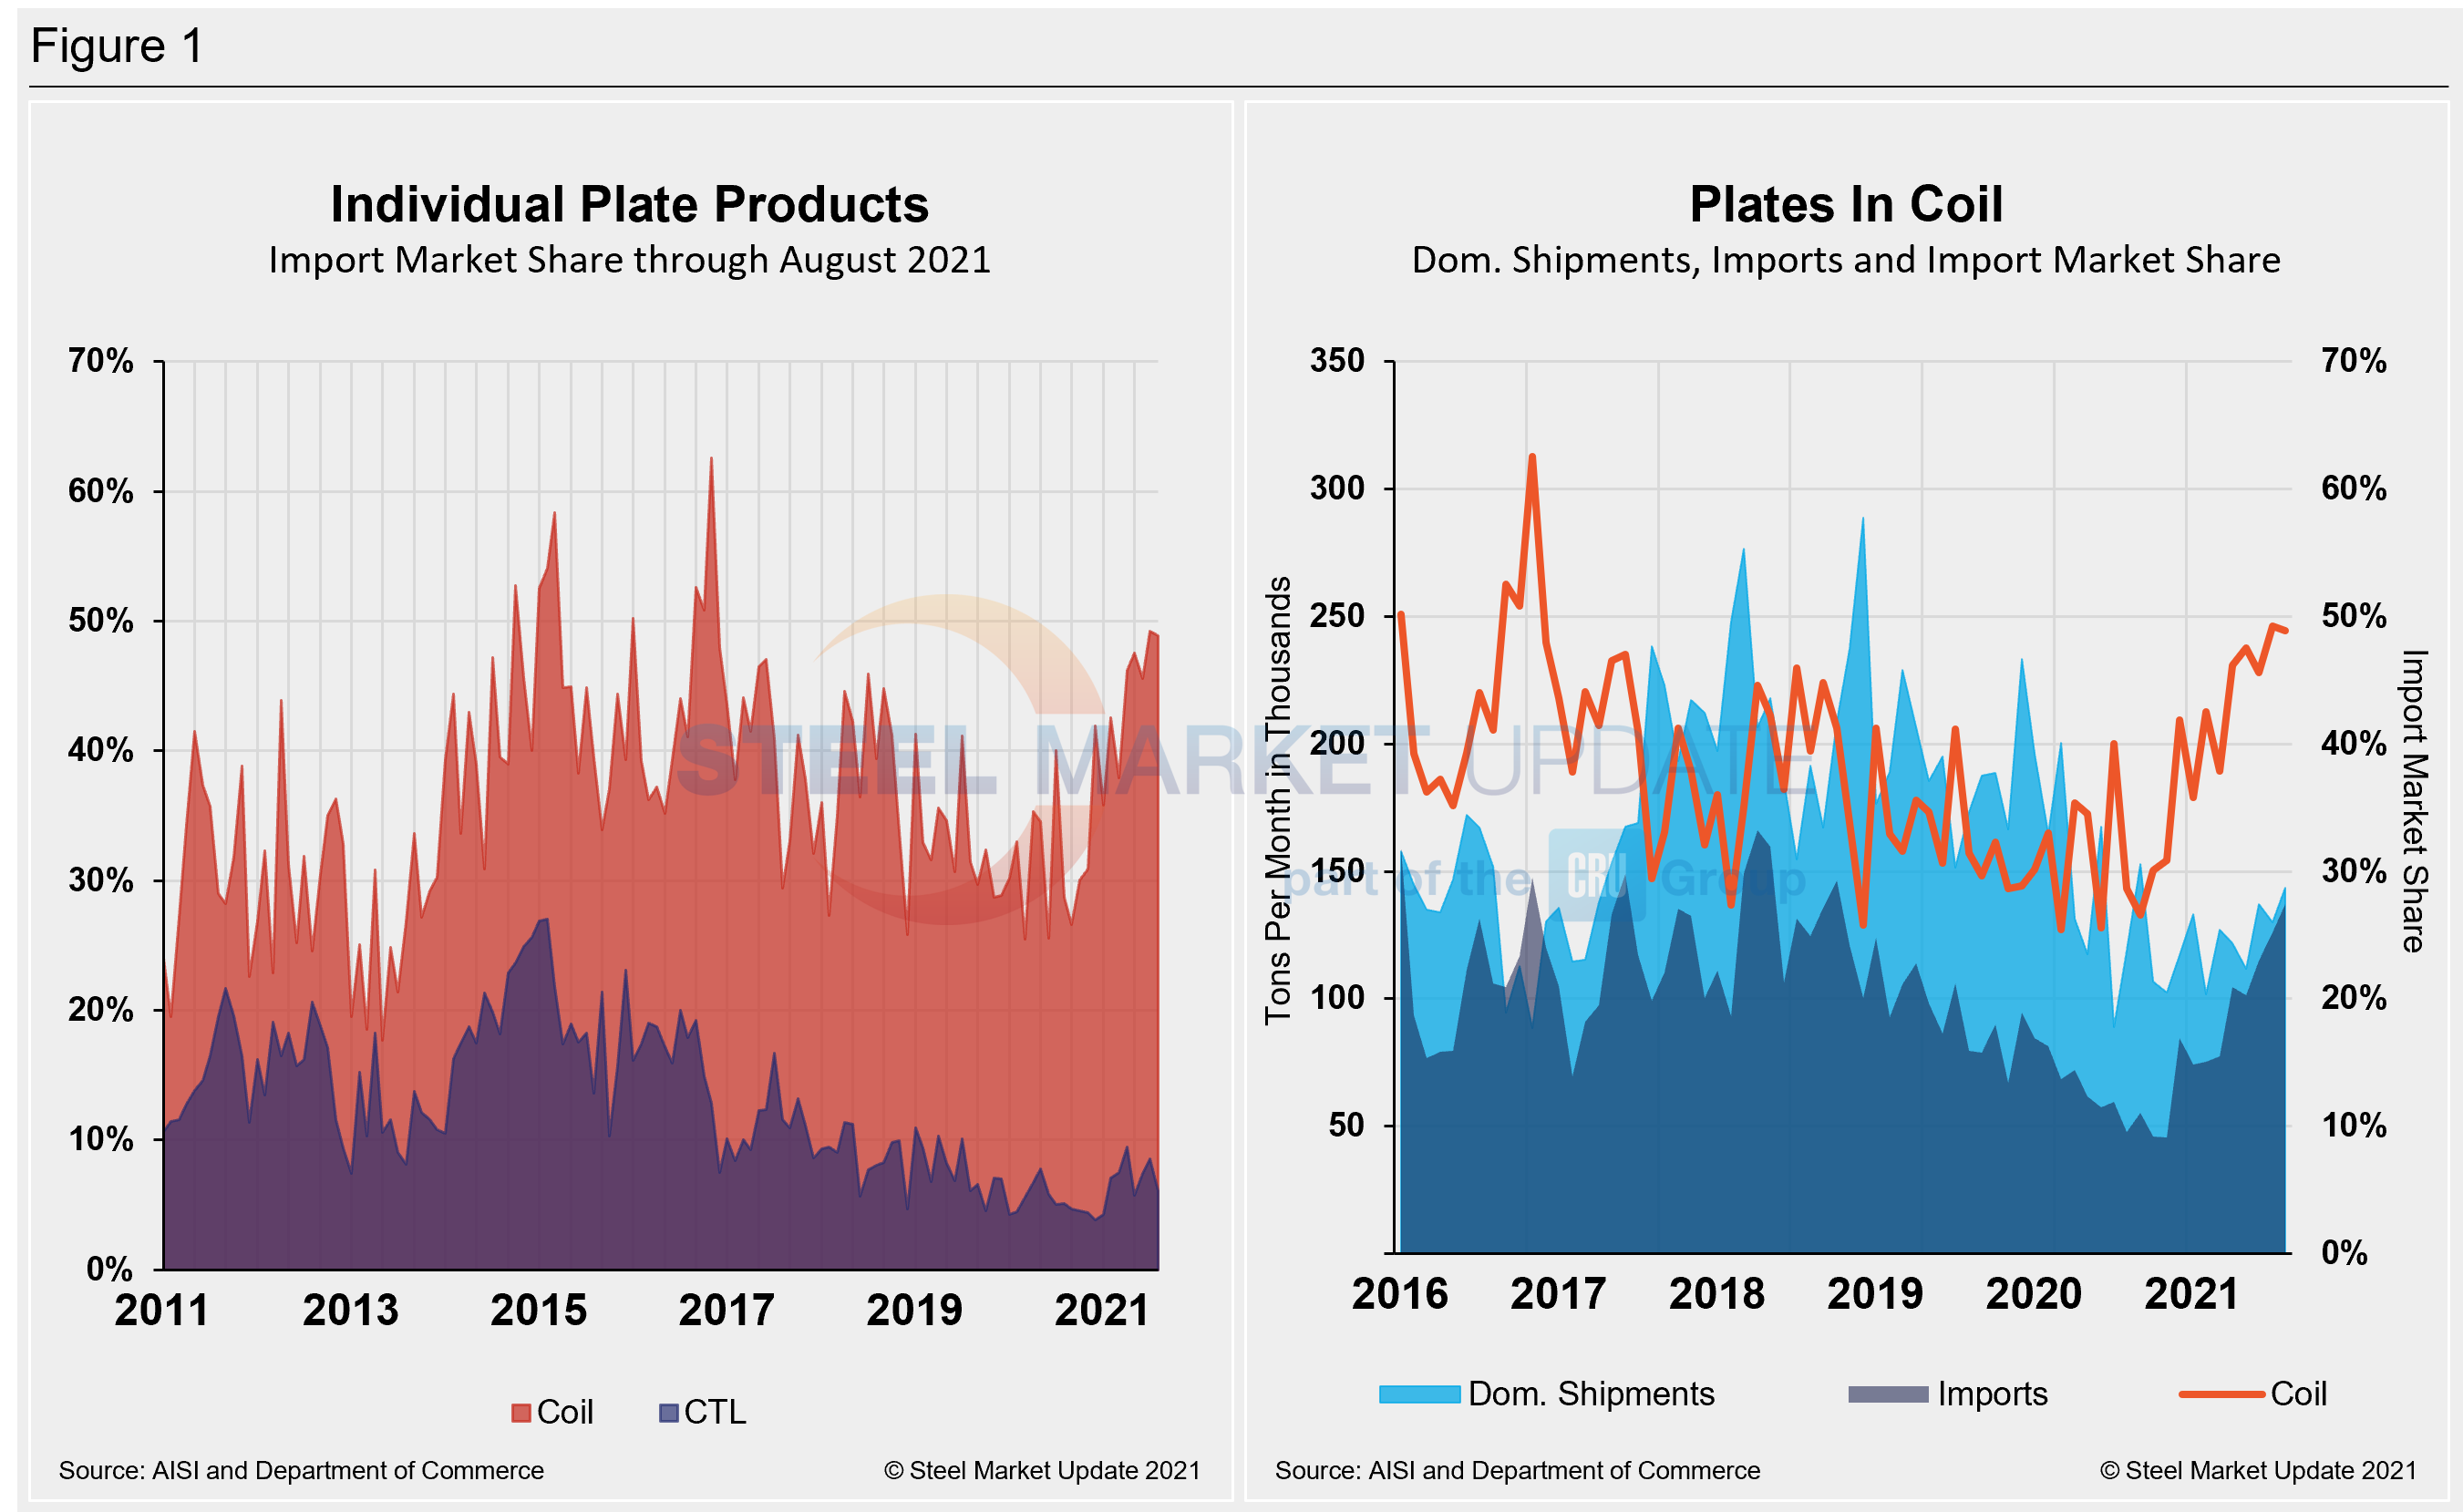
The import market share for plates in coil slipped in August to 48.9% despite an 8.8% increase in total imports. The rise in imports coincided with a 10.3% increase in domestic shipments of plates in coil, offsetting any rise in imports. Imports totaled 137,264 tons, the highest mark since October 2018.
The table below displays total supply to the market in three months and 12 months through August 2021 for sheet and plate products and six subcategories. Supply to the market is the total of domestic mill shipments plus imports. It shows imports on the same three- and 12-month basis and then calculates import market share for the two time periods for six products. Finally, it subtracts the 12-month share from the three-month share and color codes the result green or red according to gains or losses. If the result of the subtraction is positive, it means that import share is increasing and the code is red.
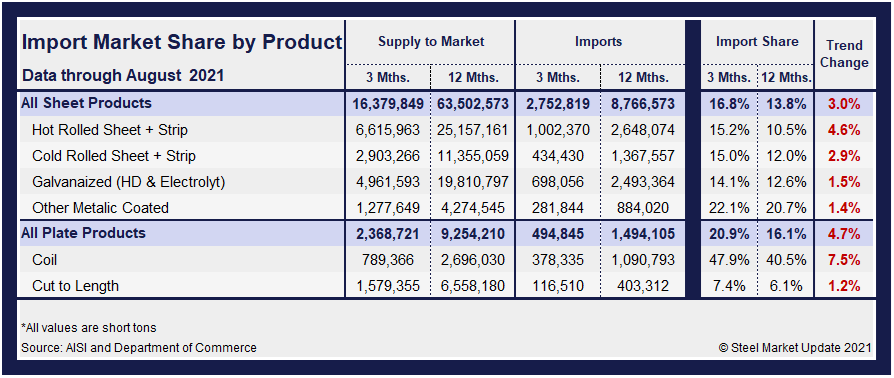
The big picture is that imports’ share of sheet and plate continues to rise month after month, leading to the big second-half jump in total imports many have predicted. This should continue to provide much-needed supply-side relief to buyers, eroding current domestic steel prices due to better supply/demand balance. Hot rolled and cold rolled sheet and strip have seen a trend shift together with plate products, illustrating how import competition is rising versus domestic products in three months compared to 12 months. Most notable of those subcategories are plates in coil (7.5%) and hot rolled coil (4.6%) in three months compared to 12 months through August 2021.
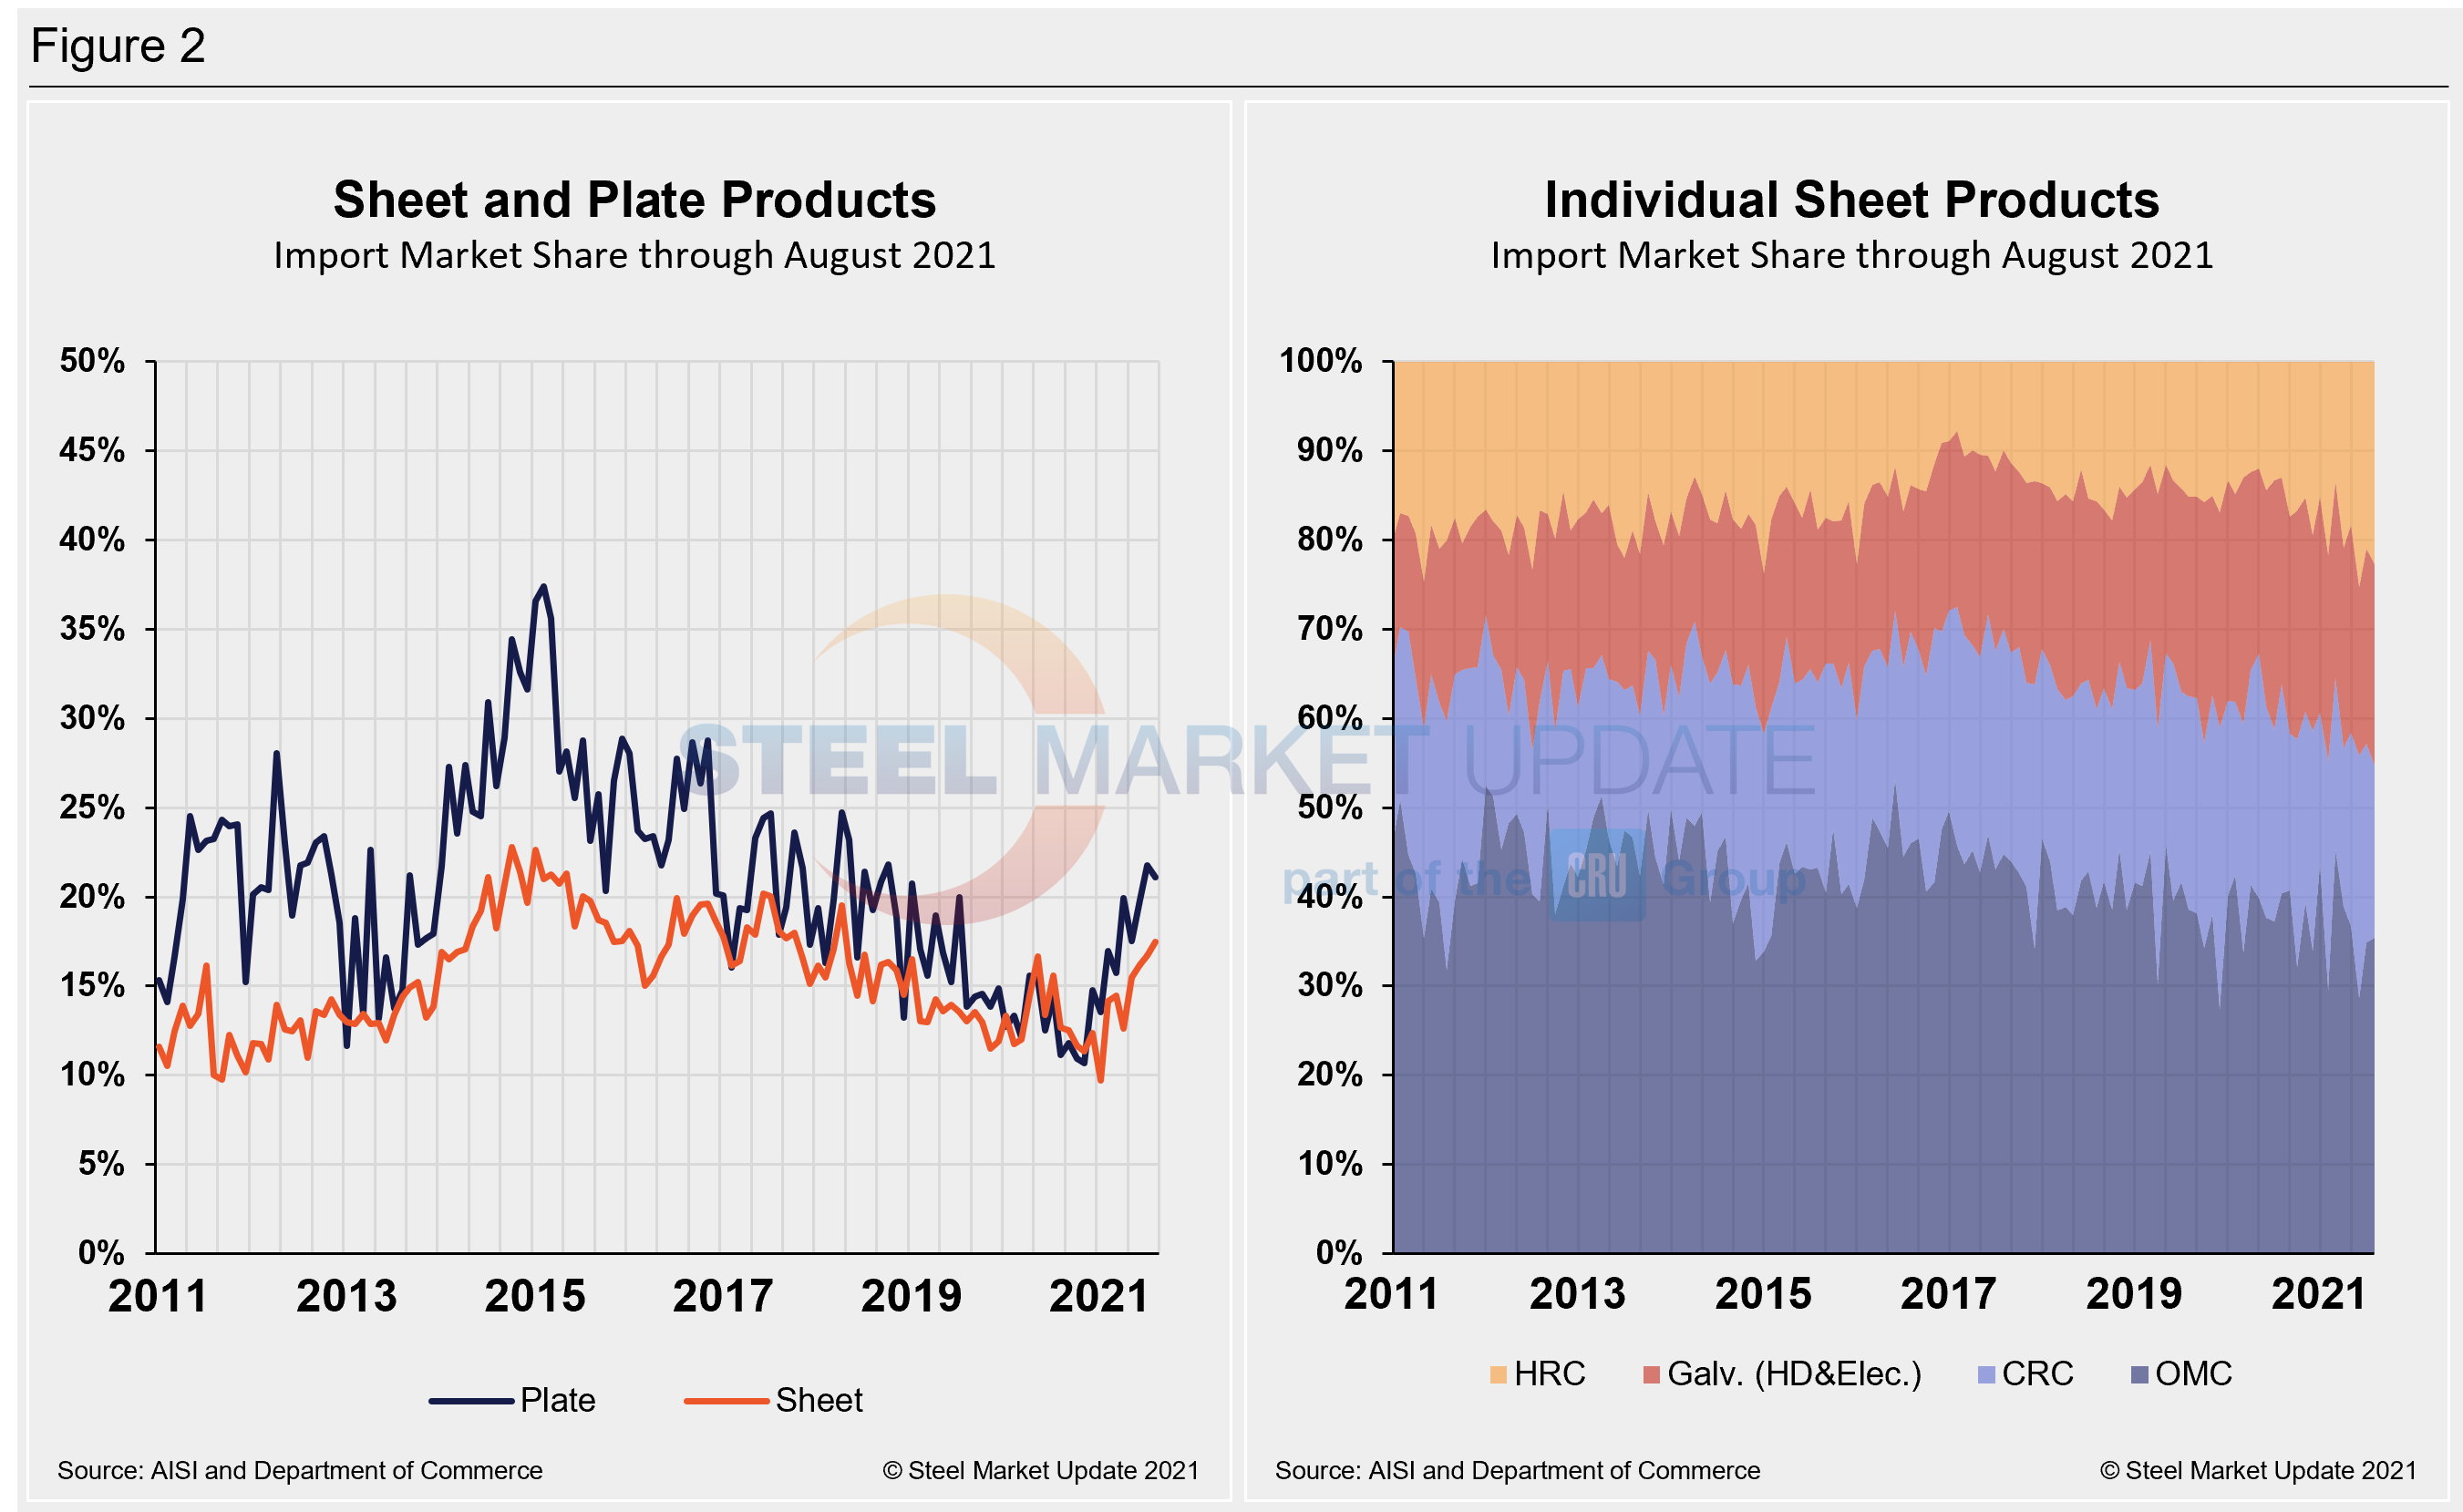
The import market share of individual plate products as well as a breakdown of the market share for plates in coil are displayed together in Figure 1. The historical import market share of plate and sheet products and the import market share of the four major sheet products are shown side-by-side in Figure 2. The import share of plate had been decreasing erratically over the past six years, but has trended up this year and is back to pre-pandemic levels, hovering just above 21.0%. Sheet product imports’ share had also trended down over the past several years, but has gained ground since the beginning of the year despite a steady rise in domestic shipments. The import market share of plates in coil is now nearly split with domestic shipments and holding strong since the beginning of the year.
By David Schollaert, David@SteelMarketUpdate.com


