

Market Data

October 15, 2021
Energy Market Analysis: Rising Prices on the Horizon?
Written by Brett Linton
The Energy Information Administration’s October Short-Term Energy Outlook (STEO) remains subject to heightened levels of uncertainty related to the ongoing recovery from the COVID-19 pandemic. That big caveat aside, the increase in economic activity continues to contribute to rising energy use. EIA expects average expenditures for heating fuels to increase significantly in the next several months from higher fuel costs and increased consumption due to a colder winter. Crude oil and natural gas prices are forecast to increase through the remainder of the year, with the October forecasts up 14-45% compared to those made in the previous STEO. Compared with last winter, the EIA forecasts propane expenditures will increase by 54%, heating oil by 43%, natural gas by 30%, and electricity by 6%.
Spot Prices
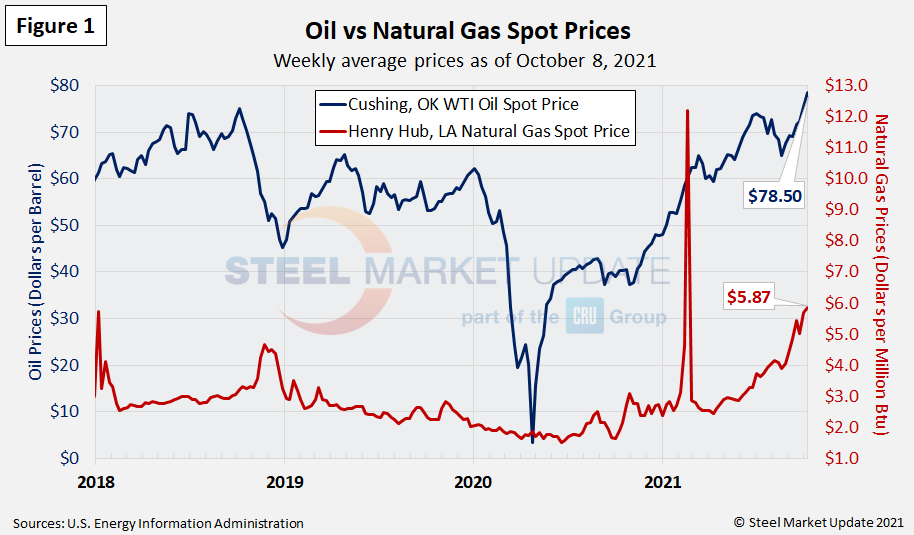
The spot market price for West Texas Intermediate (WTI) was at $78.50 per barrel as of Oct. 8, the highest weekly price since October 2014 when it reached $81.29. Natural gas prices at the Henry Hub in Oklahoma are also breaking records, at $5.87 per MMBTU (million British Thermal Units) as of Oct. 8. Excluding the February 2021 surge (when winter storms impacted much of the nation and the scarcity of natural gas and rising demand drove spot prices through the roof), this is the highest weekly natural gas spot price average since March 2014 when it was $6.24 per MMBTU. Figure 1 shows the weekly average spot prices for each product. The EIA now expects crude oil spot prices to average $81 per barrel during fourth-quarter 2021 (up $10 from their September forecast) and natural gas spot prices to average $5.80 per MMBtu (up $1.80 from the previous forecast).
Rig Counts
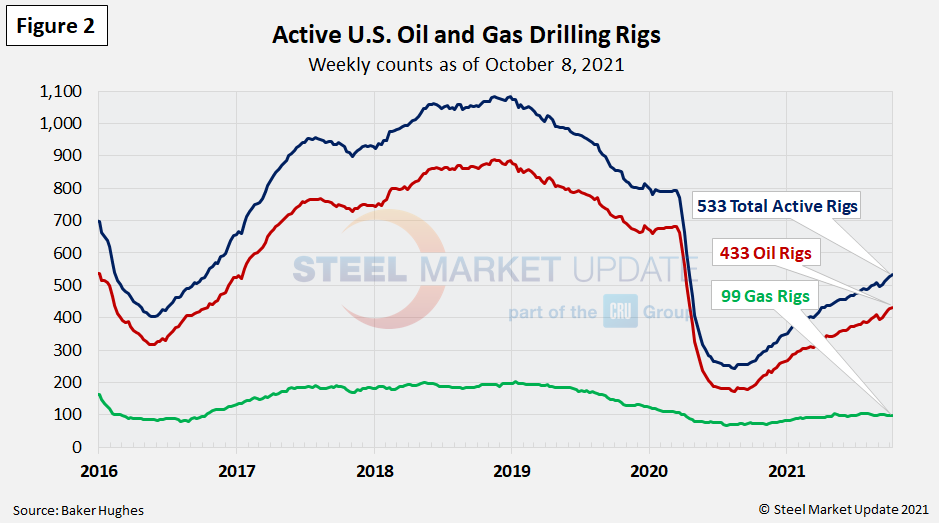
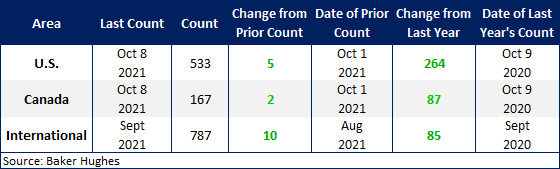
The number of active U.S. oil and gas drill rigs has been slowly recovering since the mid-2020 low. The count was 533 active drill rigs as of the end of last week. That total is comprised of 433 oil rigs and 99 gas rigs, according to the latest data from Baker Hughes (Figure 2). While up over recent months, active drill rigs are still down 33% from the 793 count in March 2020, just prior to the coronavirus shutdowns. EIA expects rig counts to increase into 2022 as tight oil production rises in the U.S.. The table below compares the current U.S., Canadian and international rig counts to historical levels.
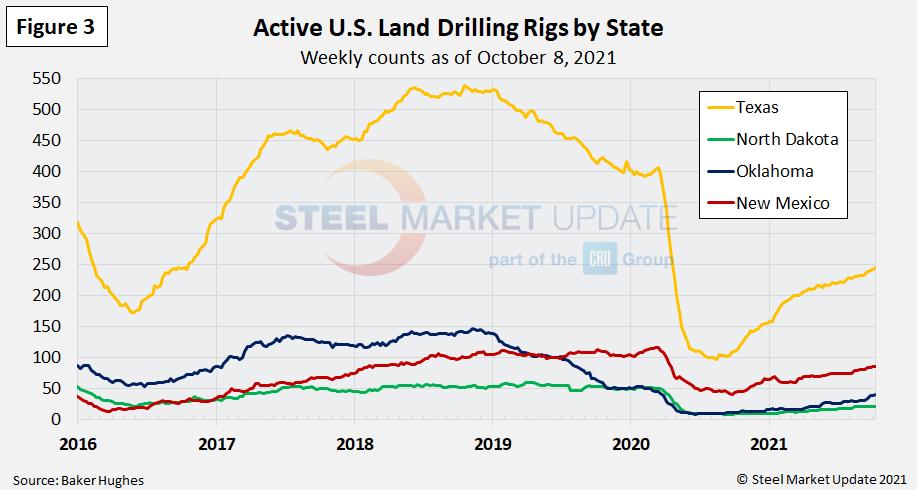
U.S. oil and gas production are heavily concentrated in Texas, Oklahoma, North Dakota and New Mexico. Production is still down as much as 57% compared to levels in March of last year. The most active state, Texas, now has 246 rigs in operation, the highest level seen since April 17, 2020. Recall that in just five months, Texas rigs had plummeted from 407 in March 2020 to 97 rigs in August 2020 (Figure 3).
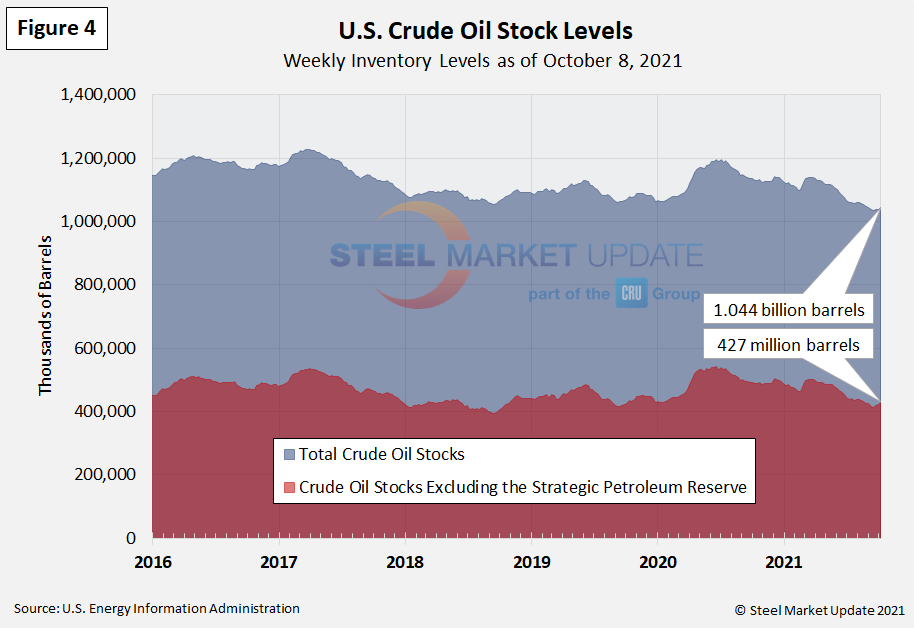
Stock Levels
U.S. total crude oil stocks in 2020 surged from mid-March through July, but they have steadily declined since then. The latest level is down yet again compared to the previous Energy Update; 1.044 billion barrels as of Oct. 8, down from 1.130 billion barrels at the same time last year (Figure 4).
Trends in energy prices and rig counts are a predictor of demand for oil country tubular goods (OCTG), line pipe and other steel products.
By Brett Linton, Brett@SteelMarketUpdate.com


