

Market Data

October 17, 2021
SMU Survey Deep Dive: Tide Shifts Toward Imports
Written by Michael Cowden
SMU has updated the survey data we collect to better detect shifts in buying patterns between domestic and foreign steel.
We know from Commerce Department figures that flat-rolled steel imports have been running at or above one million short tons a month since May – well above a monthly average of approximately 800,000 short tons over the last two years.
We hope that the data series below will allow us to catch such shifts in something closer to real time – in other words, ahead of the government numbers.
SMU tries to look at big questions – such as import buying patterns – from multiple angles. We’ve looked at this one from both service center and manufacturer perspectives. With that in mind, let’s dive into the data.
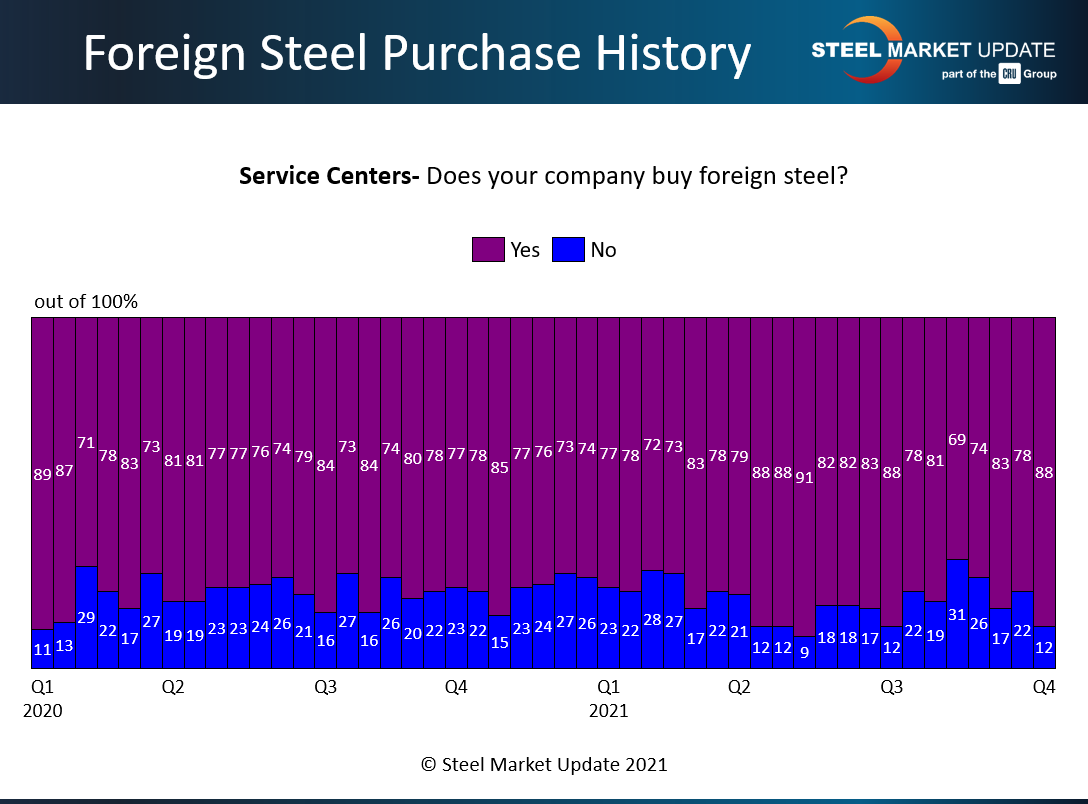
We know that about 75-80% of service center respondents to our surveys buy foreign steel:
 And we know that roughly a two-thirds of manufacturer respondents do as well:
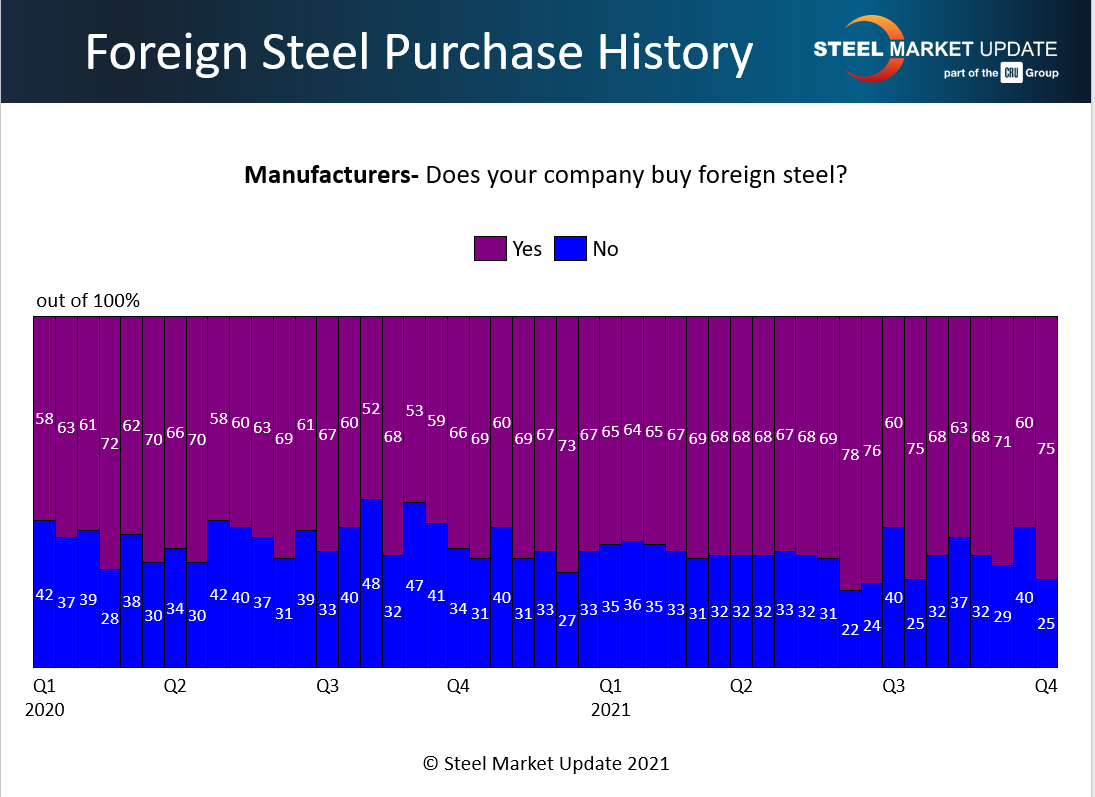
As you can see in the charts above, those figures might vary from week to week. But the general trend hasn’t changed much going back to the first quarter of 2020.
What has changed is the competitiveness of foreign steel prices compared to domestic steel prices. U.S. prices went from being the lowest prices in the world last summer to the highest in the world today.
The result: Both service center and manufacturer respondents report that imports are far more attractive now than they were in the first half of the year.
I’d read these next two charts as a cage match between green and purple. The green bars are imports being more competitive, and the purple bars are domestic prices being more competitive. Import prices (green) body slammed domestic steel prices (purple) at the outset of Q2, and domestic steel prices haven’t been able to fight their way back since.
Or by the numbers: On average, about 68% of service center respondents in the first and second quarters reported that import prices were competitive compared to U.S. prices. That number shot up to an average of 80% in the third quarter.
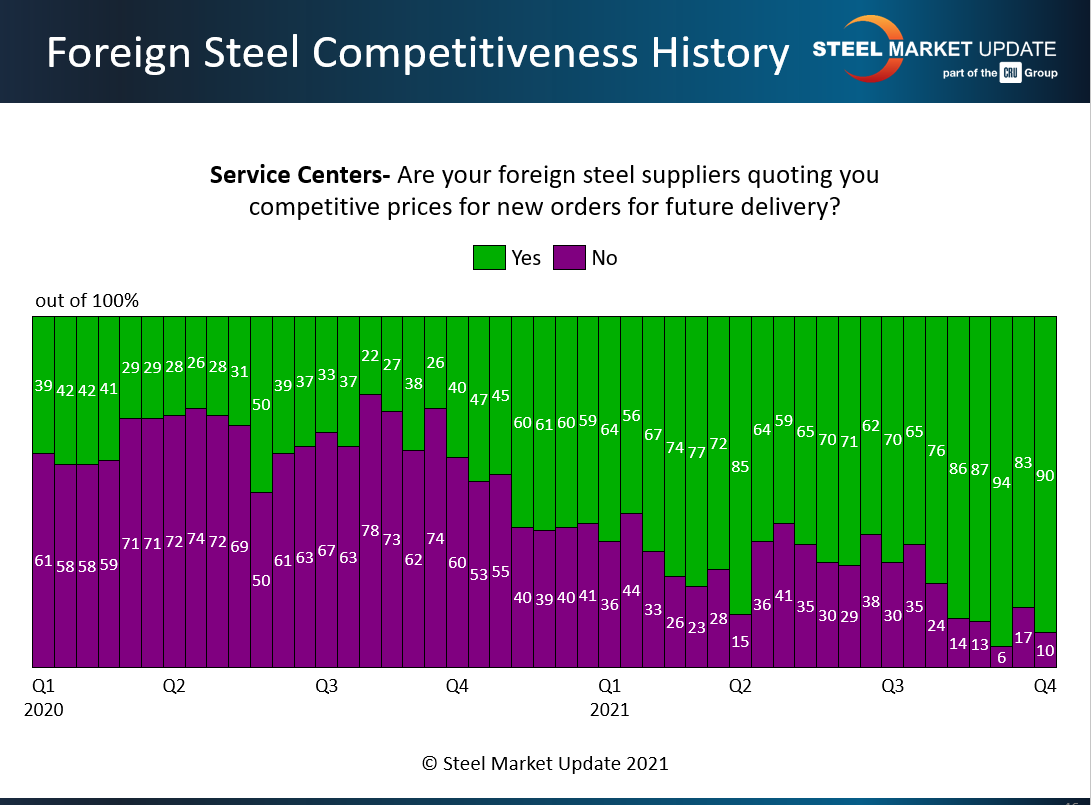
And while we only have one survey’s worth of data for the fourth quarter, the 90% figure we recorded recently is within the ~85-95% range we’ve seen since about middle of the third quarter. It marks a complete reversal from the summer of 2020, when only ~30% reported finding import offers attractive.
The same trend is true for manufacturer respondents. About 65-75% of manufacturer respondents reported that import prices were competitive in the first and second quarters of this year:
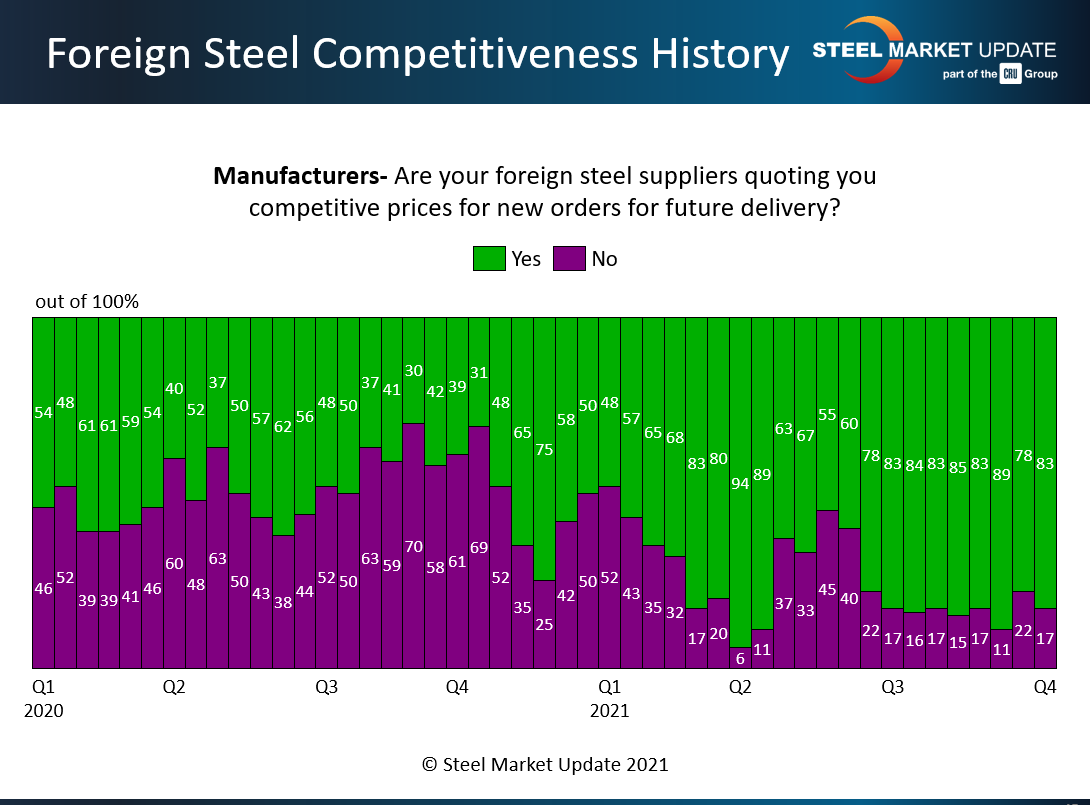
That number jumped to about 85% in the third quarter and is at about the same level at the outset of the fourth quarter.
Have service centers and manufacturers been buying imports and taking advantage of lower-priced foreign steel? Or have worries about supply chain issues trumped concerns about high domestic prices? The answer, according to our survey data, is that lower foreign prices have won out over supply chain concerns.
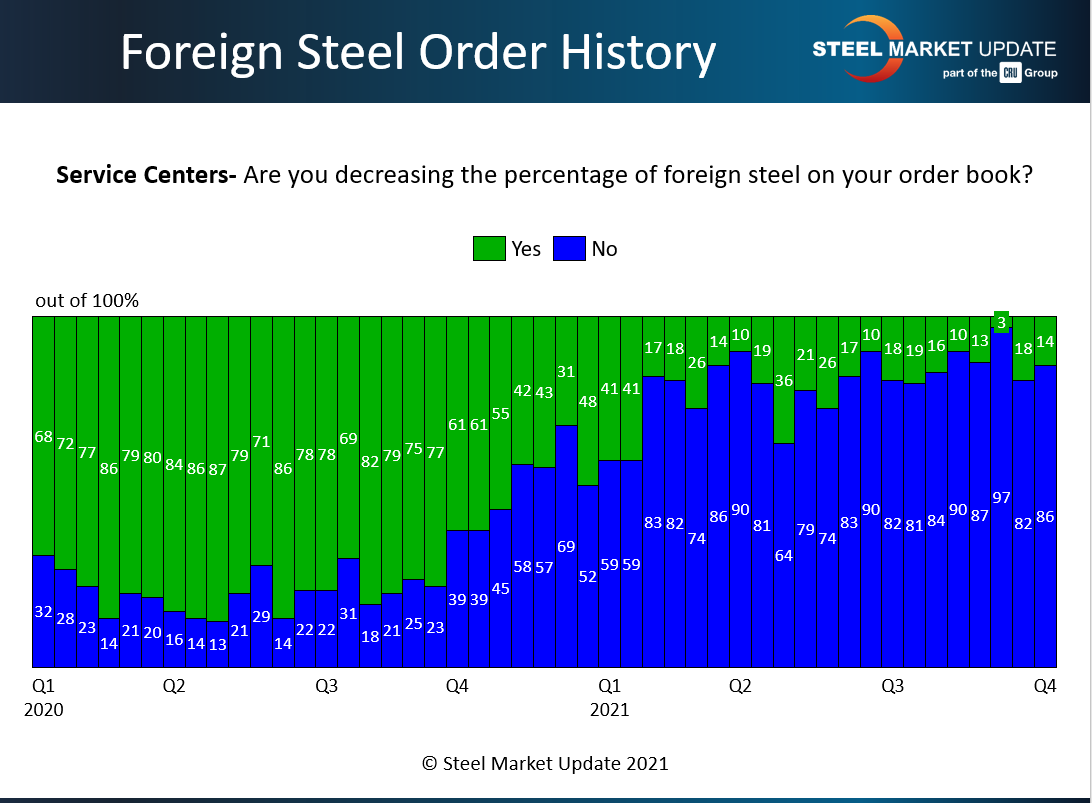
Service centers decreased their import buys as U.S. prices collapsed following the outset of the pandemic. And since the middle of the first quarter – as domestic prices skyrocketed upward – that trend has been reversed. And there was nothing gradual about it. Service centers were mostly decreasing (green) import buys. The tide shifted toward increasing import buys (blue) in the first quarter, and that trend has accelerated ever since.
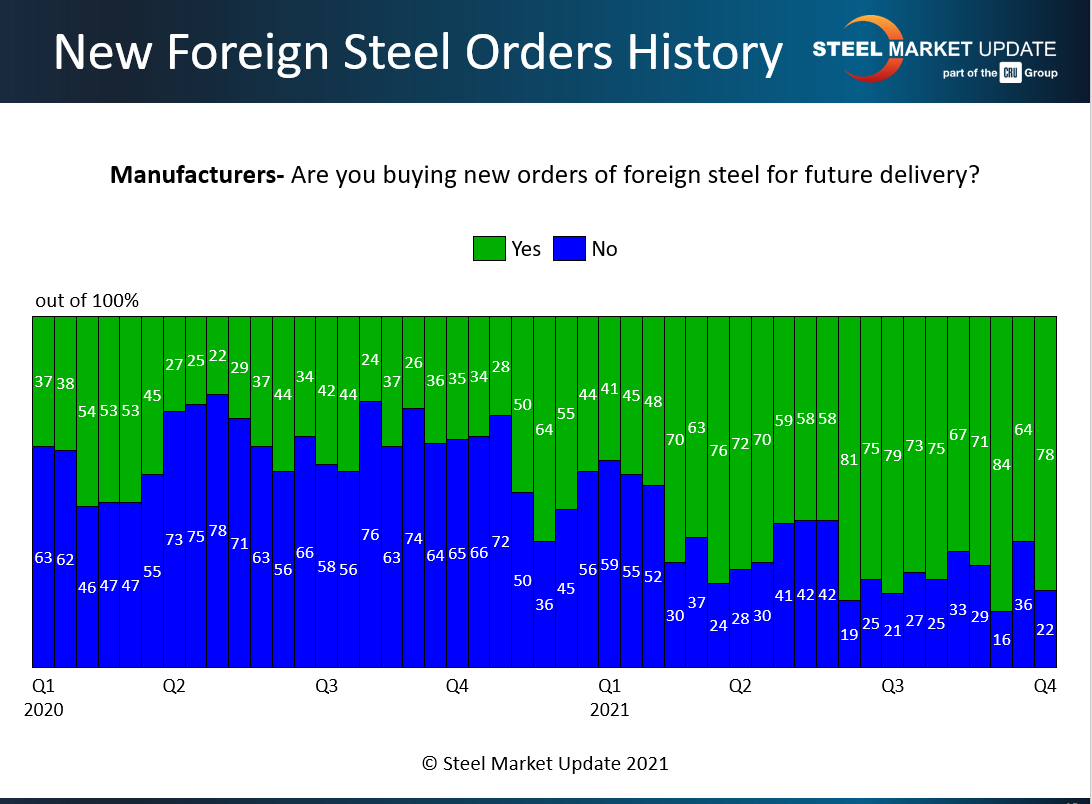
The script has also flipped when it comes to manufacturers, about three-quarters of whom are buying new import orders (green). That’s the opposite of a year ago, and you can see a clear inflection point in the middle of the second quarter.
And the data above is reflected in the comments we solicit from survery respondents. Here’s what they are saying about the big shift in steel sourcing away from domestic mills and toward imports:
“Dramatically increasing (import buys). It will be more than 50% of our purchases for the first time in several years.”
“We have good-quality, attractively priced imports coming in. Going very light with domestics for first half.”
“Imports coming in strong, well below domestic.”
“In addition to high pricing for spot tons, (U.S.) mills are also charging full freight and extras, roughly an additional $80/ton for us.”
“Buying more imports to offset unpredictable domestic mill pricing and availability.”
“Domestic (mills) have offered us about 75% of the contract tons we bought in 2021 for 2022. That is fine – import offers are much more attractive.”
“Foreign prices have been more competitive all year and will continue (to be) into the future.”
Our Survey
SMU surveys market participants on a regular basis not only about steel prices, lead times and sentiment – but also about trends on important topics such as demand, service center resale prices and imports.
Don’t just read the data, be a part of it. Your feedback is key to making sure our data reflects the market as it is in real time, not as it is forecast to be. To become a data provider, please contact SMU’s Brett Linton at Brett@SteelMarketUpdate.com.
Also, if you were a Premium member, you would have had these charts and the rest of our survey data delivered to your (virtual) doorstep on Friday – as soon as it was available. If you’d like to upgrade from Executive to Premium, please contact Paige Mayhair at Paige@SteelMarketUpdate.com.
By Michael Cowden, Michael@SteelMarketUpdate.com


