

Market Data

October 19, 2021
SMU Key Market Indicators Show Some Softening
Written by David Schollaert
Monthly Key Market Indicators, as analysed by Steel Market Update, softened again in the past month. A typical summer slowdown followed by a surge in COVID variant cases, compounded by a lackluster job market, reflects an uneasy economic landscape. Consumer confidence has dwindled, highlighted by decreases in key indicators across the marketplace.
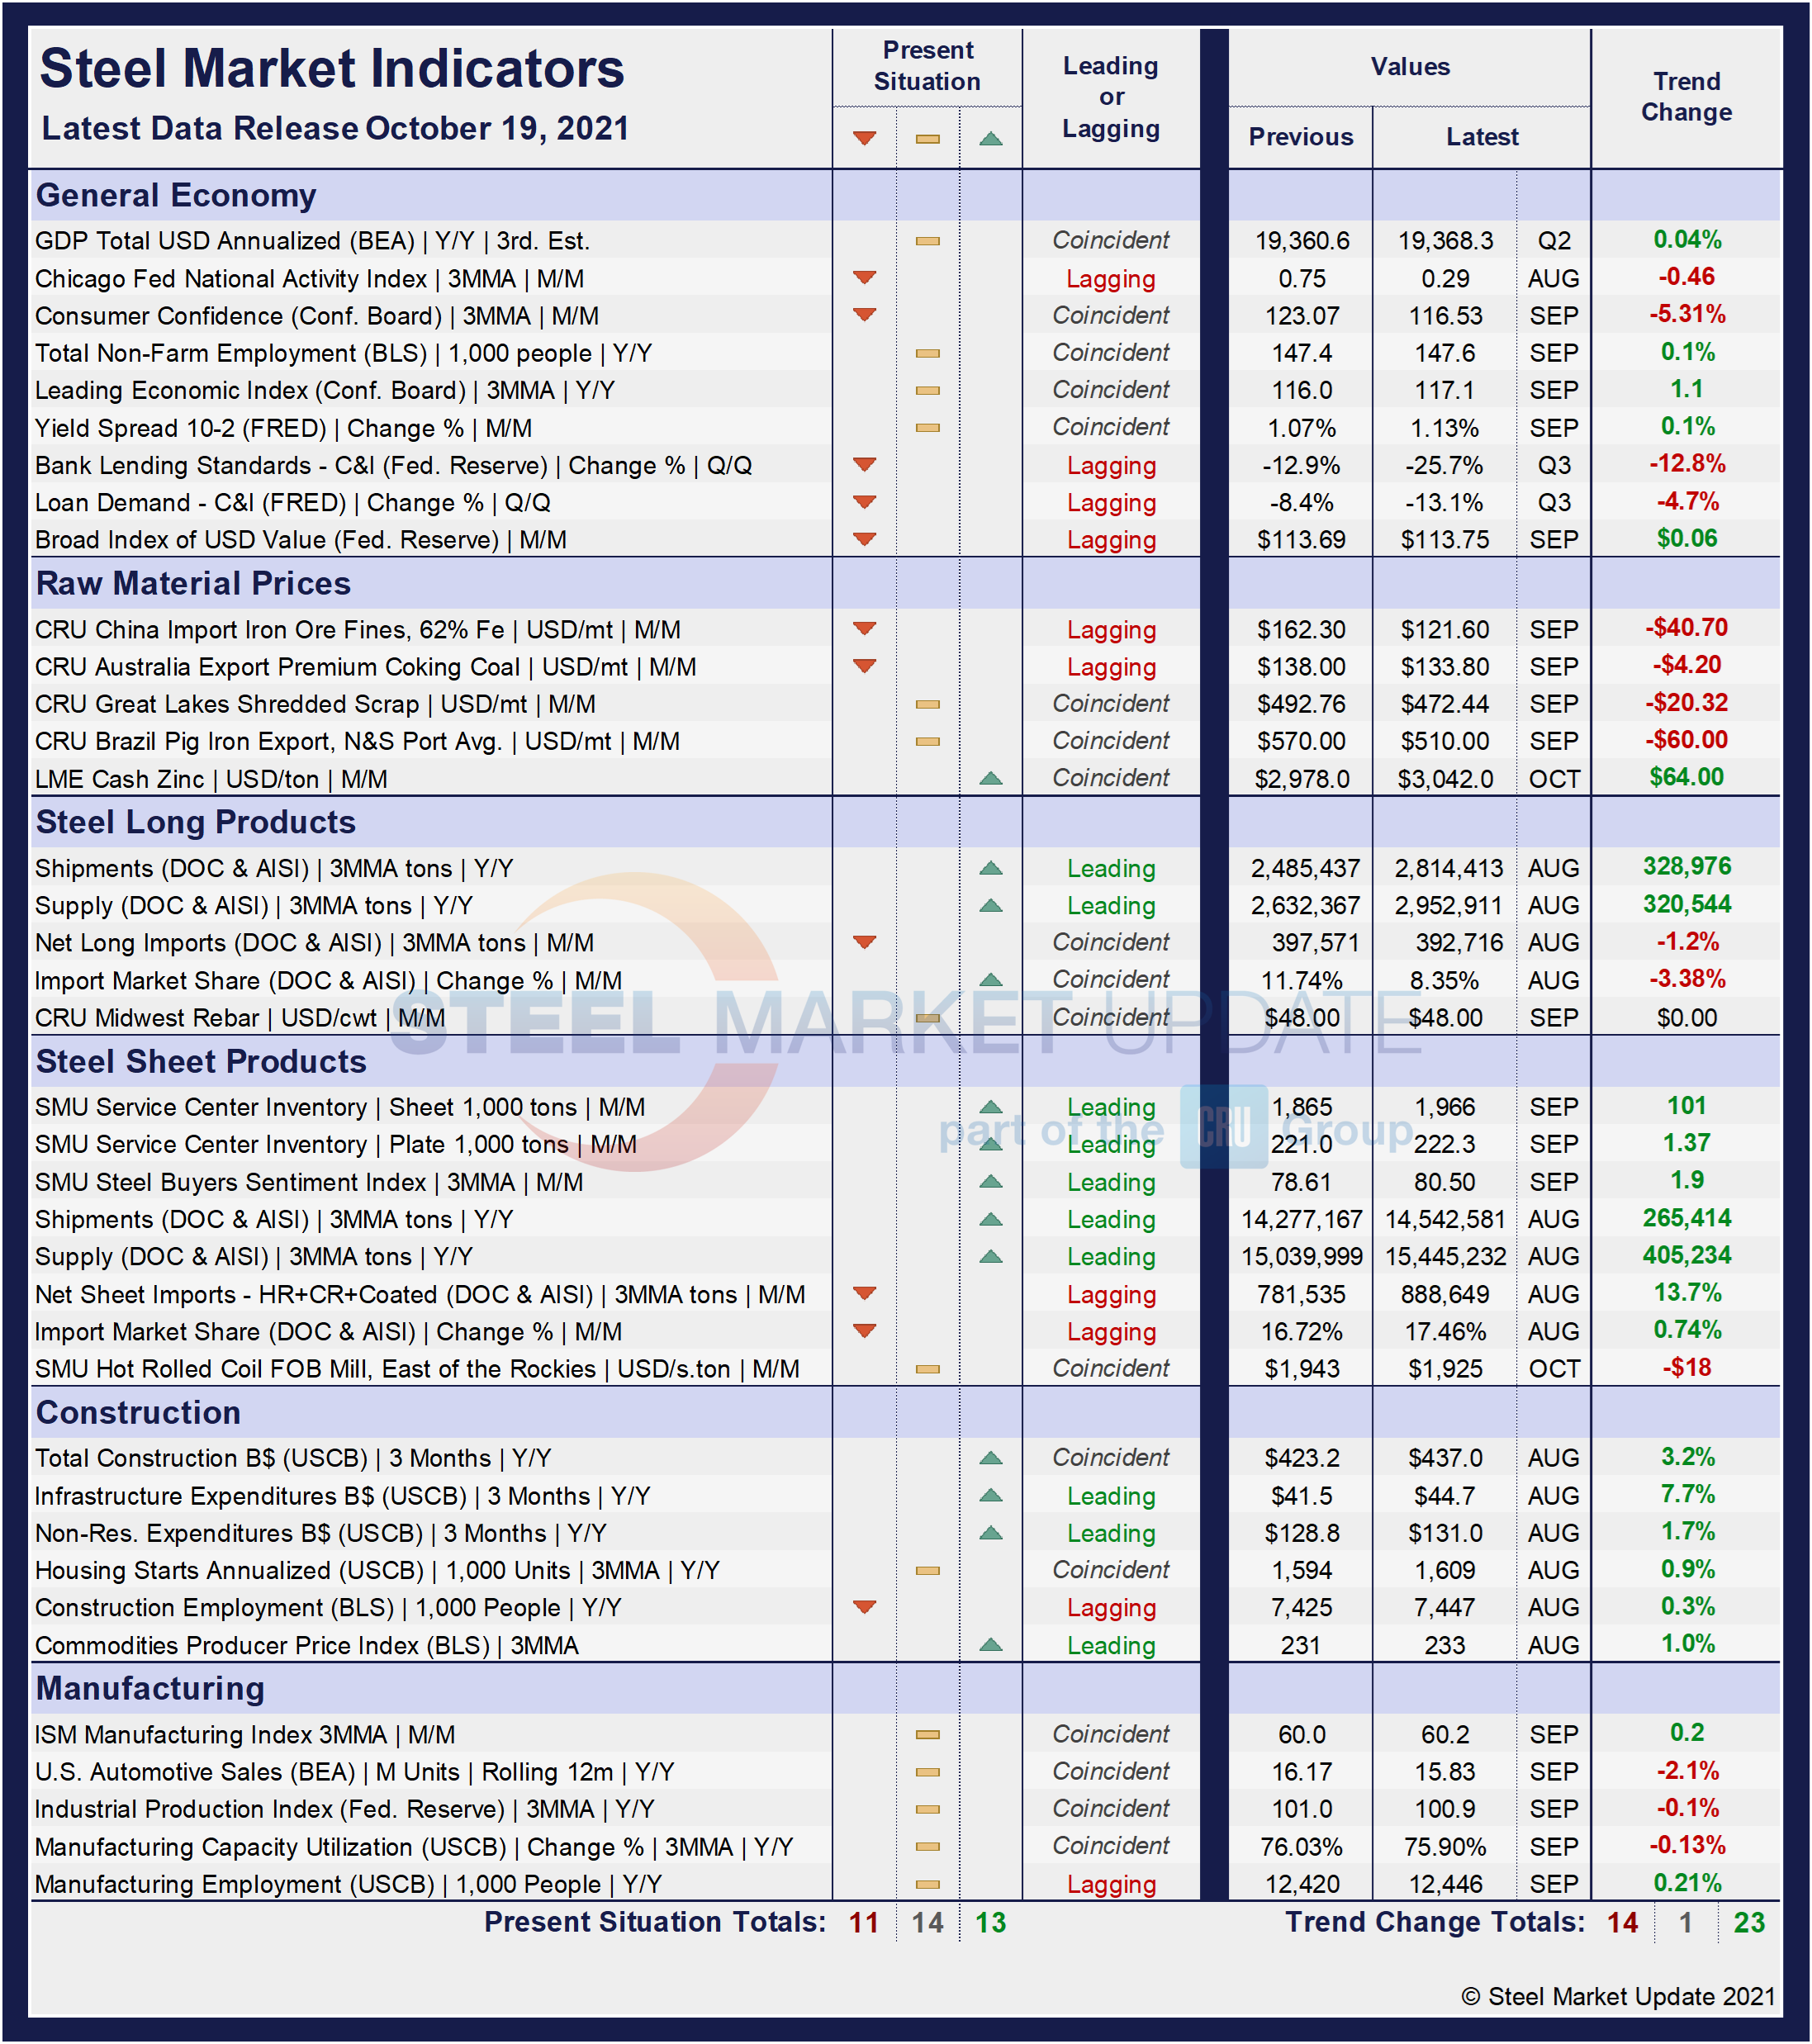
SMU’s Key Market Indicators include a host of data on the economy, raw materials, manufacturing, construction, and steel sheet and long products, offering a snapshot of current sentiment and the near-term expected trajectory of the economy. Markers for the Present Situation have contracted for a fourth straight month and Trends are following, slipping for a third consecutive month.
In the latest data, 11 of the 38 Present Situation indicators are negative, compared to the month prior when eight of the 38 indicators were negative. The neutral position was unchanged from the month prior with a reading of 14 through September, while the positive indicators lost momentum again, slipping from 16 to 13 over the same period.
Negative indicators trended down consecutively from February through May reaching as low as three. However, September’s indicator now stands at 11, the highest measurement year-to-date, and in line with last year’s slow recovery out of the initial COVID-doldrums. At its worst, 18 of the 38 indicators shifted negative last year as the economy was gripped with pandemic-related disruptions. Even though current measures are far from the downturn seen more than 18 months ago, the improvements have decelerated and begun to shift downward.
SMU’s Present Situation and Trends analyses in the table below are based on the latest available data as of Oct. 19, 2021. Readers should regard the color codes in the “Present Situation” column as a visual summary of the current market condition. The “Trend” columns are also color coded to give a quick visual appreciation of the market’s direction. All data included in this table was released within the past month. The month or specific date to which the data refers is shown in the second column from the far right. Click to expand the table below.
Present Situation
SMU’s Present Situation indicators below show that the road to recovery was bumpy, but with a clear upward trajectory and response to the early pandemic-related blows. Since June, the markers have steadily increased, as the economy seems to lack traction. The Trend was up and gaining ground until June, but has since eroded repeatedly. Positive indicators rose from 11 to 20 through June, but are now at 13, and could trend down further in the near-term. Negative indicators had grown twice over the past three months but eased in August, only to rise again in September. The more telling trend is the growth in neutral indicators, presently holding at 14 after expanding by four points in August. The trend suggests the market’s direction is unclear.
Supply shortages, particularly in the auto and construction sectors, rising producer prices, an underperforming employment sector, rising interest rates, a pesky pandemic that seems unwilling to retreat, and other factors are playing an active role in the marketplace’s hesitation. The Labor Department said that producer inflation accelerated in September as wholesale prices rose to a record 8.6% over 12 months, while the consumer price index increased 0.5% in September.
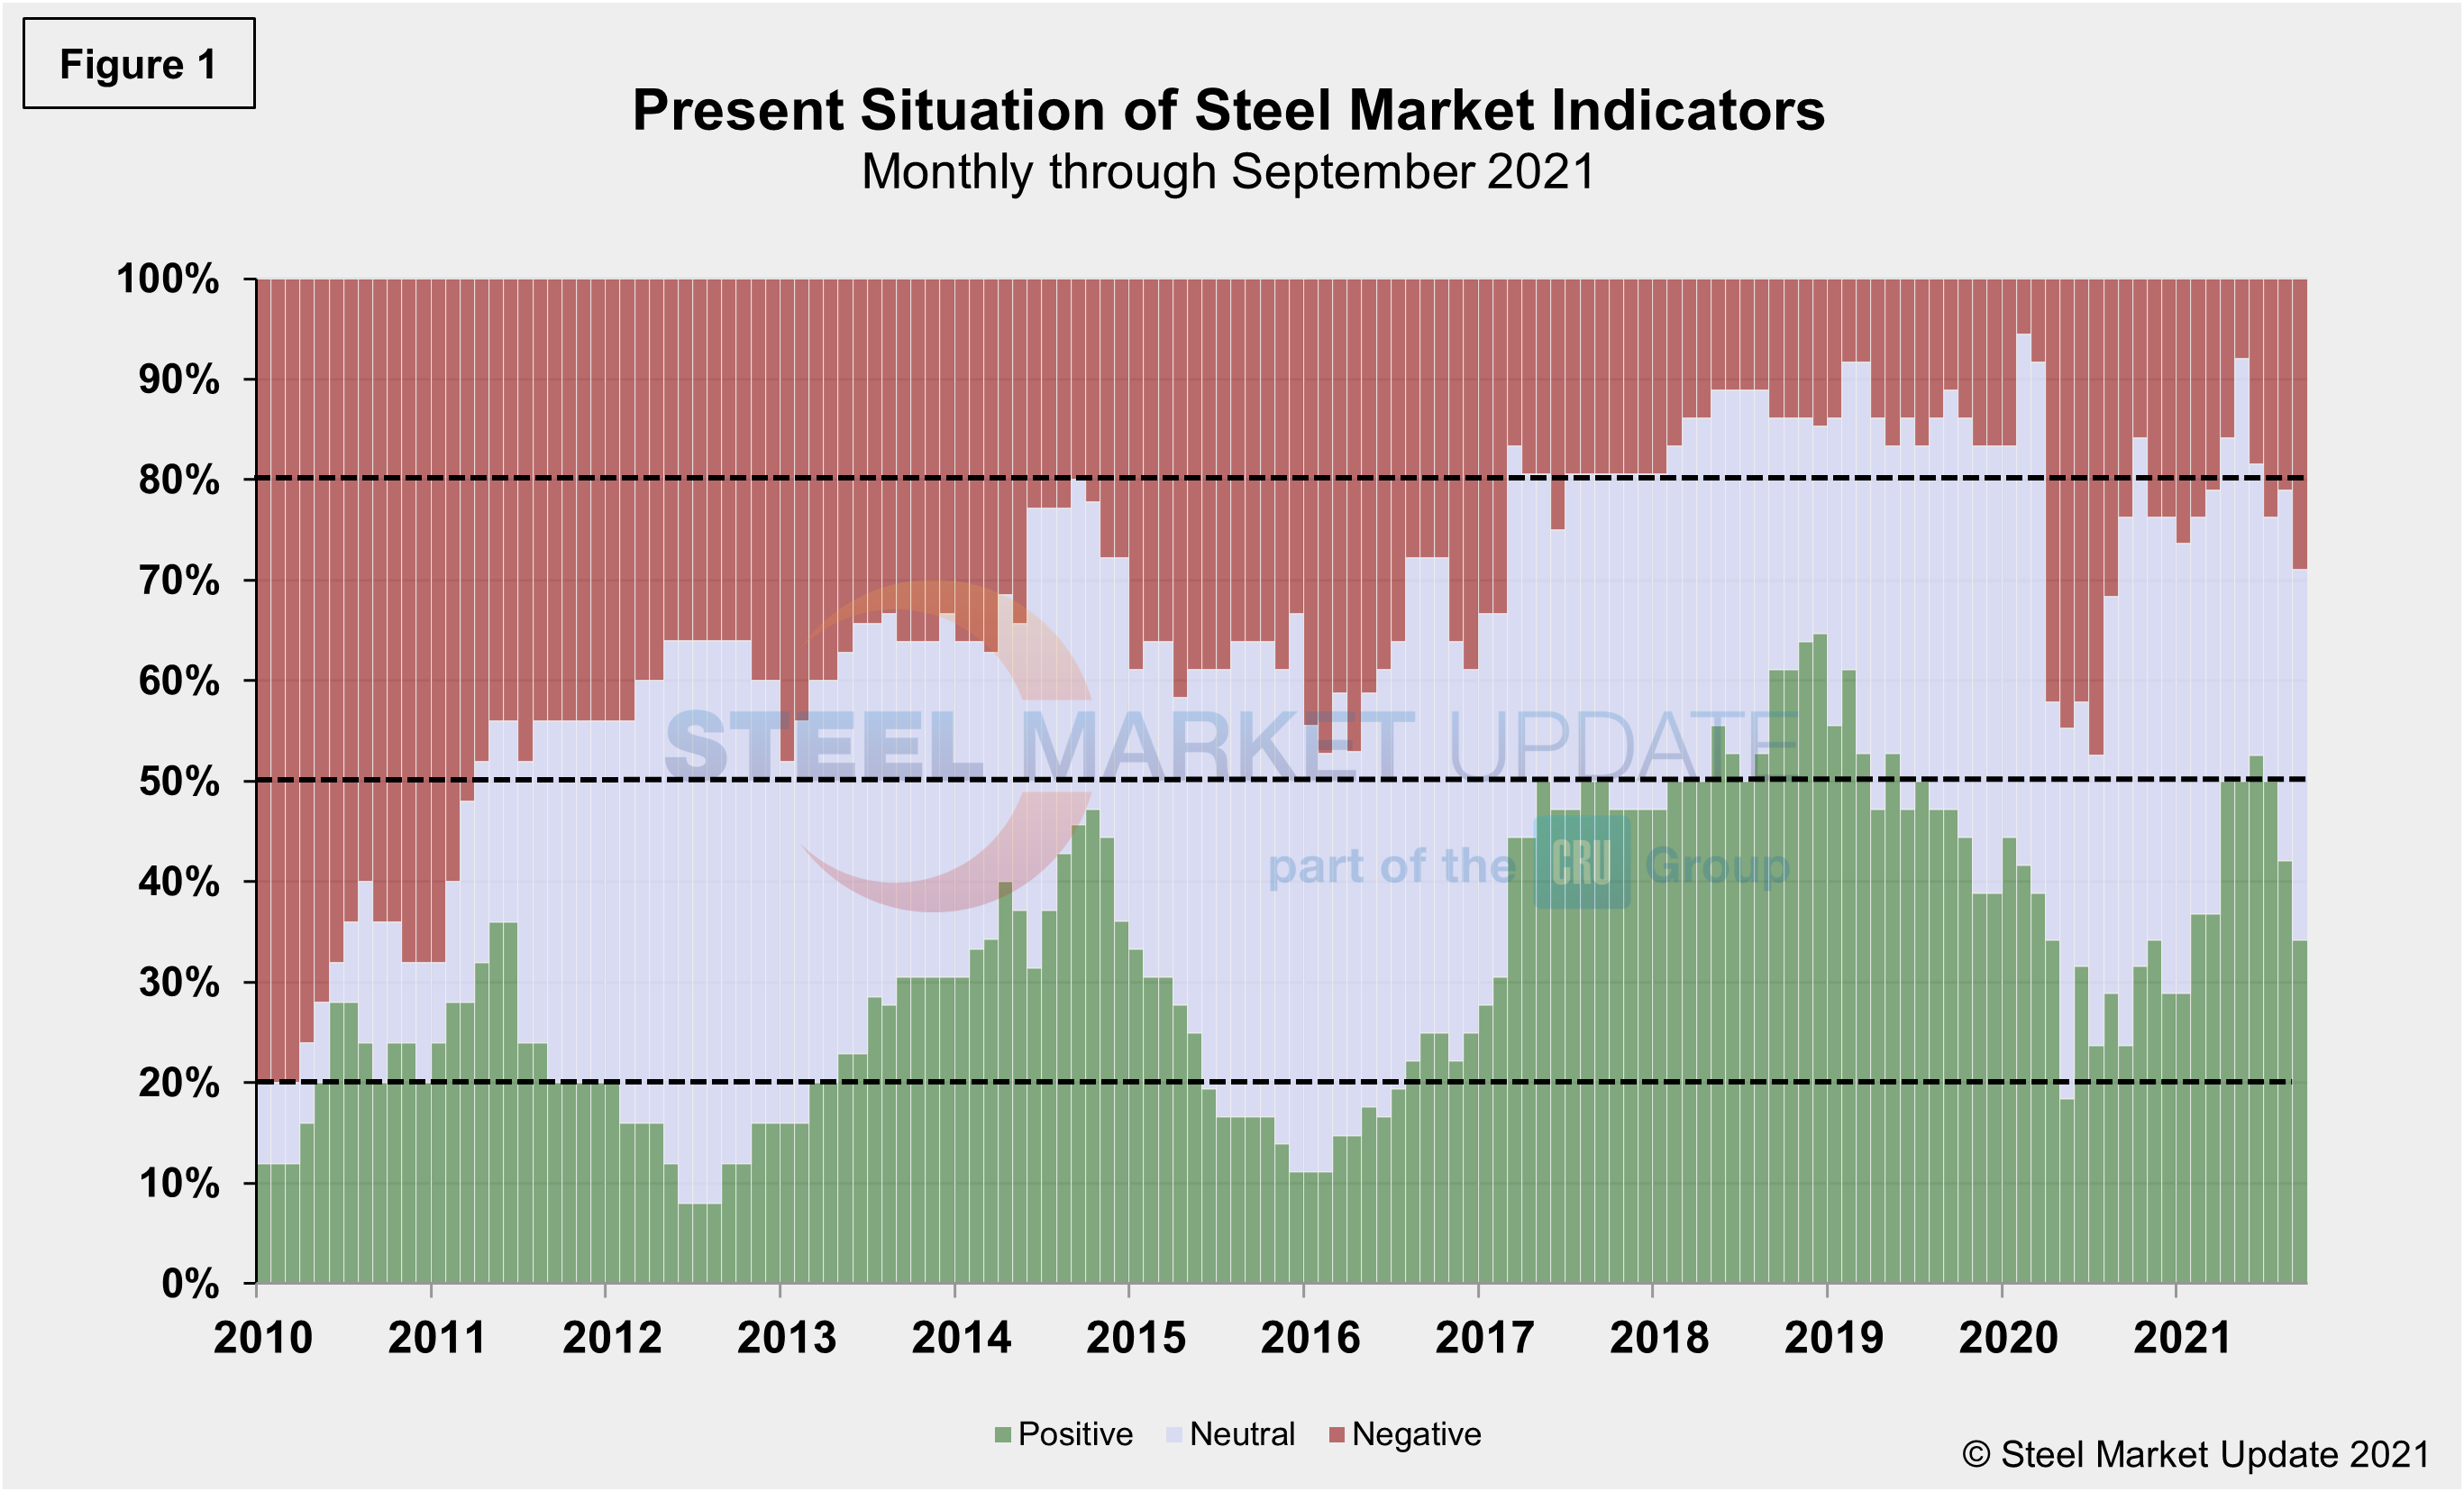
Present results have become more apprehensive compared to last month’s data due to the rise in the negative totals and the continued slip in the positive figure. Presently, nearly 37.0% of the marketplace is neutral or unclear, a 10-percentage point increase from it’s lowest mark in July, but unchanged month on month. Through September, 34.2% of the marketplace is positive, down from 42.1% the month prior, while 28.9% is negative, up from 21.1% in August. Presently, 71.1% of the population still sees the marketplace as promising, or neutral-to-positive, according to SMU’s assessment of key market indicators. Yet it represents a 7.8 percentage point decrease from one month ago.
Our monthly assessment of the Present Situation since January 2010 on a percentage basis is shown in Figure 1.
Trends
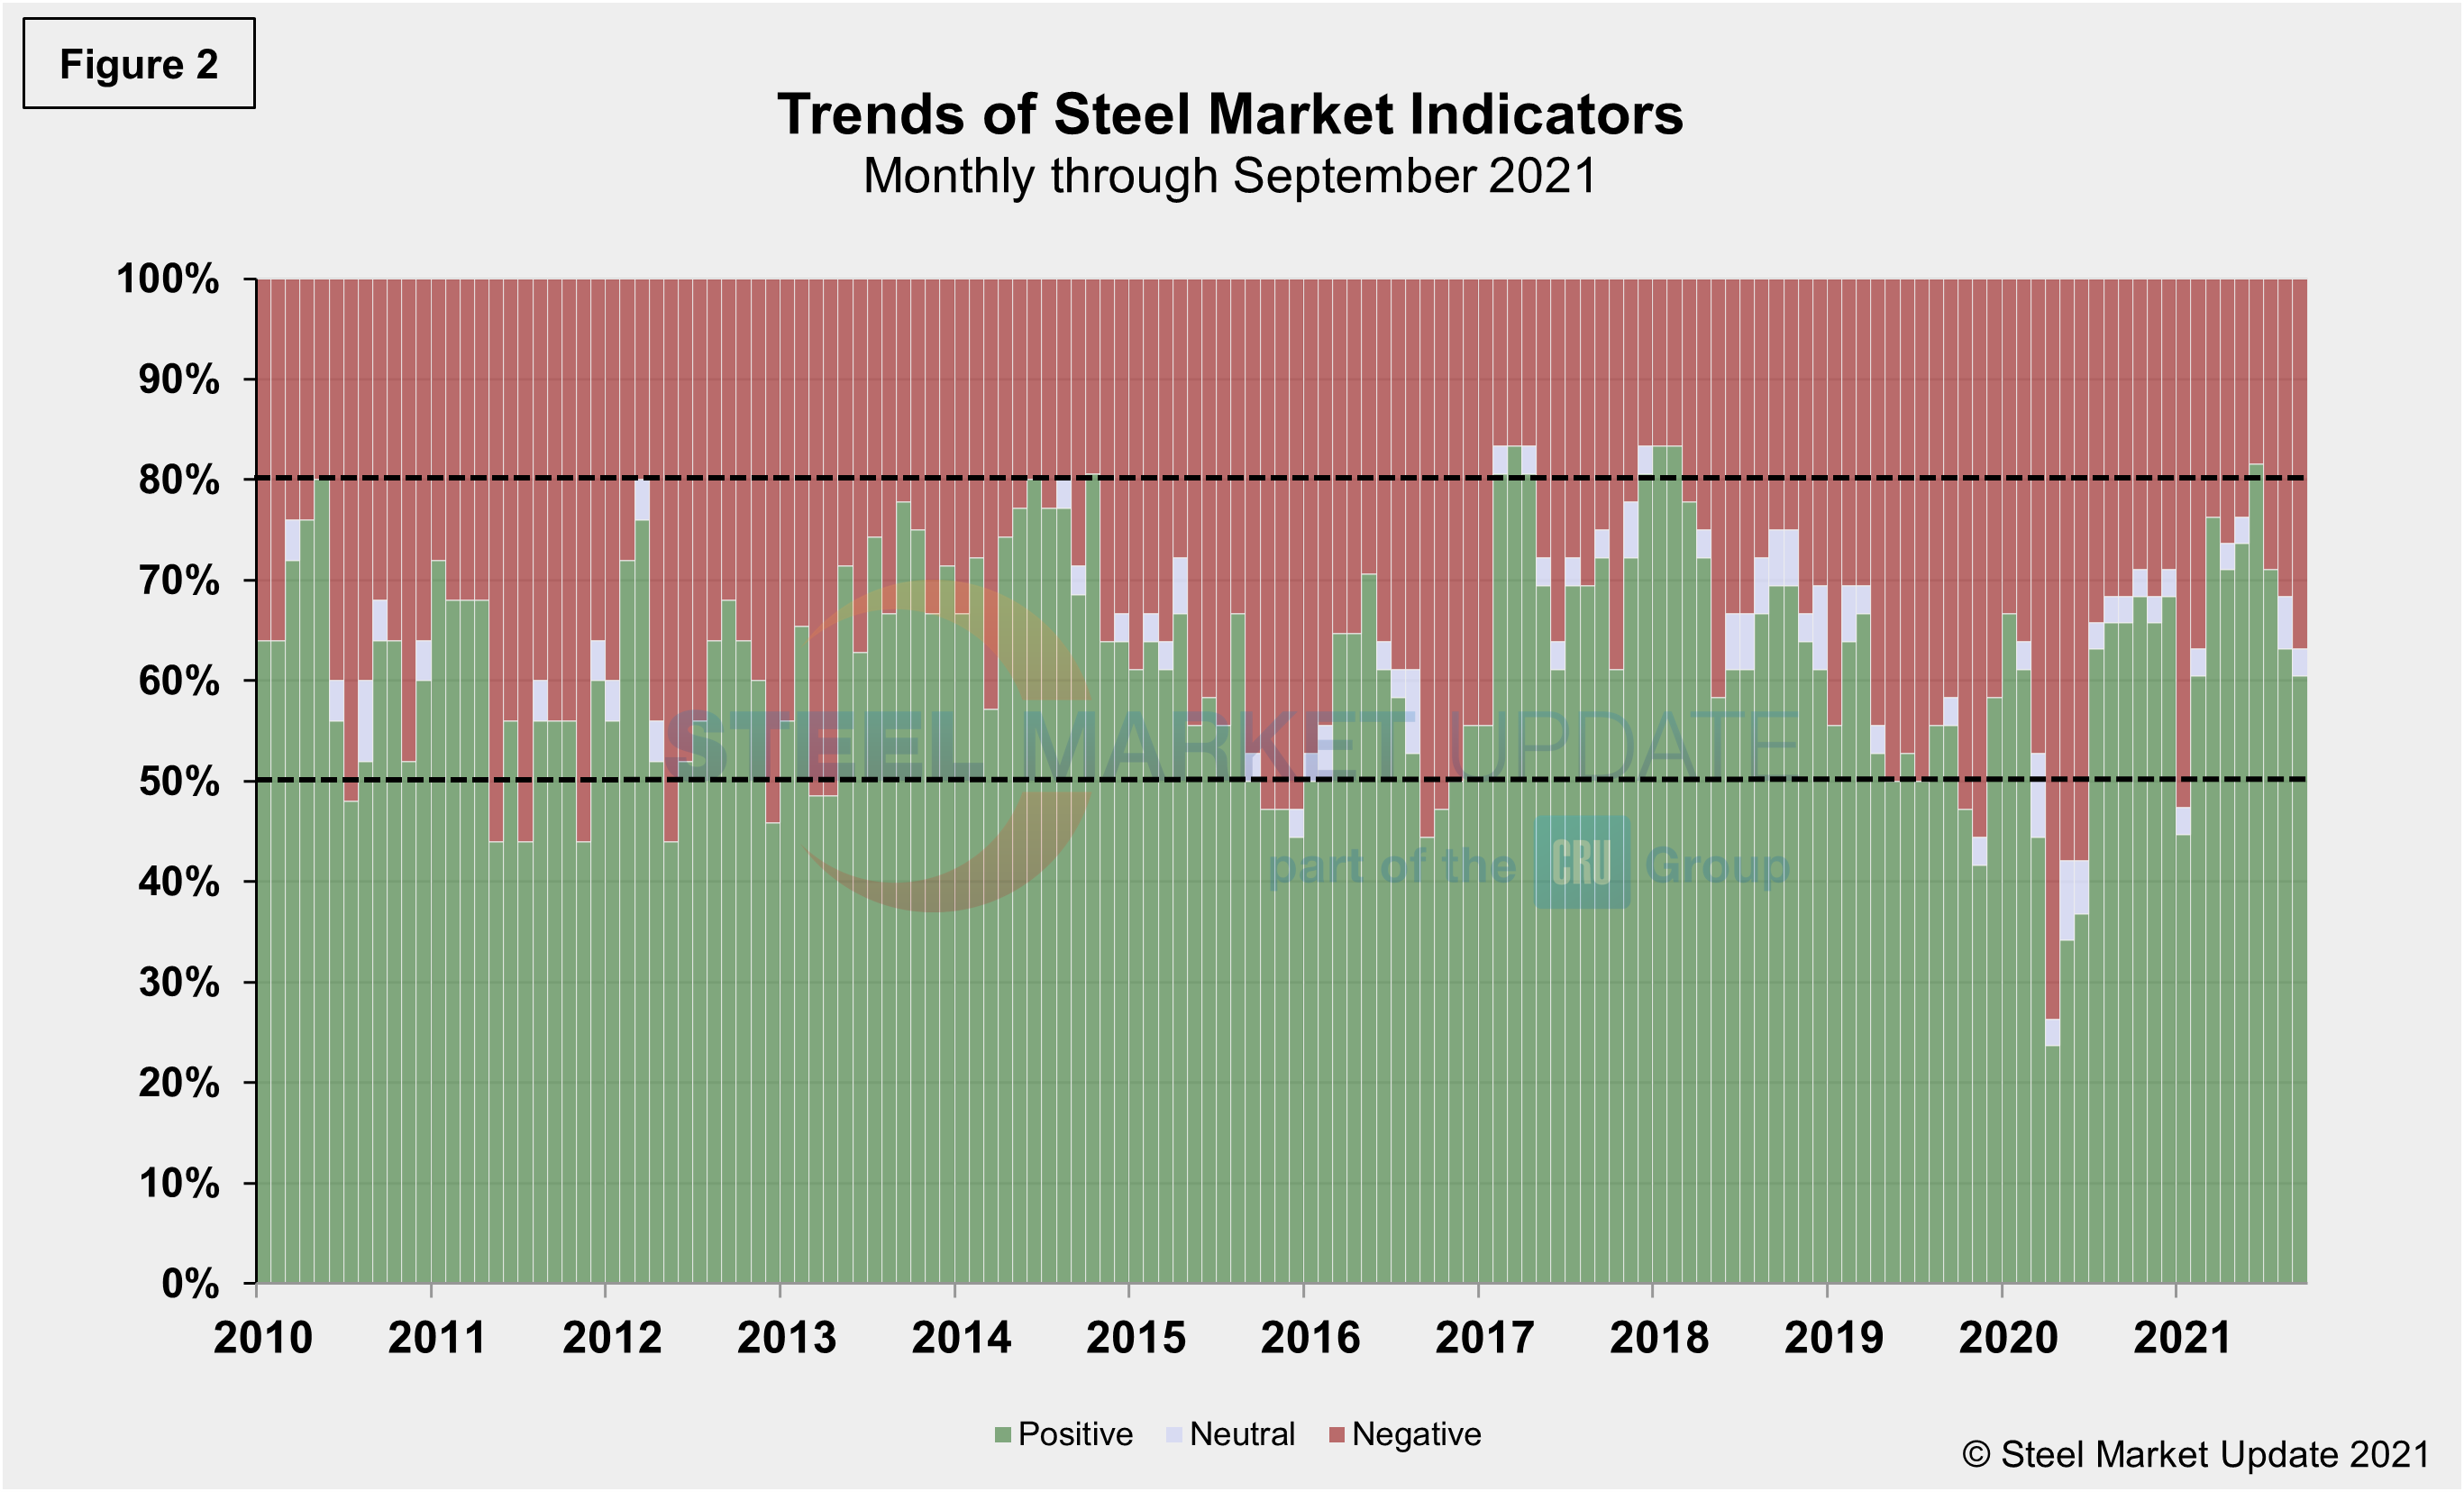
SMU’s Trends indicators saw movement similar to the Present Situation, however, most values in the Trends columns are three-month moving averages (3MMA) to smooth erratic monthly data. Nevertheless, there was a repeated shift negative in the latest data. Note that in many cases this is not September or October data, but data that was released in September and/or October for previous months. Compared to month-ago data, the negative trend rose to 36.8%, compared to 31.6% and up more than 18 percentage points from its lowest mark in June. The neutral trend slipped to 2.6% from 5.3% the month prior. The positive trend lost ground from 63.2% to 60.5%, and down nearly 22 percentage points in three months. These results, initially considered an effect from a summer slowdown, now may be an indication of a marketplace lacking direction and trying to find its footing. Figure 2 shows the recent movement of the trends and historical movement for comparison.
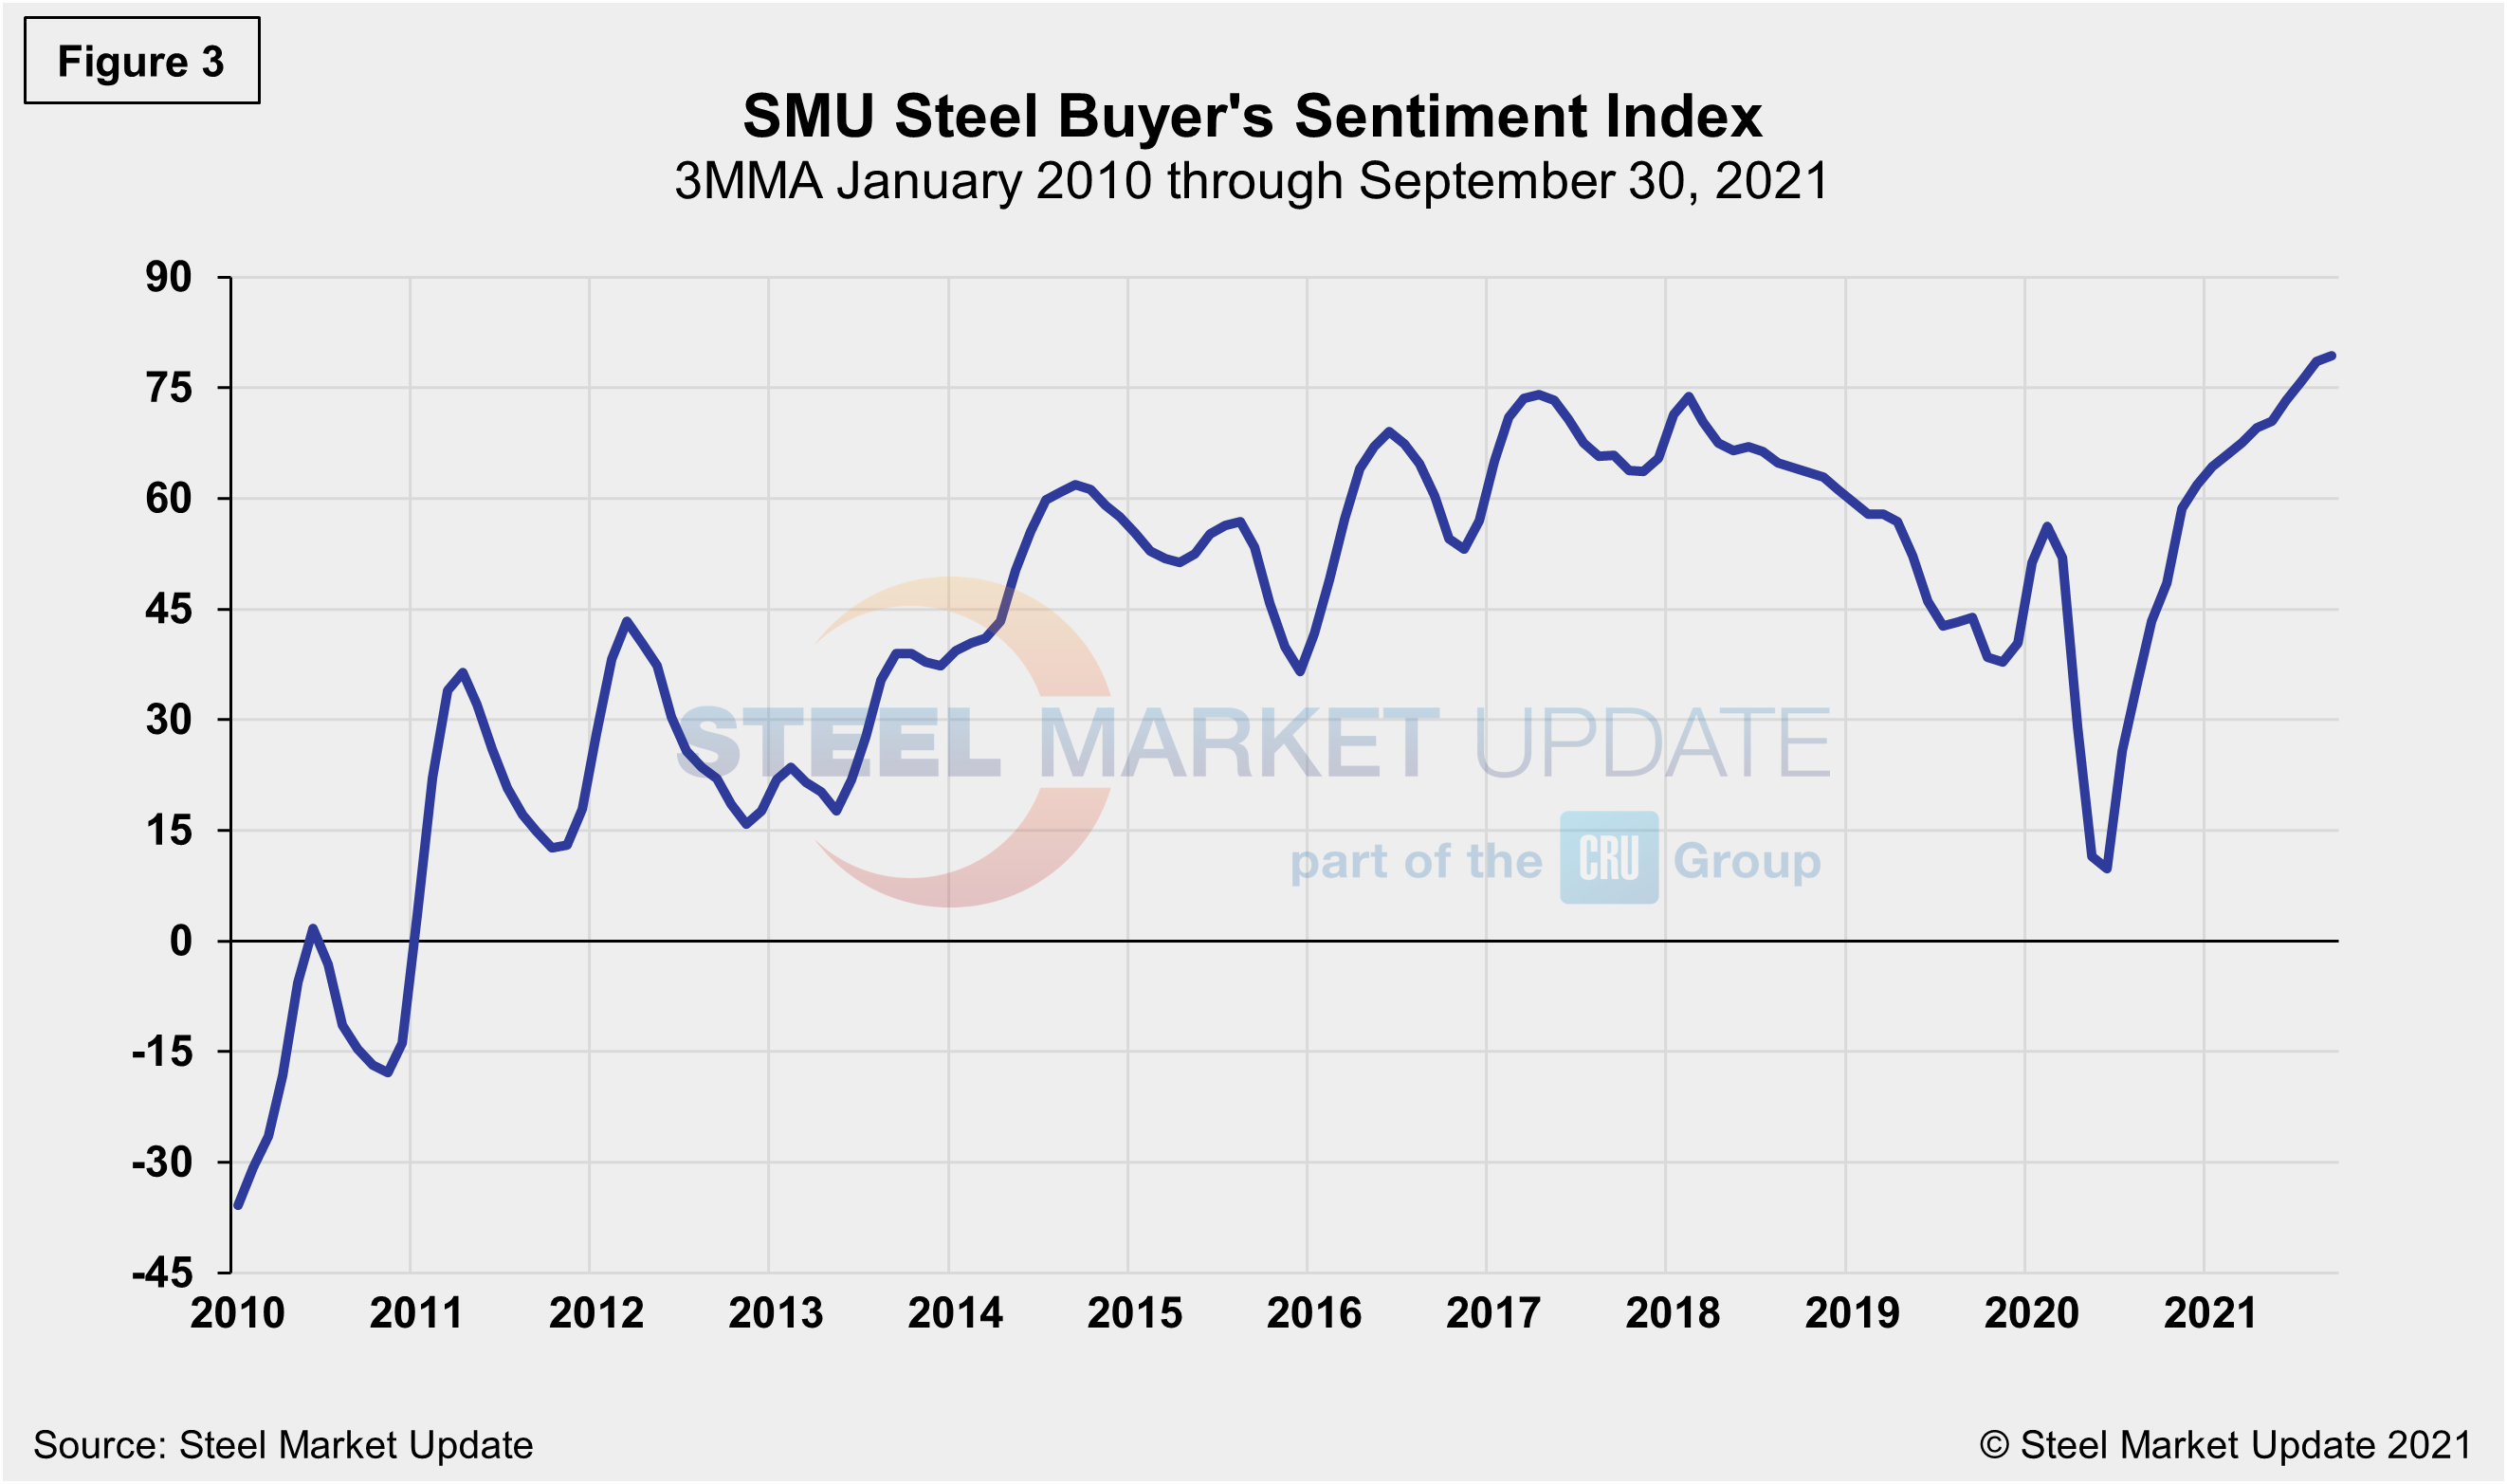
The SMU Steel Buyers Sentiment Index is a measure of the current attitude of North American steel buyers regarding their company’s chances for success in today’s market. The single value of the current sentiment index fell from +58 in early March 2020 to -8 less than a month later as the pandemic hit the economy. It has since rebounded to a healthy +83 as of Sept. 30. Figure 3 shows the 3MMA of the index since 2010. A reading above the neutral point of zero indicates that buyers have a positive attitude about their prospects. Strong demand and exceptionally high steel prices should keep the Steel Buyer’s Sentiment Index at a highly optimistic level for the foreseeable future.
By David Schollaert, David@SteelMarketUpdate.com


