

Market Data

November 11, 2021
Steel Mill Lead Times: Hot Rolled Down to Seven Weeks
Written by Tim Triplett
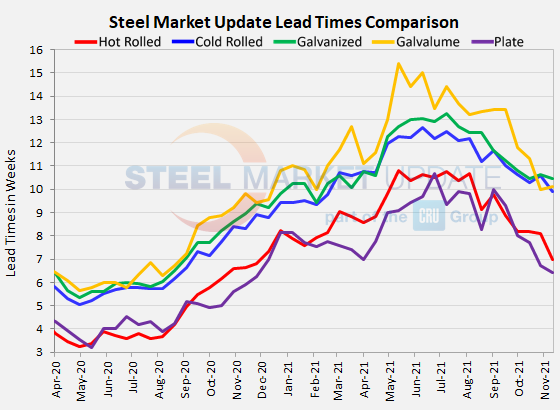
Lead times for orders of flat rolled and plate steel continue to shorten, as expected in a period when steel prices are declining. SMU’s latest check of the market shows the typical hot rolled lead time has now dipped below seven weeks for the first time since November 2020. That’s nearly a month shorter than in May of this year when the average HR lead time was the longest ever recorded in SMU’s 10-year data history at 10.81 weeks.
The buyers polled by SMU this week reported mill lead times ranging from 4-11 weeks for hot rolled, 6-15 weeks for cold rolled, 7-15 weeks for galvanized, 6-12 weeks for Galvalume, and 4-8 weeks for plate.
The average lead time for spot orders of hot rolled has declined to 6.97 weeks, from 8.11 weeks in late October. Cold rolled lead times now average 9.91 weeks, a decline from 10.58 two weeks ago. Galvanized lead times dipped to 10.45 weeks from 10.61 in the same period. The average Galvalume lead time moved up to 10.57 from 10.00.
Like sheet products, mill lead times for plate have also shortened. The average plate lead time moved down to 6.43 weeks from the 6.71 weeks seen in SMU’s market check two weeks ago.
How far above average are the current lead times? Prior to this year, HR lead times averaged 4.08 weeks; CR 6.07 weeks, galvanized 6.39 weeks, Galvalume 6.68 weeks and plate 5.57 weeks. Clearly, the market still has a way to go – roughly three weeks – before lead times will be considered “normal.”
Lead times are considered a leading indicator of steel prices. Shorter lead times indicate mills are less busy and more likely to discount prices to fill their order books.
By Tim Triplett, Tim@SteelMarketUpdate.com


