

Market Data

November 12, 2021
SMU Steel Buyers Sentiment: Has Optimism Peaked?
Written by Tim Triplett
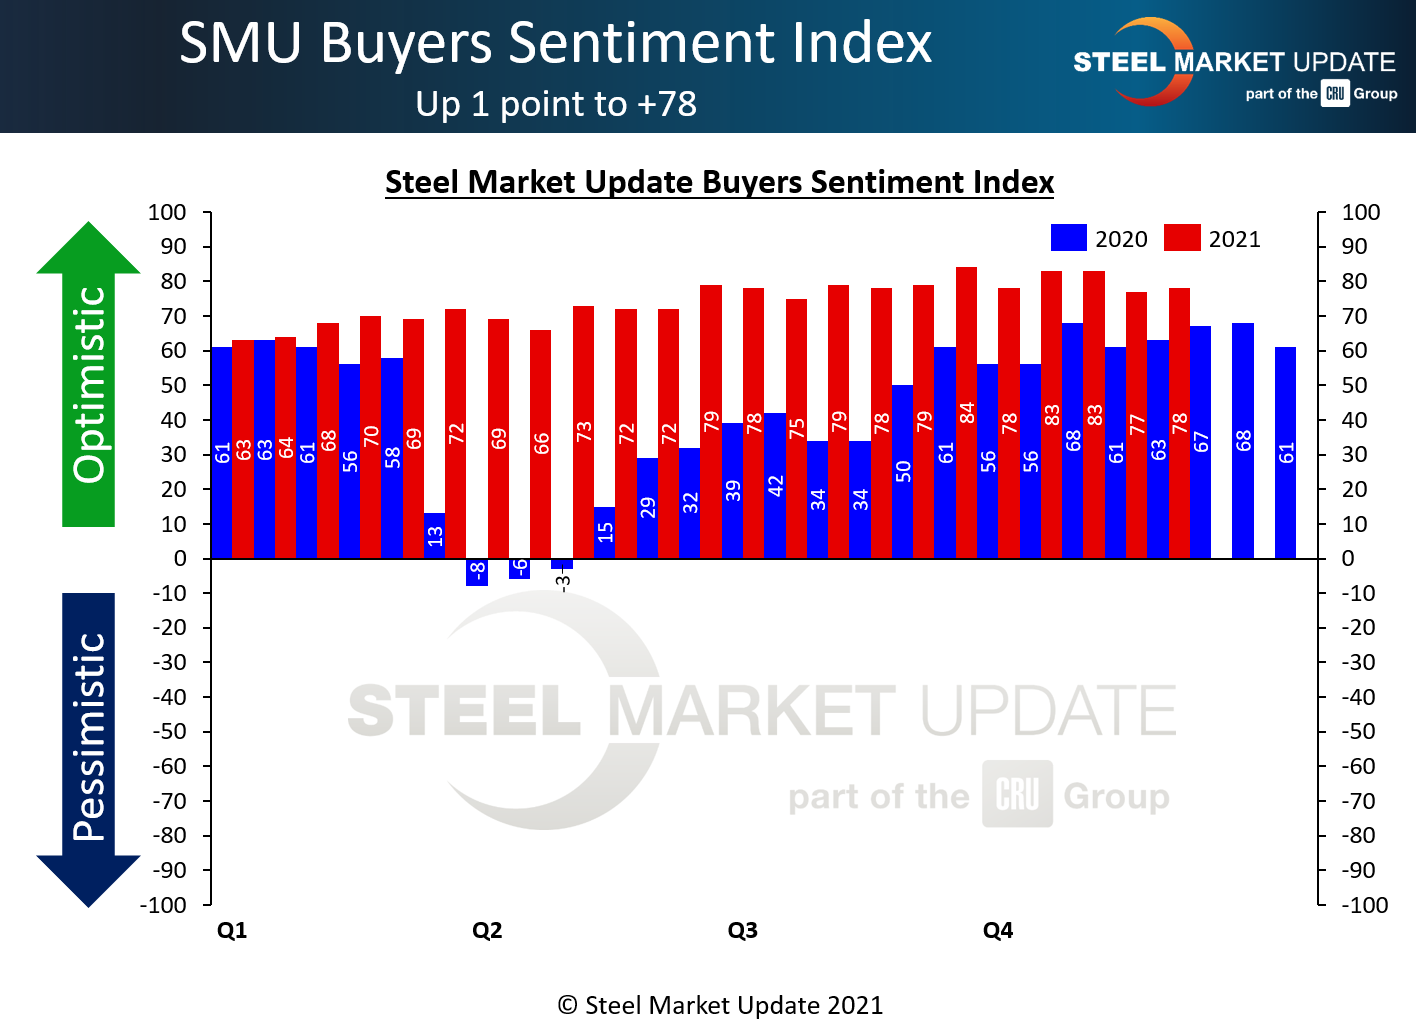
Steel prices are on the way down, but not steel buyers’ optimism – at least not yet. Steel Market Update’s indexes for both Current and Future Buyers Sentiment registered lofty readings of +78 this week. Could this be industry optimism at its peak?
SMU surveys buyers every two weeks and asks how they view their chances of success in the near and longer term. SMU’s Current Buyers Sentiment Index registered +78, up a point over the past two weeks and not far from its all-time high of +84 in early September.
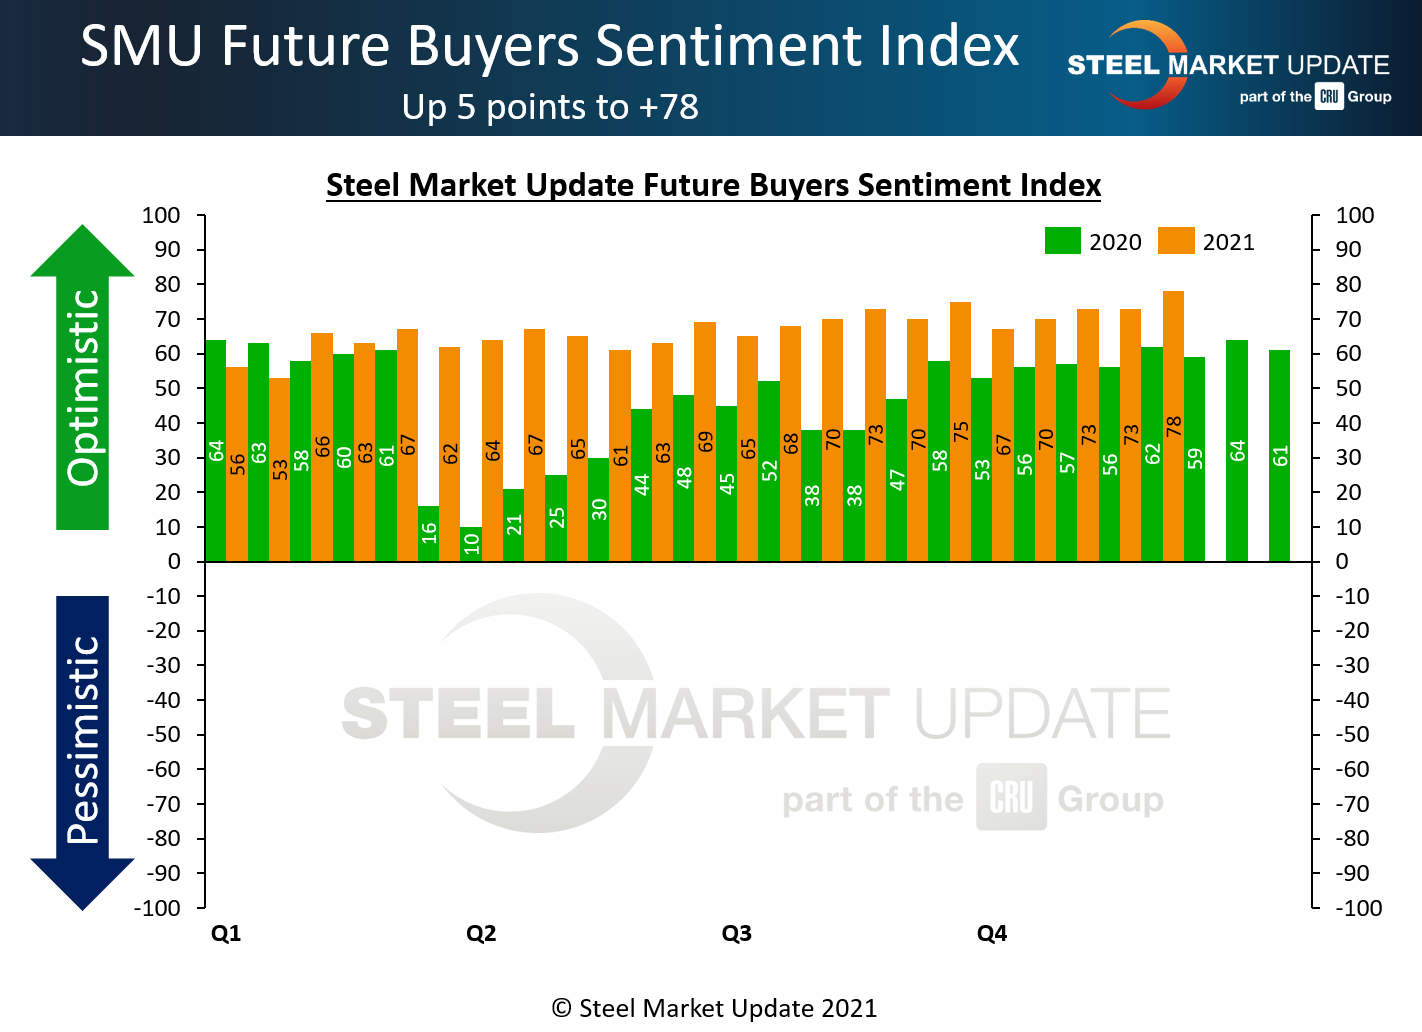
Future Sentiment – which measures steel buyers’ feelings about their prospects three to six months in the future – rose by five points to a reading of +78, setting a new record, topping the prior all-time high of +77 in February 2018.
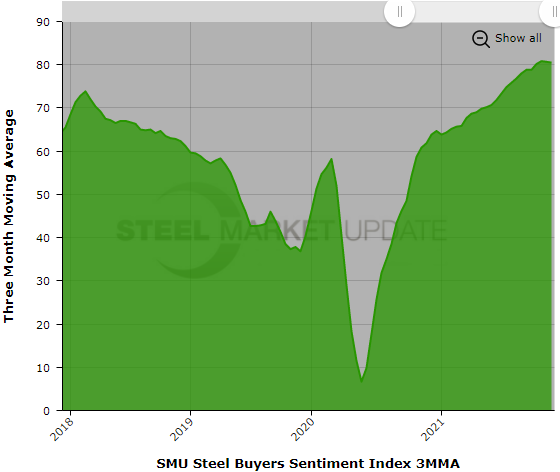
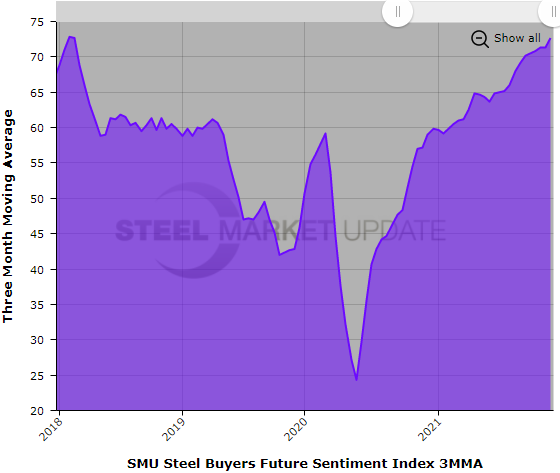
Measured as a three-month moving average (3MMA) to smooth out the variability, the Current Sentiment 3MMA stood at +80.50 this week, while the Future Sentiment 3MMA was at +72.67 – both at or near record highs. For comparison, at this time last year as the economy recovered from the pandemic, the 3MMA readings were about 20 points lower.
How to make sense of these numbers? No doubt they reflect the strong demand and record earnings buyers have enjoyed in 2021. But in a declining-price market, which poses a threat to inventory values, Future Sentiment should be fading, not setting new records. Clearly most buyers are skeptical of experts’ predictions that a big price correction is in the works. So far the price declines have been modest and manageable. But “seeing is believing,” as they say. And sentiment would turn more bearish if price decreases started to eat into margins. While it’s possible that our respondents have a better read on the market than the experts, it’s also possible that human emotions are a lagging indicator.
What Respondents Had to Say
“Market transition always makes for surprises.”
“Too much uncertainty … as usual.”
“While 2022 won’t be as robust profit-wise as 2021, it could very well be our second best year ever (after ’21).”
“With Section 232 trade tariffs on the EU and others going away, I see lower prices in 2022 and a harder time booking futures. … That will put more pressure on domestic mills – so it’s a self-fulfilling cycle.”
“The big boys aren’t the only ones having record months, quarters and years. This is a fun time to be a service center … finally!
About the SMU Steel Buyers Sentiment Index
SMU Steel Buyers Sentiment Index is a measurement of the current attitude of buyers and sellers of flat-rolled steel products in North America regarding how they feel about their company’s opportunity for success in today’s market. It is a proprietary product developed by Steel Market Update for the North American steel industry.
Positive readings run from +10 to +100. A positive reading means the meter on the right-hand side of our home page will fall in the green area indicating optimistic sentiment. Negative readings run from -10 to -100. They result in the meter on our homepage trending into the red, indicating pessimistic sentiment. A reading of “0” (+/- 10) indicates a neutral sentiment (or slightly optimistic or pessimistic), which is most likely an indicator of a shift occurring in the marketplace. Sentiment is measured via Steel Market Update surveys that are conducted twice per month. We display the meter on our home page.
We send invitations to participate in our survey to more than 600 North American companies. Our normal response rate is 100-150 companies. Approximately 40 percent are manufacturers, 45 percent are service centers/distributors, and 15 percent are steel mills, trading companies or toll processors involved in the steel business.
Click here to view an interactive graphic of the SMU Steel Buyers Sentiment Index or the SMU Future Steel Buyers Sentiment Index.
By Tim Triplett, Tim@SteelMarketUpdate.com


