

Market Data

November 15, 2021
SMU Key Market Indicators Show Resilience
Written by David Schollaert
Monthly Key Market Indicators, as analyzed by Steel Market Update, edged down over the past month as positive indicators have decreased successively since June. A typical summer slowdown started the momentum shift, however, a surge in COVID variant cases, compounded by a slow-moving job market and supply-chain bottlenecks have continued to push the market indicators lower.
SMU’s Key Market Indicators include a host of data on the economy, raw materials, manufacturing, construction, and steel sheet and long products, offering a snapshot of current sentiment and the near-term expected trajectory of the economy. Markers for the Present Situation have contracted for a fifth straight month, yet Trends rebounded after slipping for three consecutive months.
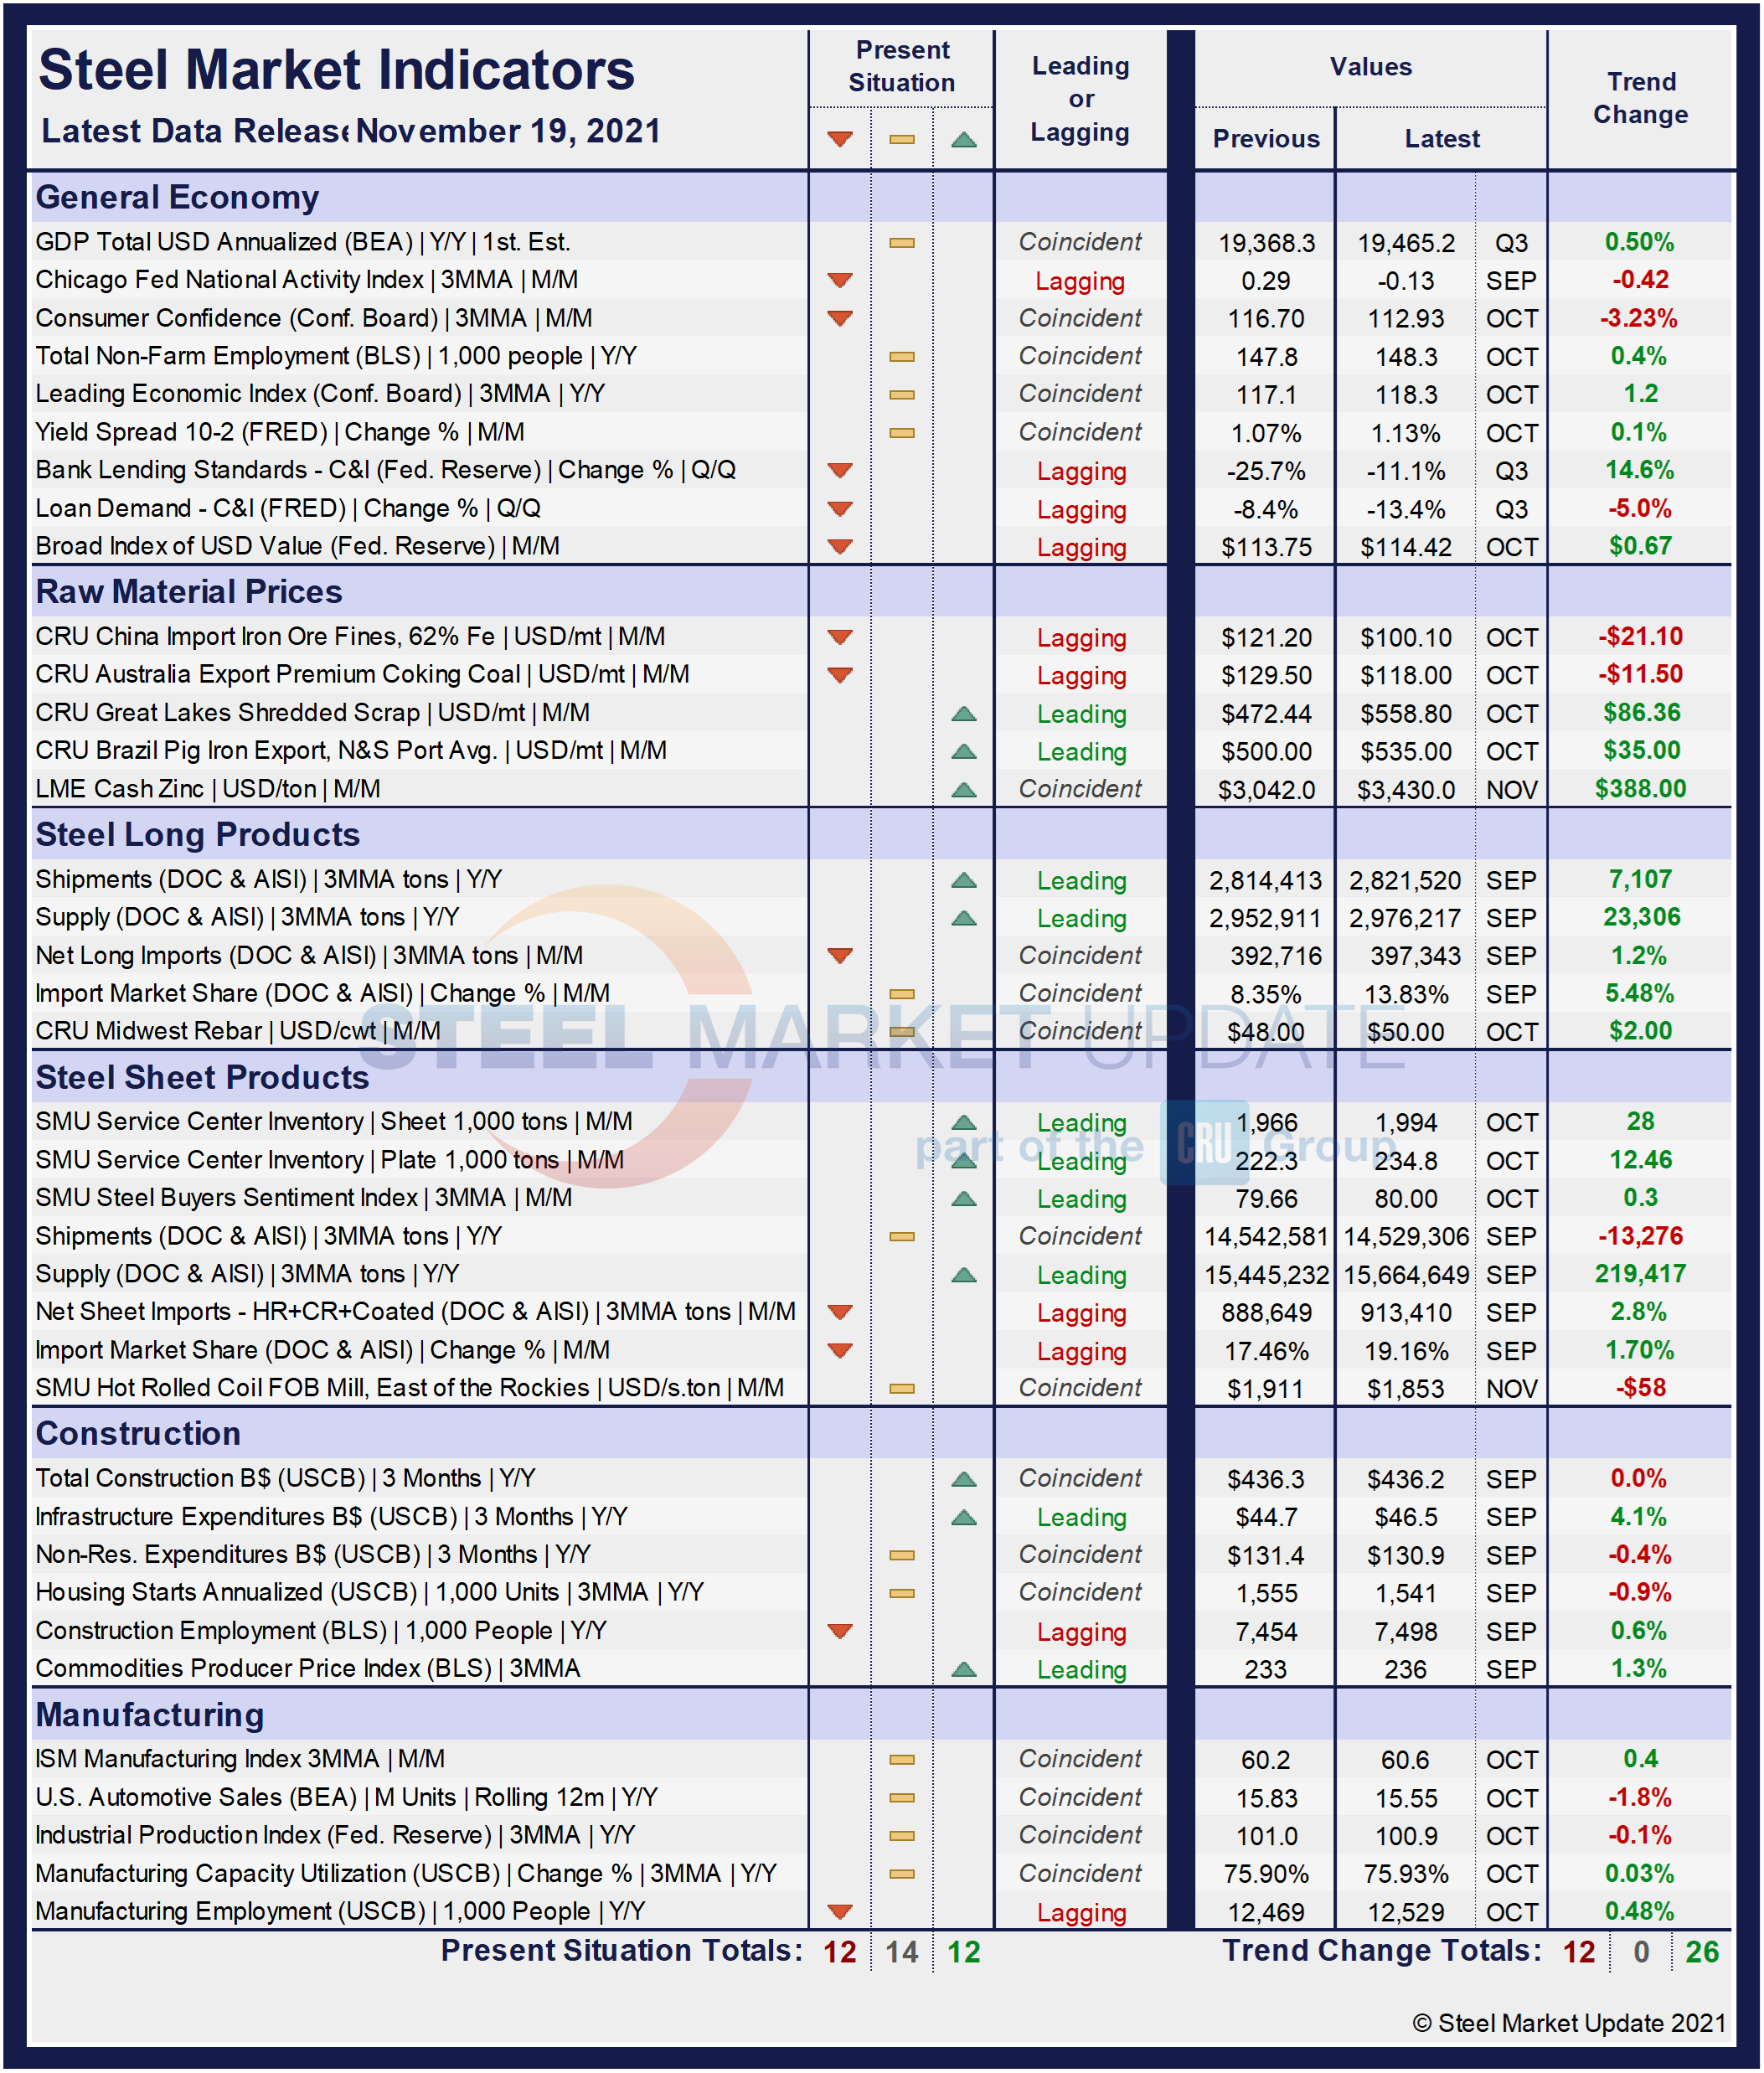
In the latest data, 12 of the 38 Present Situation indicators are negative, compared to the month prior when 11 of the 38 indicators were negative. The neutral position was unchanged from the month prior with a reading of 14 since August, while the positive indicators lost momentum again, slipping from 13 to 12 over the same period.
Negative indicators trended down consecutively from February through May reaching as low as three. However, October’s indicator now stands at 12, the highest measurement year-to-date, and inching towards some of the higher markers seen last year when the marketplace was slowly recovering from the initial COVID effects. At its worst, 18 of the 38 indicators shifted negative last year as the economy suffered from pandemic-related disruptions. Although present results show progress, the improvements have slowed in the final quarter of the year.
SMU’s Present Situation and Trends analyses in the table below are based on the latest available data as of Nov. 19, 2021. Readers should regard the color codes in the “Present Situation” column as a visual summary of the current market condition. The “Trend” columns are also color coded to give a quick visual appreciation of the market’s direction. All data included in this table was released within the past month. The month or specific date to which the data refers is shown in the second column from the far right. Click to expand the table below.
Present Situation
SMU’s Present Situation indicators below highlight the upward trajectory of the domestic market. Although not smooth, the recovery has been remarkable. Since June, however, momentum has faded, and growth has stumbled as the economy seems to lack traction. The direction was up and gaining ground until June, but has since eroded repeatedly. Positive indicators rose from 11 to 20 through June, but are now at 12, and could trend down further in the near-term. Negative indicators had grown four out of the past five months through October. The more telling trend may be the stability in the neutral indicators, presently holding at 14 for three straight months after expanding by four points in August. The trend suggests the market’s direction is unclear, but potentially stable.
Supply shortages, particularly in the auto and construction sectors, continue. The effects of rising producer prices and an underperforming employment sector are compounded by rising interest rates and a pandemic that refuses to go away.
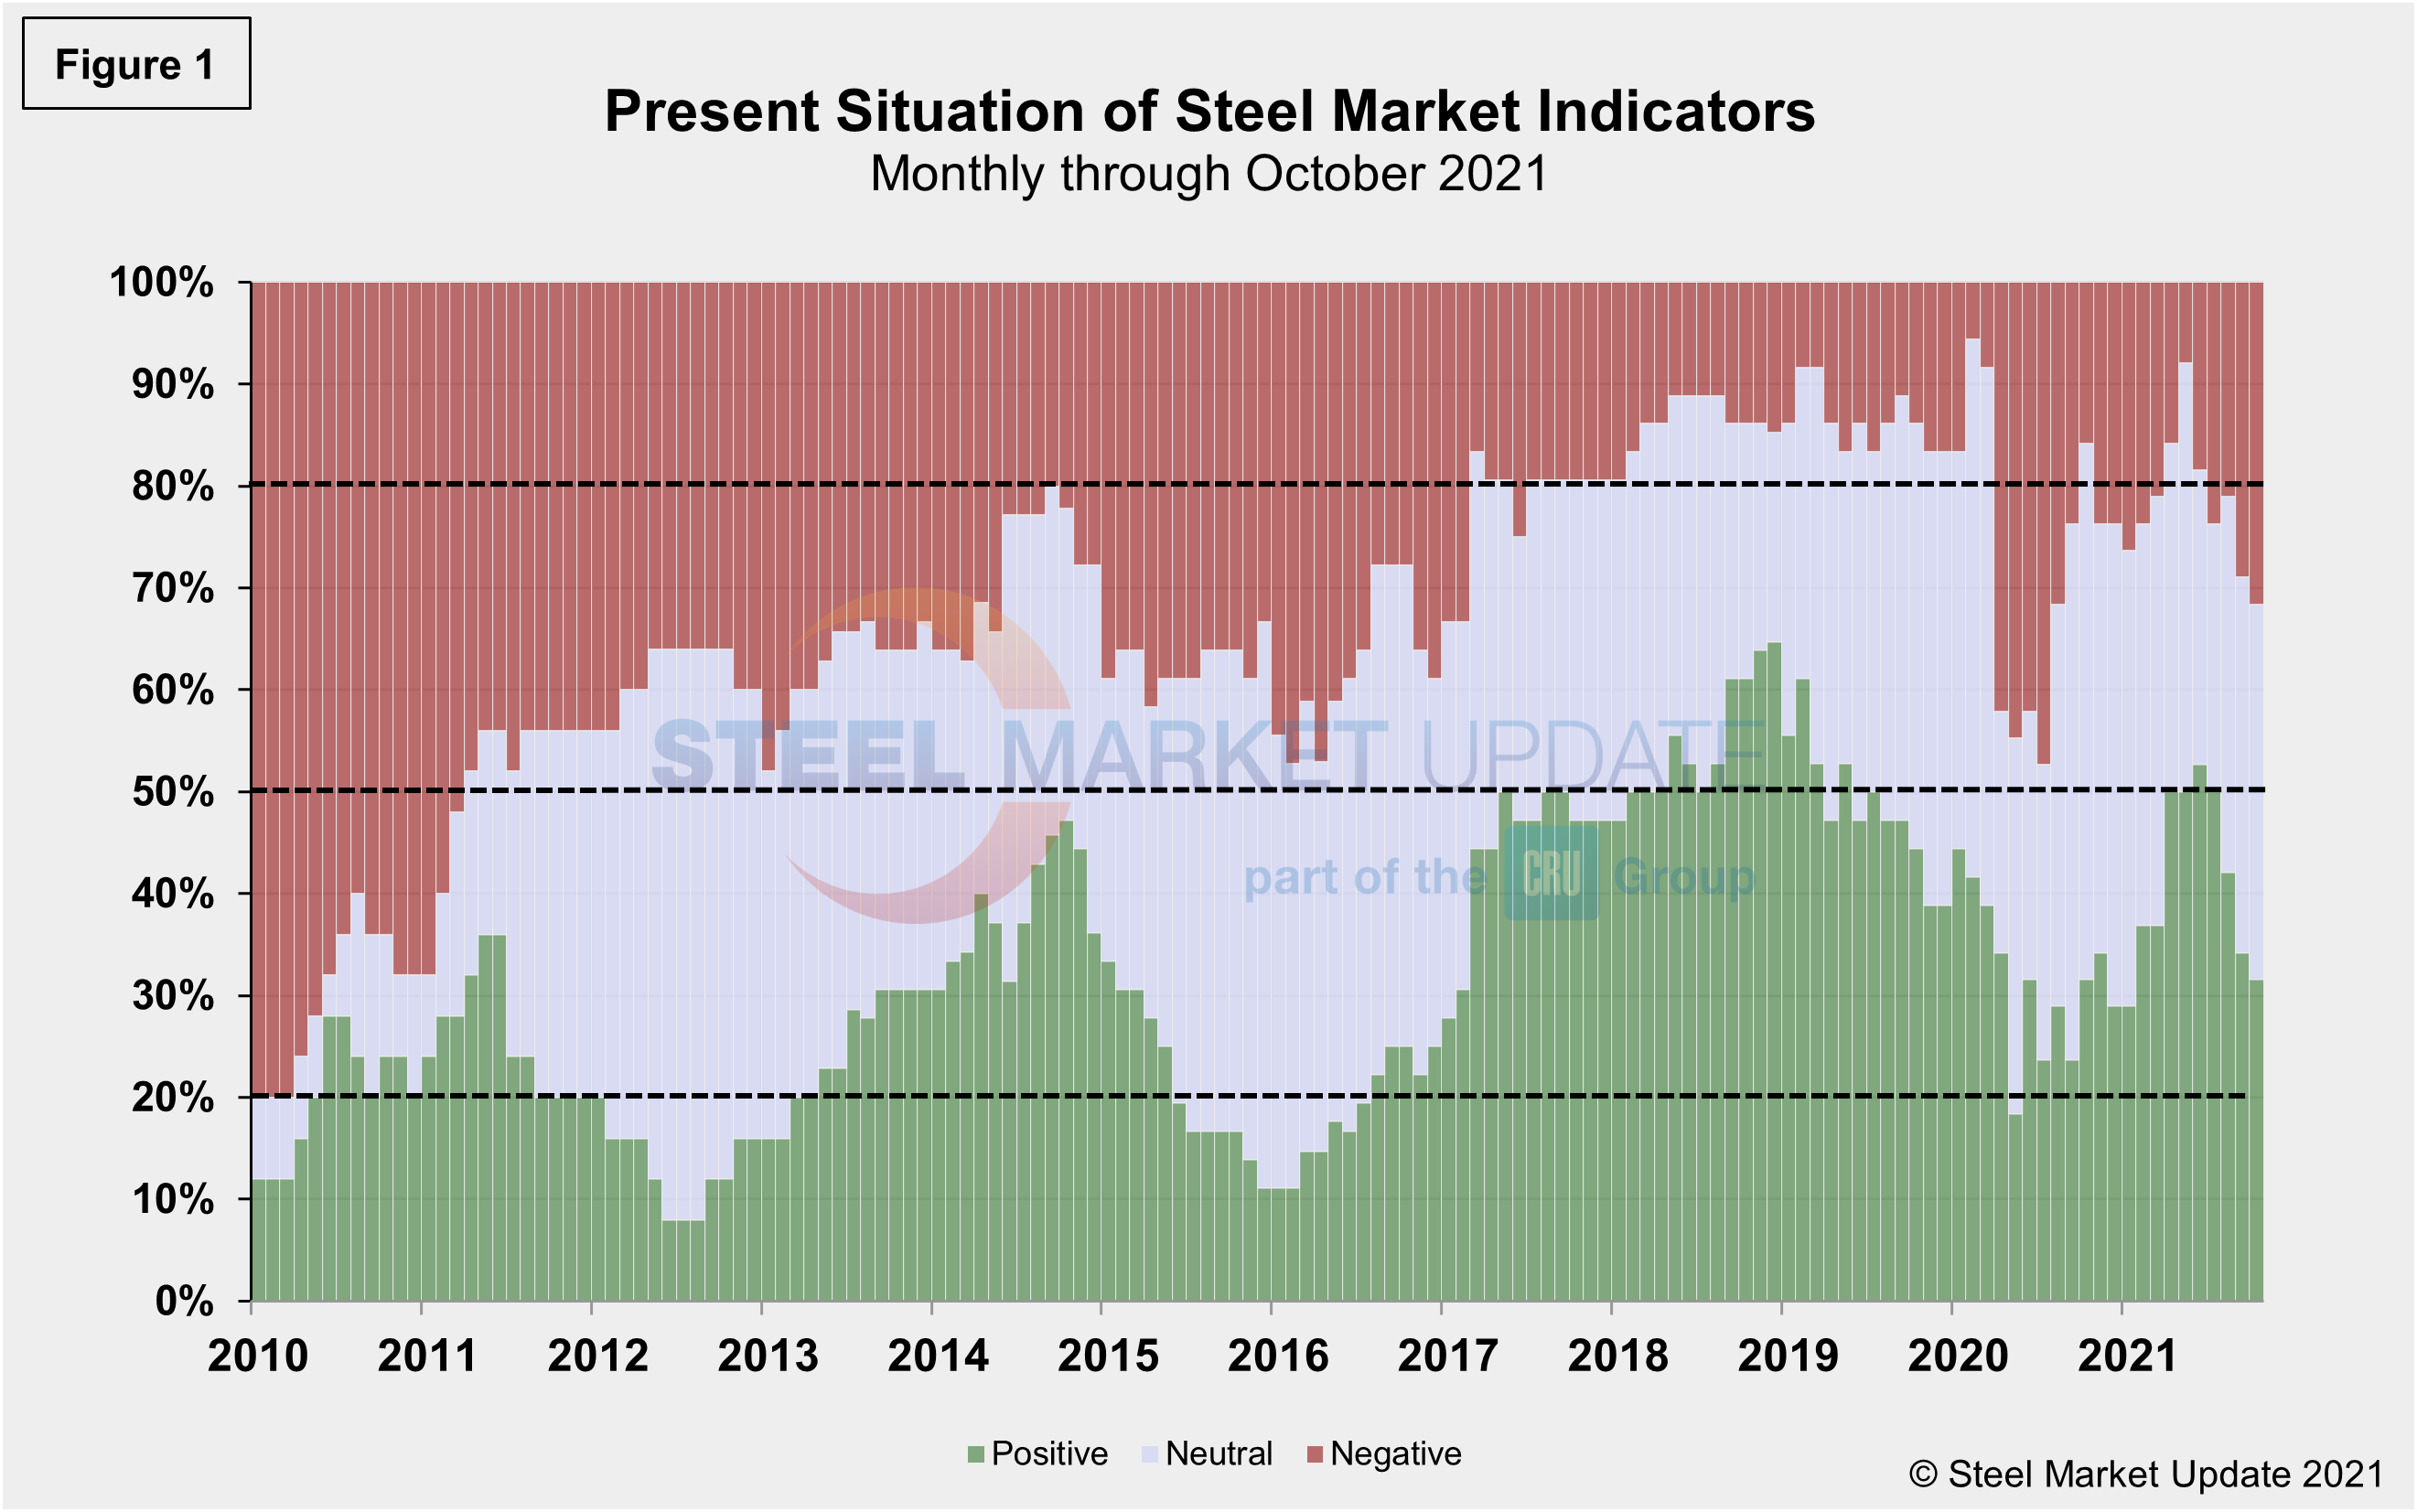
Present results have continued to reveal a more apprehensive marketplace compared to last month’s data due to the repeated rise in the negative totals and the continued slip in the positive figures. Presently, nearly 36.8% of the marketplace is neutral or unclear, a 10-percentage point increase from its lowest mark in July, but unchanged for the third straight month. Through October, 31.6% of the marketplace is positive, down from 34.2% the month prior, while 31.6% is negative, up from 28.9% in September. Presently, 68.4% of the population still sees the marketplace as promising, or neutral-to-positive, according to SMU’s assessment of key market indicators. Yet it represents a 2.7 percentage point decrease from one month ago.
Our monthly assessment of the Present Situation since January 2010 on a percentage basis is shown in Figure 1.
Trends
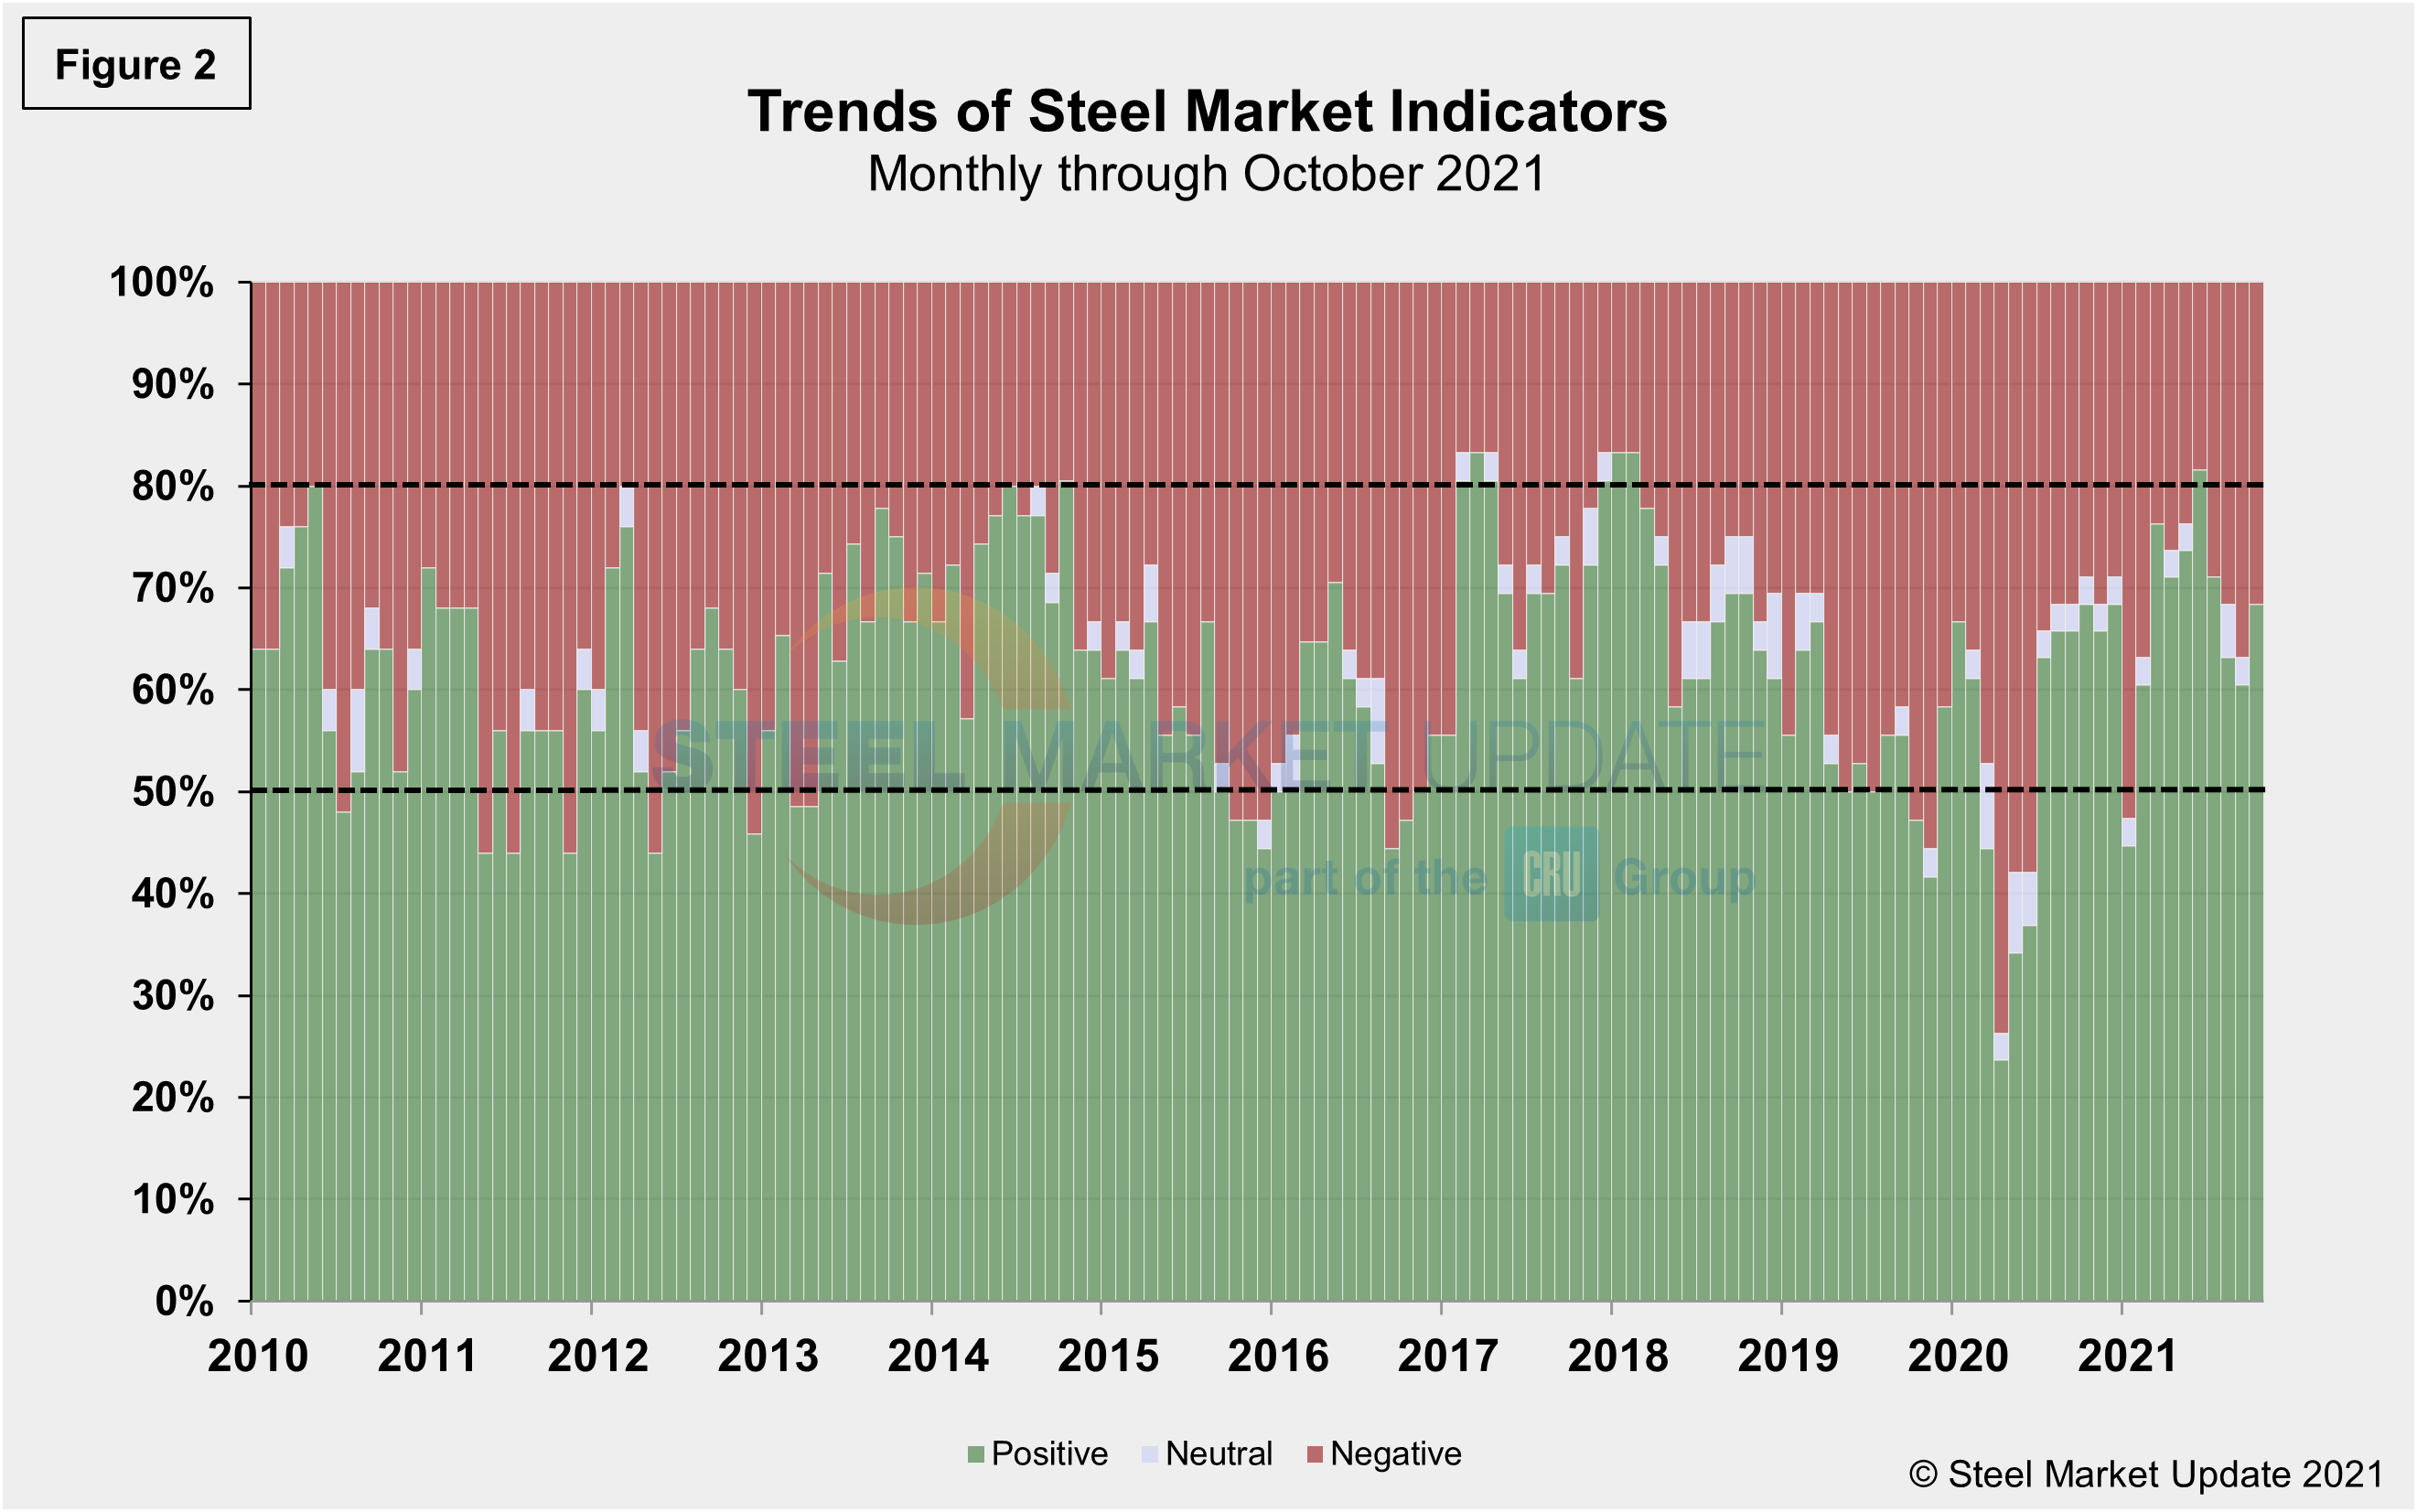
SMU’s Trends indicators moved in an opposing direction to the Present Situation, as the outlook for the second half of the fourth quarter improves. It is important to note that most values in the Trends columns are three-month moving averages (3MMA) to smooth erratic monthly data, but nonetheless, the improvement has been noticeable as the direction has made a clear shift positive. Note that in many cases this is not October or November data, but data that was released in October and/or November for previous months. Compared to month-ago data, the negative trend slipped to 31.6%, compared to 36.8%. The neutral trend slipped to zero from 2.6% the month prior and down from as high as 5.3% in August. The positive trend gained ground from 60.5% to 68.4% up nearly 8 percentage points month on month and reversing a three-month downturn. Figure 2 shows the recent movement of the trends and historical movement for comparison.
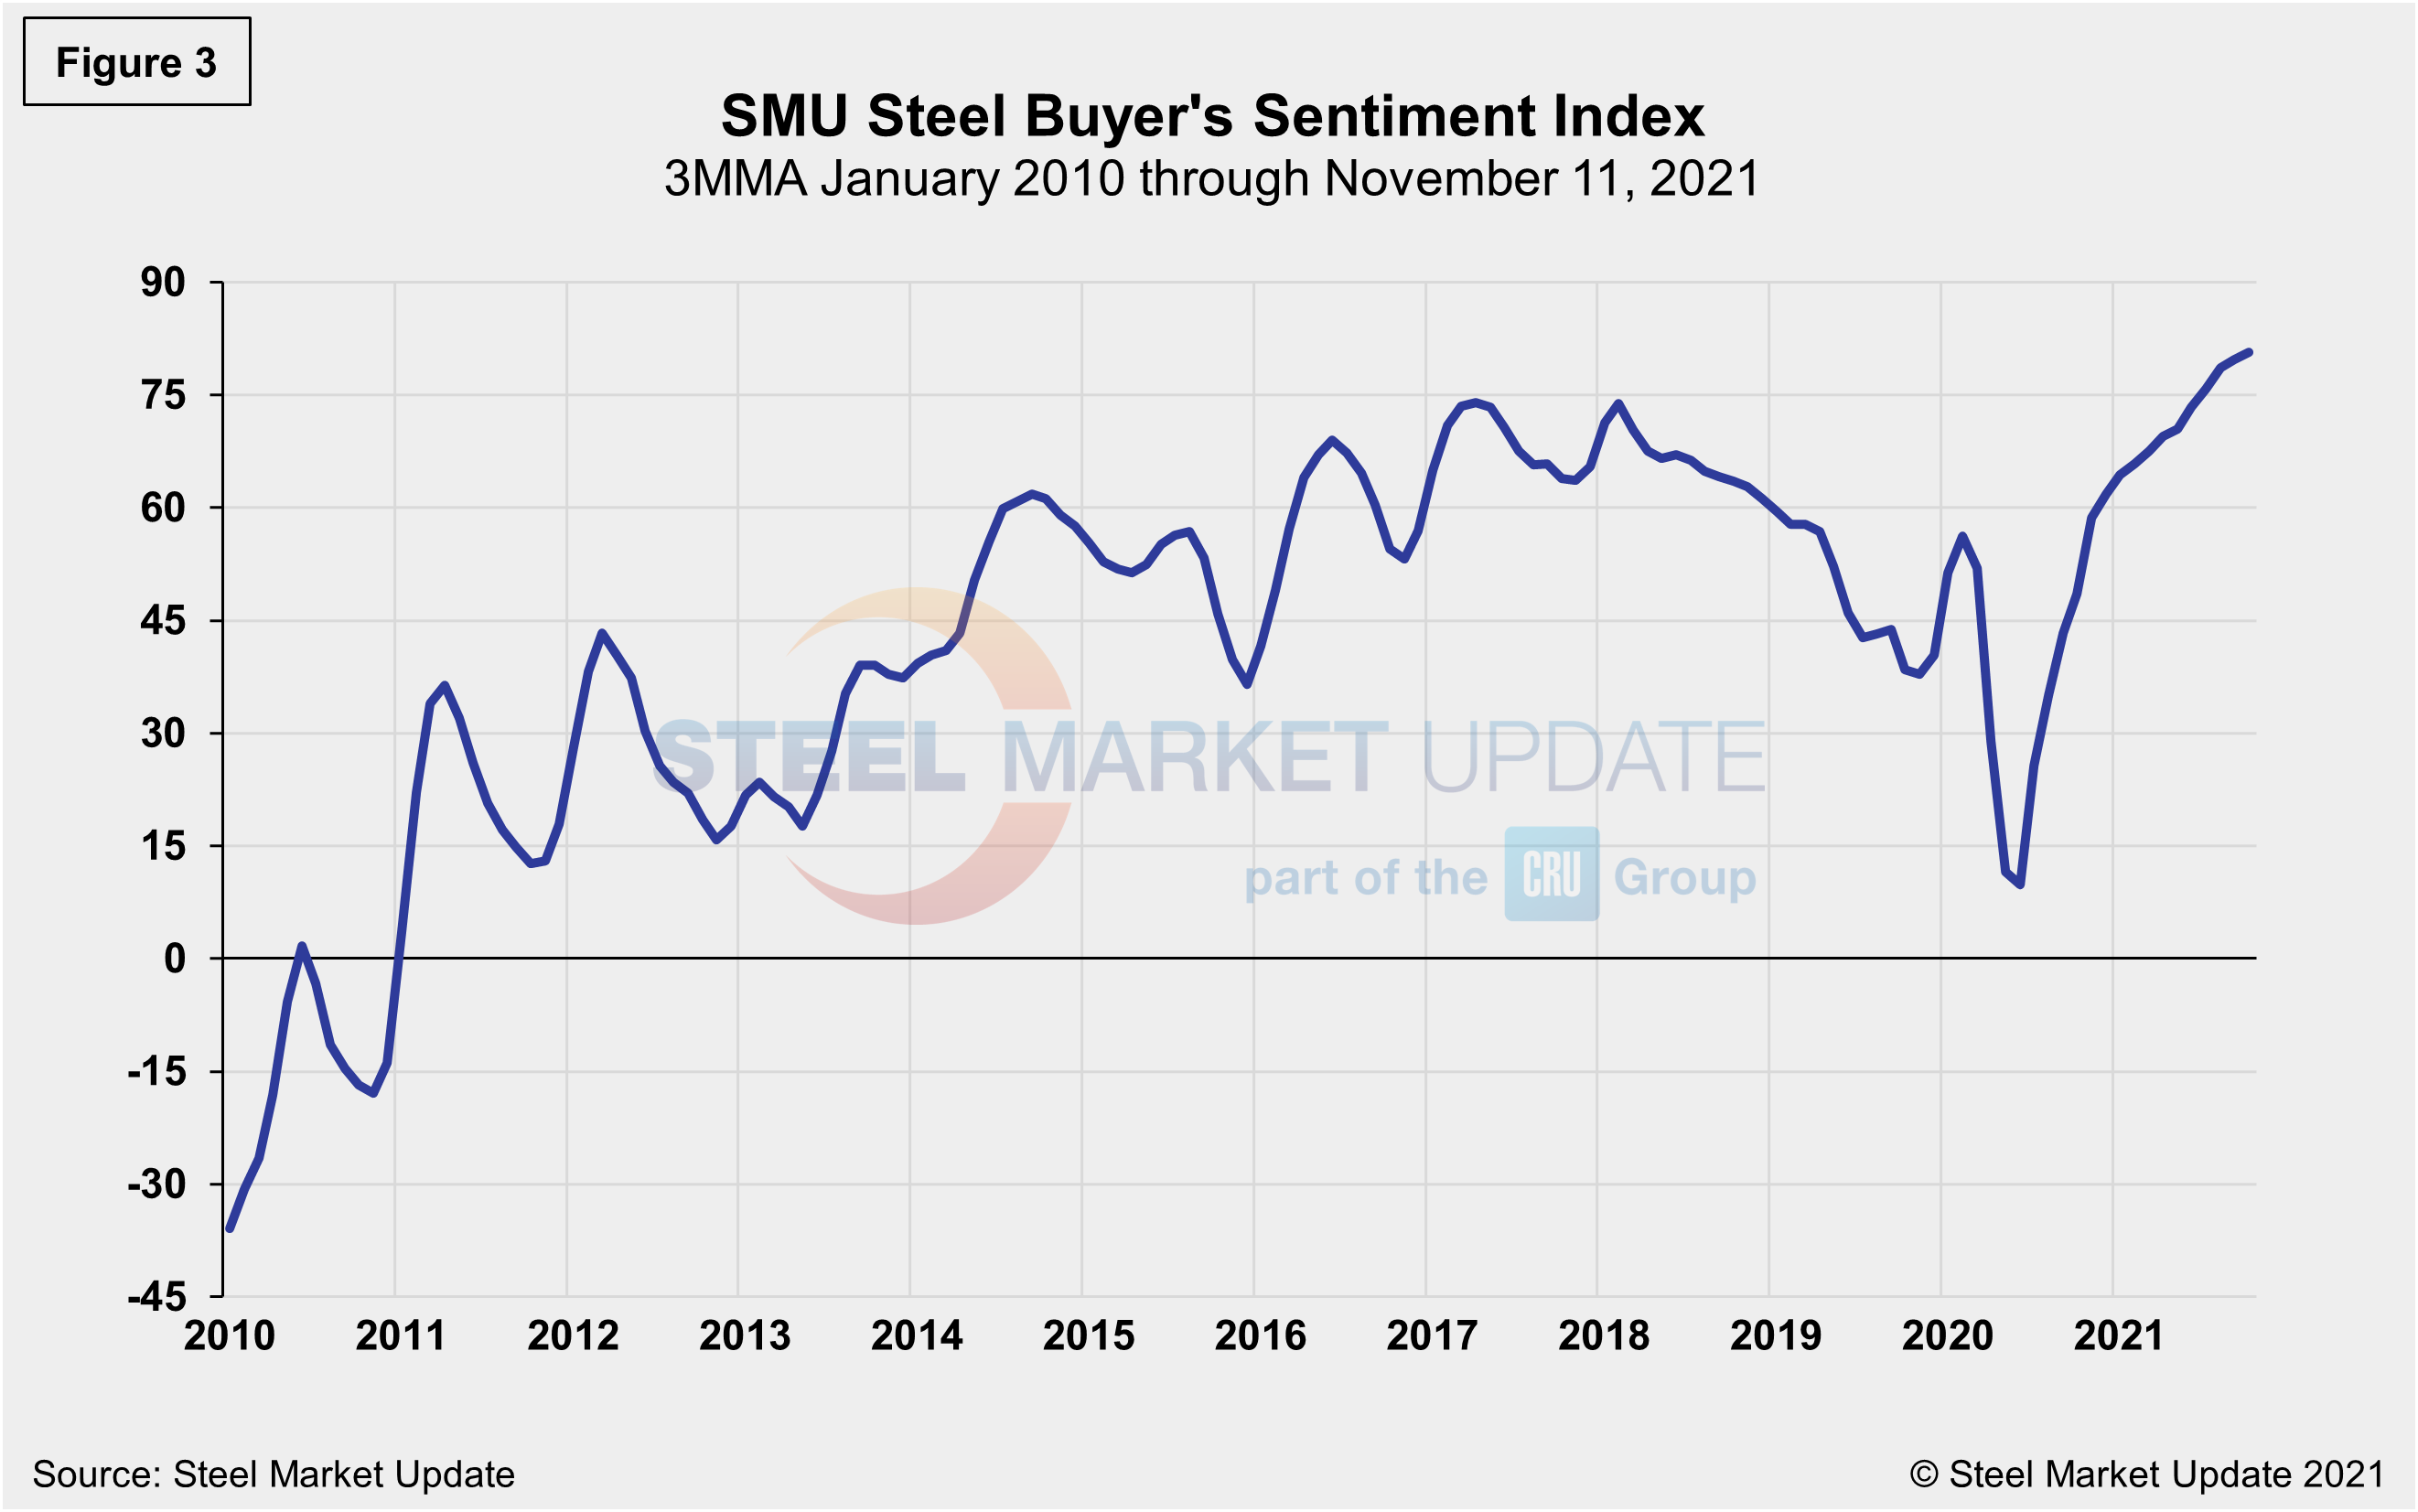
The SMU Steel Buyers Sentiment Index is a measure of the current attitude of North American steel buyers regarding their company’s chances for success in today’s market. The single value of the current sentiment index fell from +58 in early March 2020 to -8 less than a month later as the pandemic hit the economy. It has since rebounded to a healthy +78 as of Nov. 11. Figure 3 shows the 3MMA of the index since 2010. A reading above the neutral point of zero indicates that buyers have a positive attitude about their prospects. Strong demand and high steel prices should keep the Steel Buyer’s Sentiment Index at a highly optimistic level for the foreseeable future.
By David Schollaert, David@SteelMarketUpdate.com


