

Market Data

December 1, 2021
Consumer Confidence Slips to Nine-Month Low in November
Written by David Schollaert
U.S. consumer confidence slipped to a nine-month low in November, decreasing four out of the past five months. Novembers’ reading was driven by rising prices and continued COVID concerns, reported The Conference Board.
“Consumer confidence moderated in November, following a gain in October,” said Lynn Franco, senior director of economic indicators at The Conference Board. “Expectations about short-term growth prospects ticked up, but job and income prospects ticked down. Concerns about rising prices—and, to a lesser degree, the Delta variant—were the primary drivers of the slight decline in confidence. Meanwhile, the proportion of consumers planning to purchase homes, automobiles, and major appliances over the next six months decreased. The Conference Board expects this to be a good holiday season for retailers, and confidence levels suggest the economic expansion will continue into early 2022. However, both confidence and spending will likely face headwinds from rising prices and a potential resurgence of COVID-19 in the coming months.”
The headline index dipped by 2.1 points in November to 109.5 after edging up 1.8 points in October. It was the lowest reading since the index stood at 95.2 in February. November’s present situation index, which is based on consumers’ assessment of current business and labor market conditions, saw a 3.0-point decline month on month to a reading of 142.5, following a revised increase of 1.2 points in October. The expectations index, which is based on consumers’ short-term outlook for income, business and the labor market, slipped by 1.1 points to 87.6, it’s second-lowest mark all year.
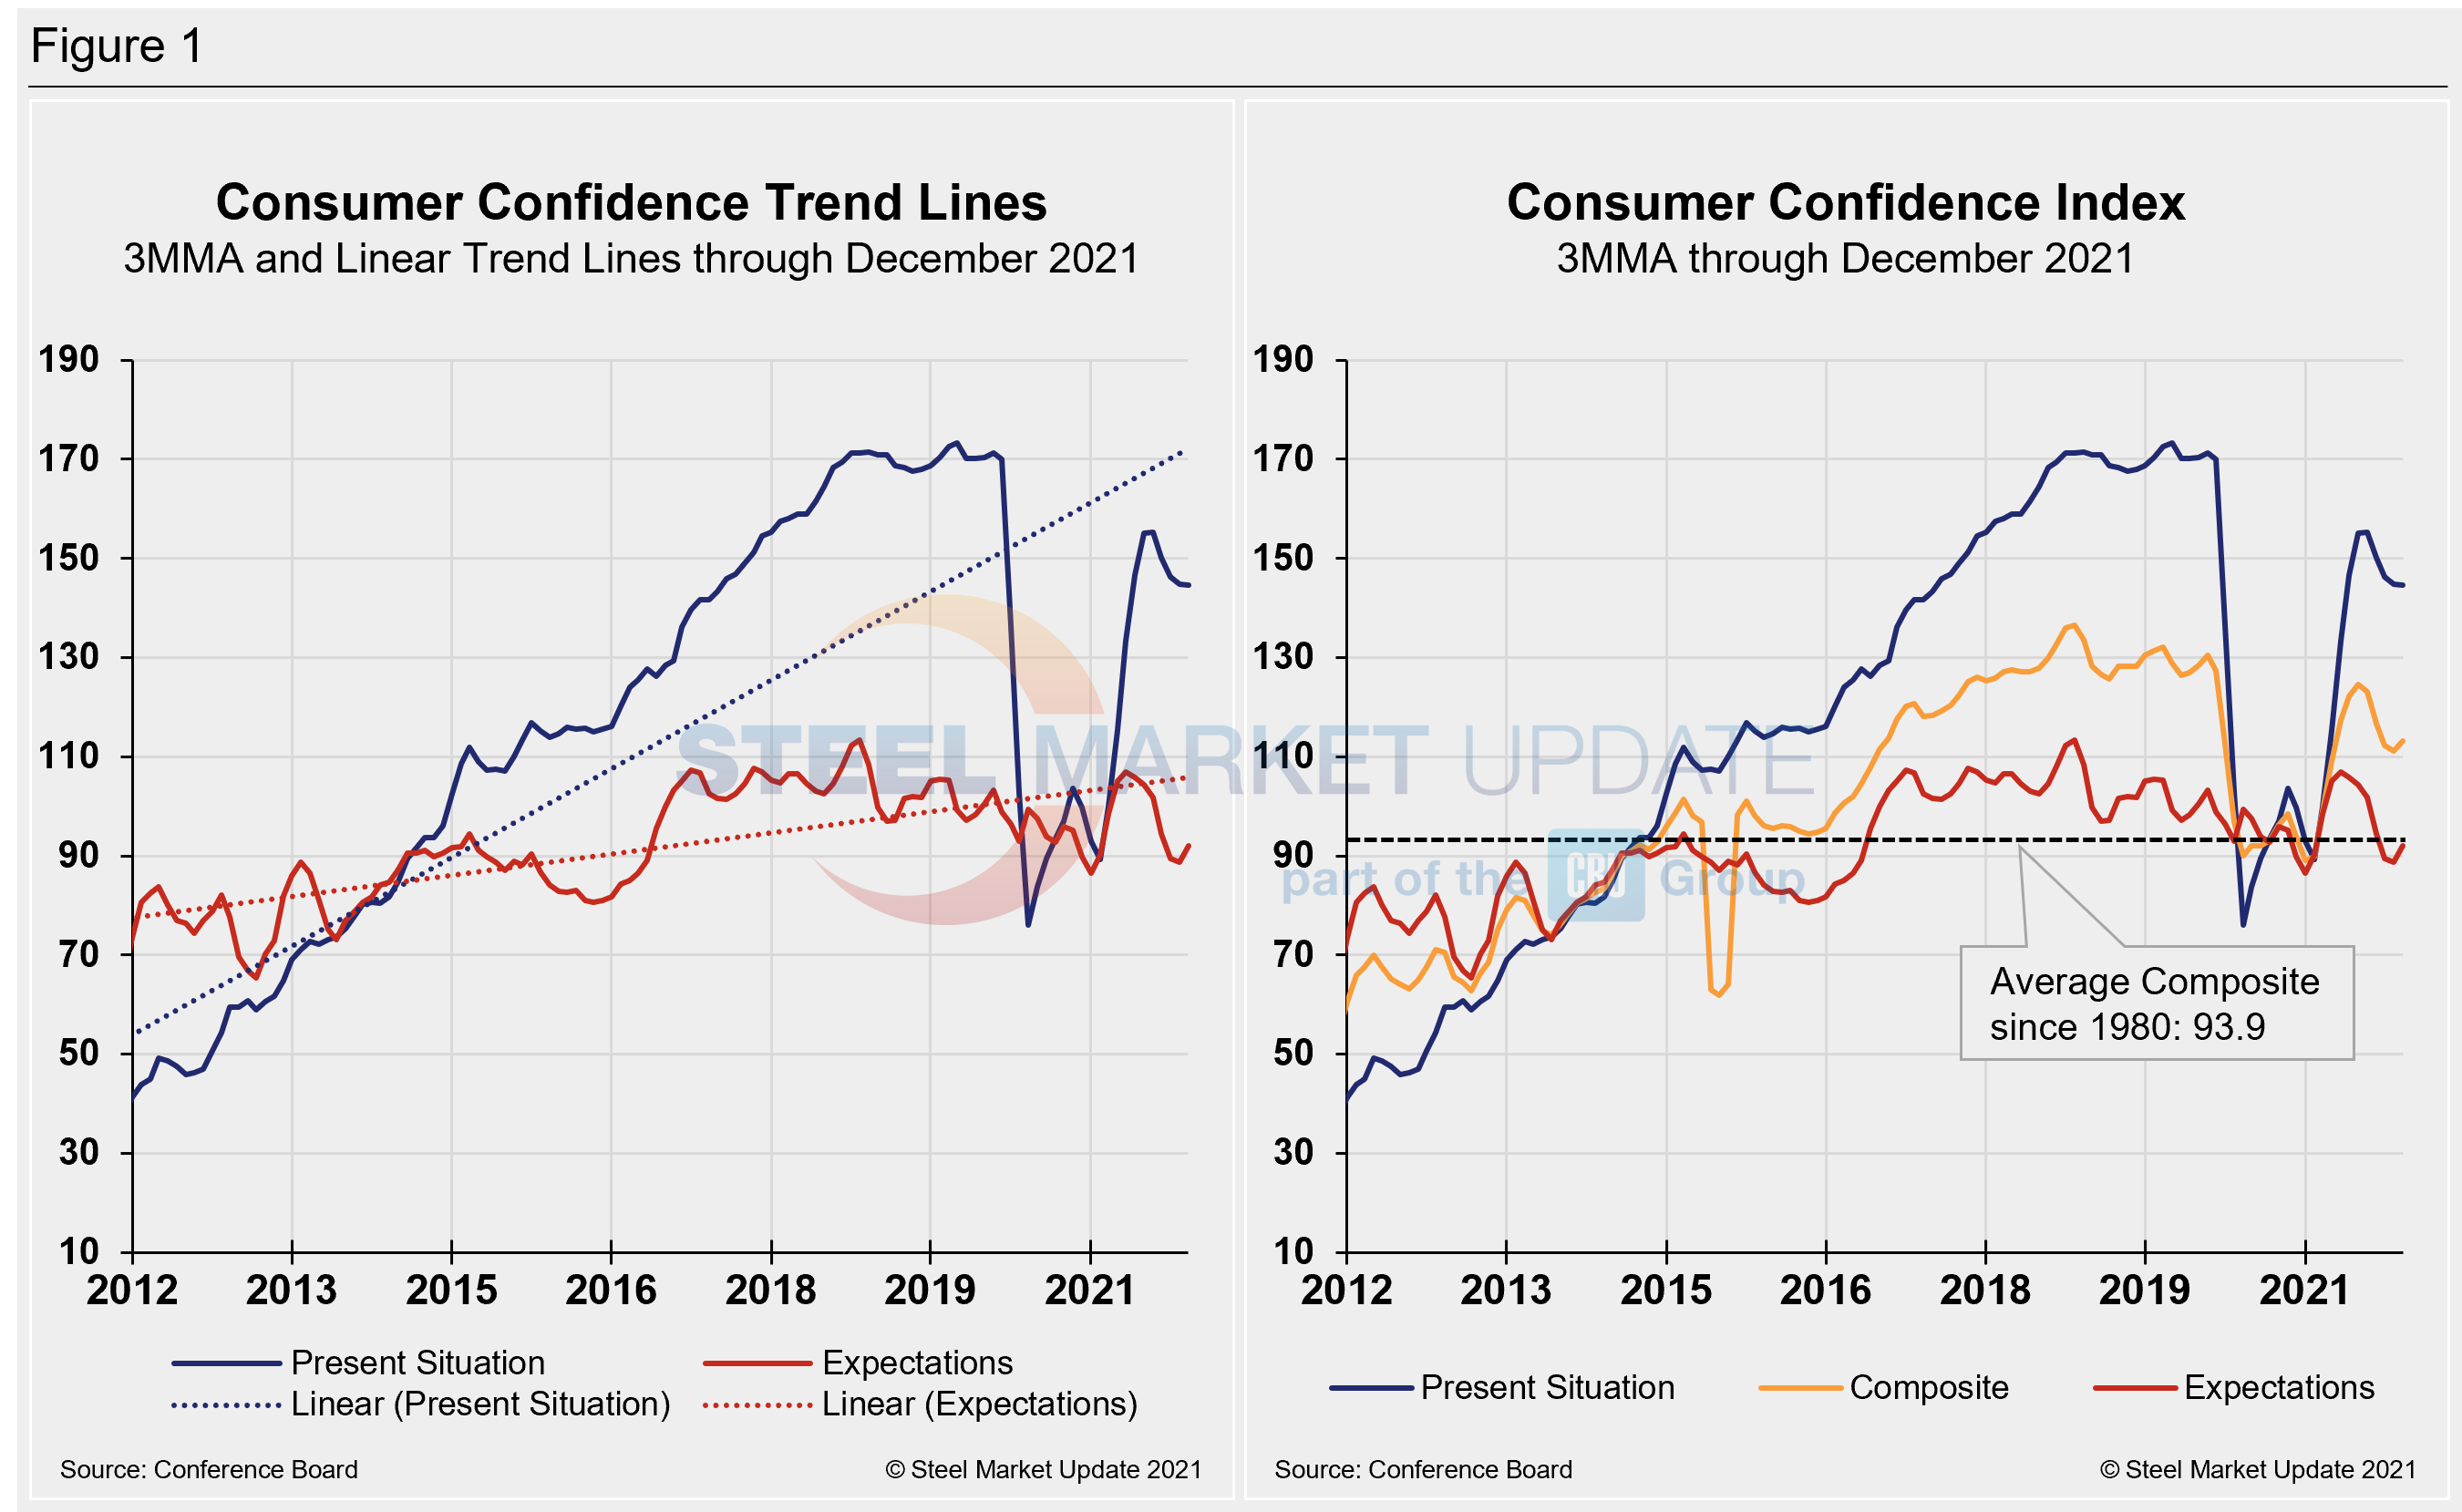
Calculated as a three-month moving average (3MMA) to smooth out the volatility, The Conference Board’s composite index slipped in November to 110.3 versus 112.2 in October – still well below the pre-pandemic high of 130.4 last February. Despite the repeated downturn, the index remains higher than the 98.5 seen a year ago. The composite index is made up of two sub-indexes: consumers’ view of the present situation and their expectations for the future. Figure 1 below notes the 3MMA linear trend lines from January 2012 through November 2021 versus the trend lines of all three subcomponents of the index: present situation, composite and future expectations. All three were above the average composite line in October 2020 before falling consecutively through February. The surge from March through June pulled all three indexes above the composite line once again, but all have since eroded, pulling expectations below the average composite line.
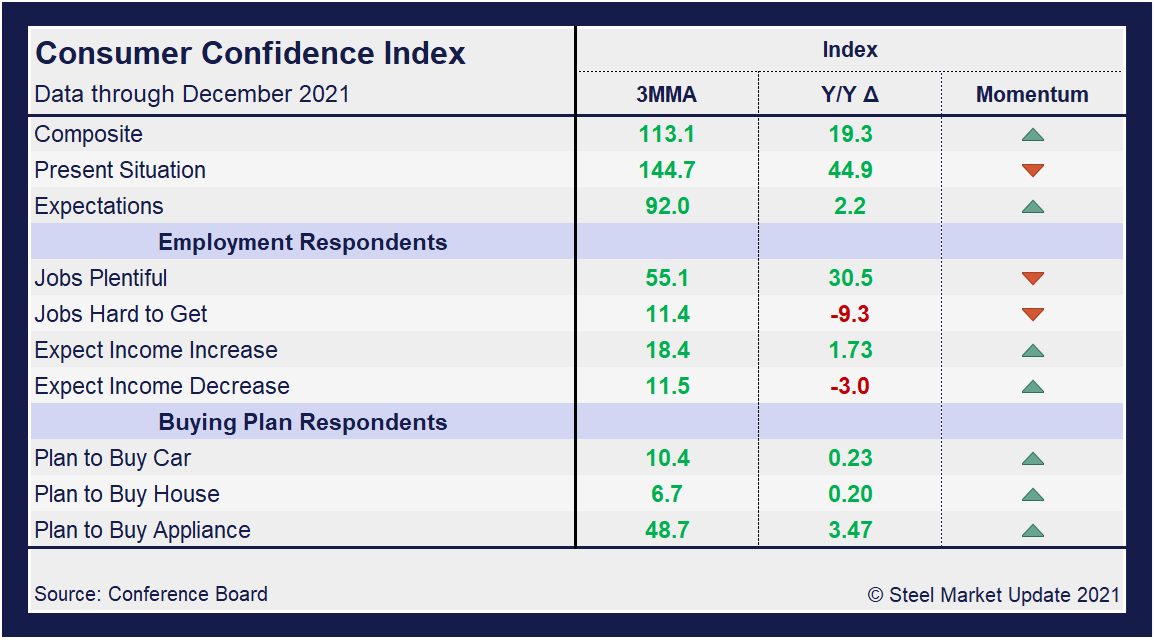
On a 3MMA basis comparing November 2021 with November 2020 in the table below, the present situation has an index reading of 144.1, a 2.1-point dip from the month prior but still 40.4 points above the year-ago reading. Expectations are at 87.8, down 1.7 from October, and 7.4 points below year-ago levels. Although two out of the three indexes show positive gains against year-ago measures when the first wave of COVID-19 hit, the momentum indicator is still moving down. November delivered another hit to sinking consumer confidence, a concerning mark ahead of the year-end holiday season.
When comparing current 3MMA totals to the 2019 pre-pandemic year, the composite is still down 16.1 points, while the present situation is down 26.1 points. The expectations reading is down 9.4 points in November when compared to the same 2019 period. The consumer confidence report also includes both employment data and some purchase plans and these are likewise summarized in the table below. The color codes show improvement or deterioration of the individual components.
The composite, present situation and expectations indices had been trending up, recovering much of what was lost in the fallout from the global pandemic, but momentum has shifted downward over the past four consecutive months.
The dip in November’s reading came amid concerns about rising prices and to a lesser degree lingering worries about the Delta variant, as the survey was completed Nov. 19. Buying plans for autos, homes and appliances were all down month on month and on a 3MMA basis, but uneven when compared to the same year-ago levels due to recent fluctuations. The only index showing some growth against year-ago levels was appliance buying, up 0.93 points.
The labor market landscape has shifted of late. Job openings continue to rise, but optimism regarding the prospect of increased wages has dipped when compared to the same year-ago period.
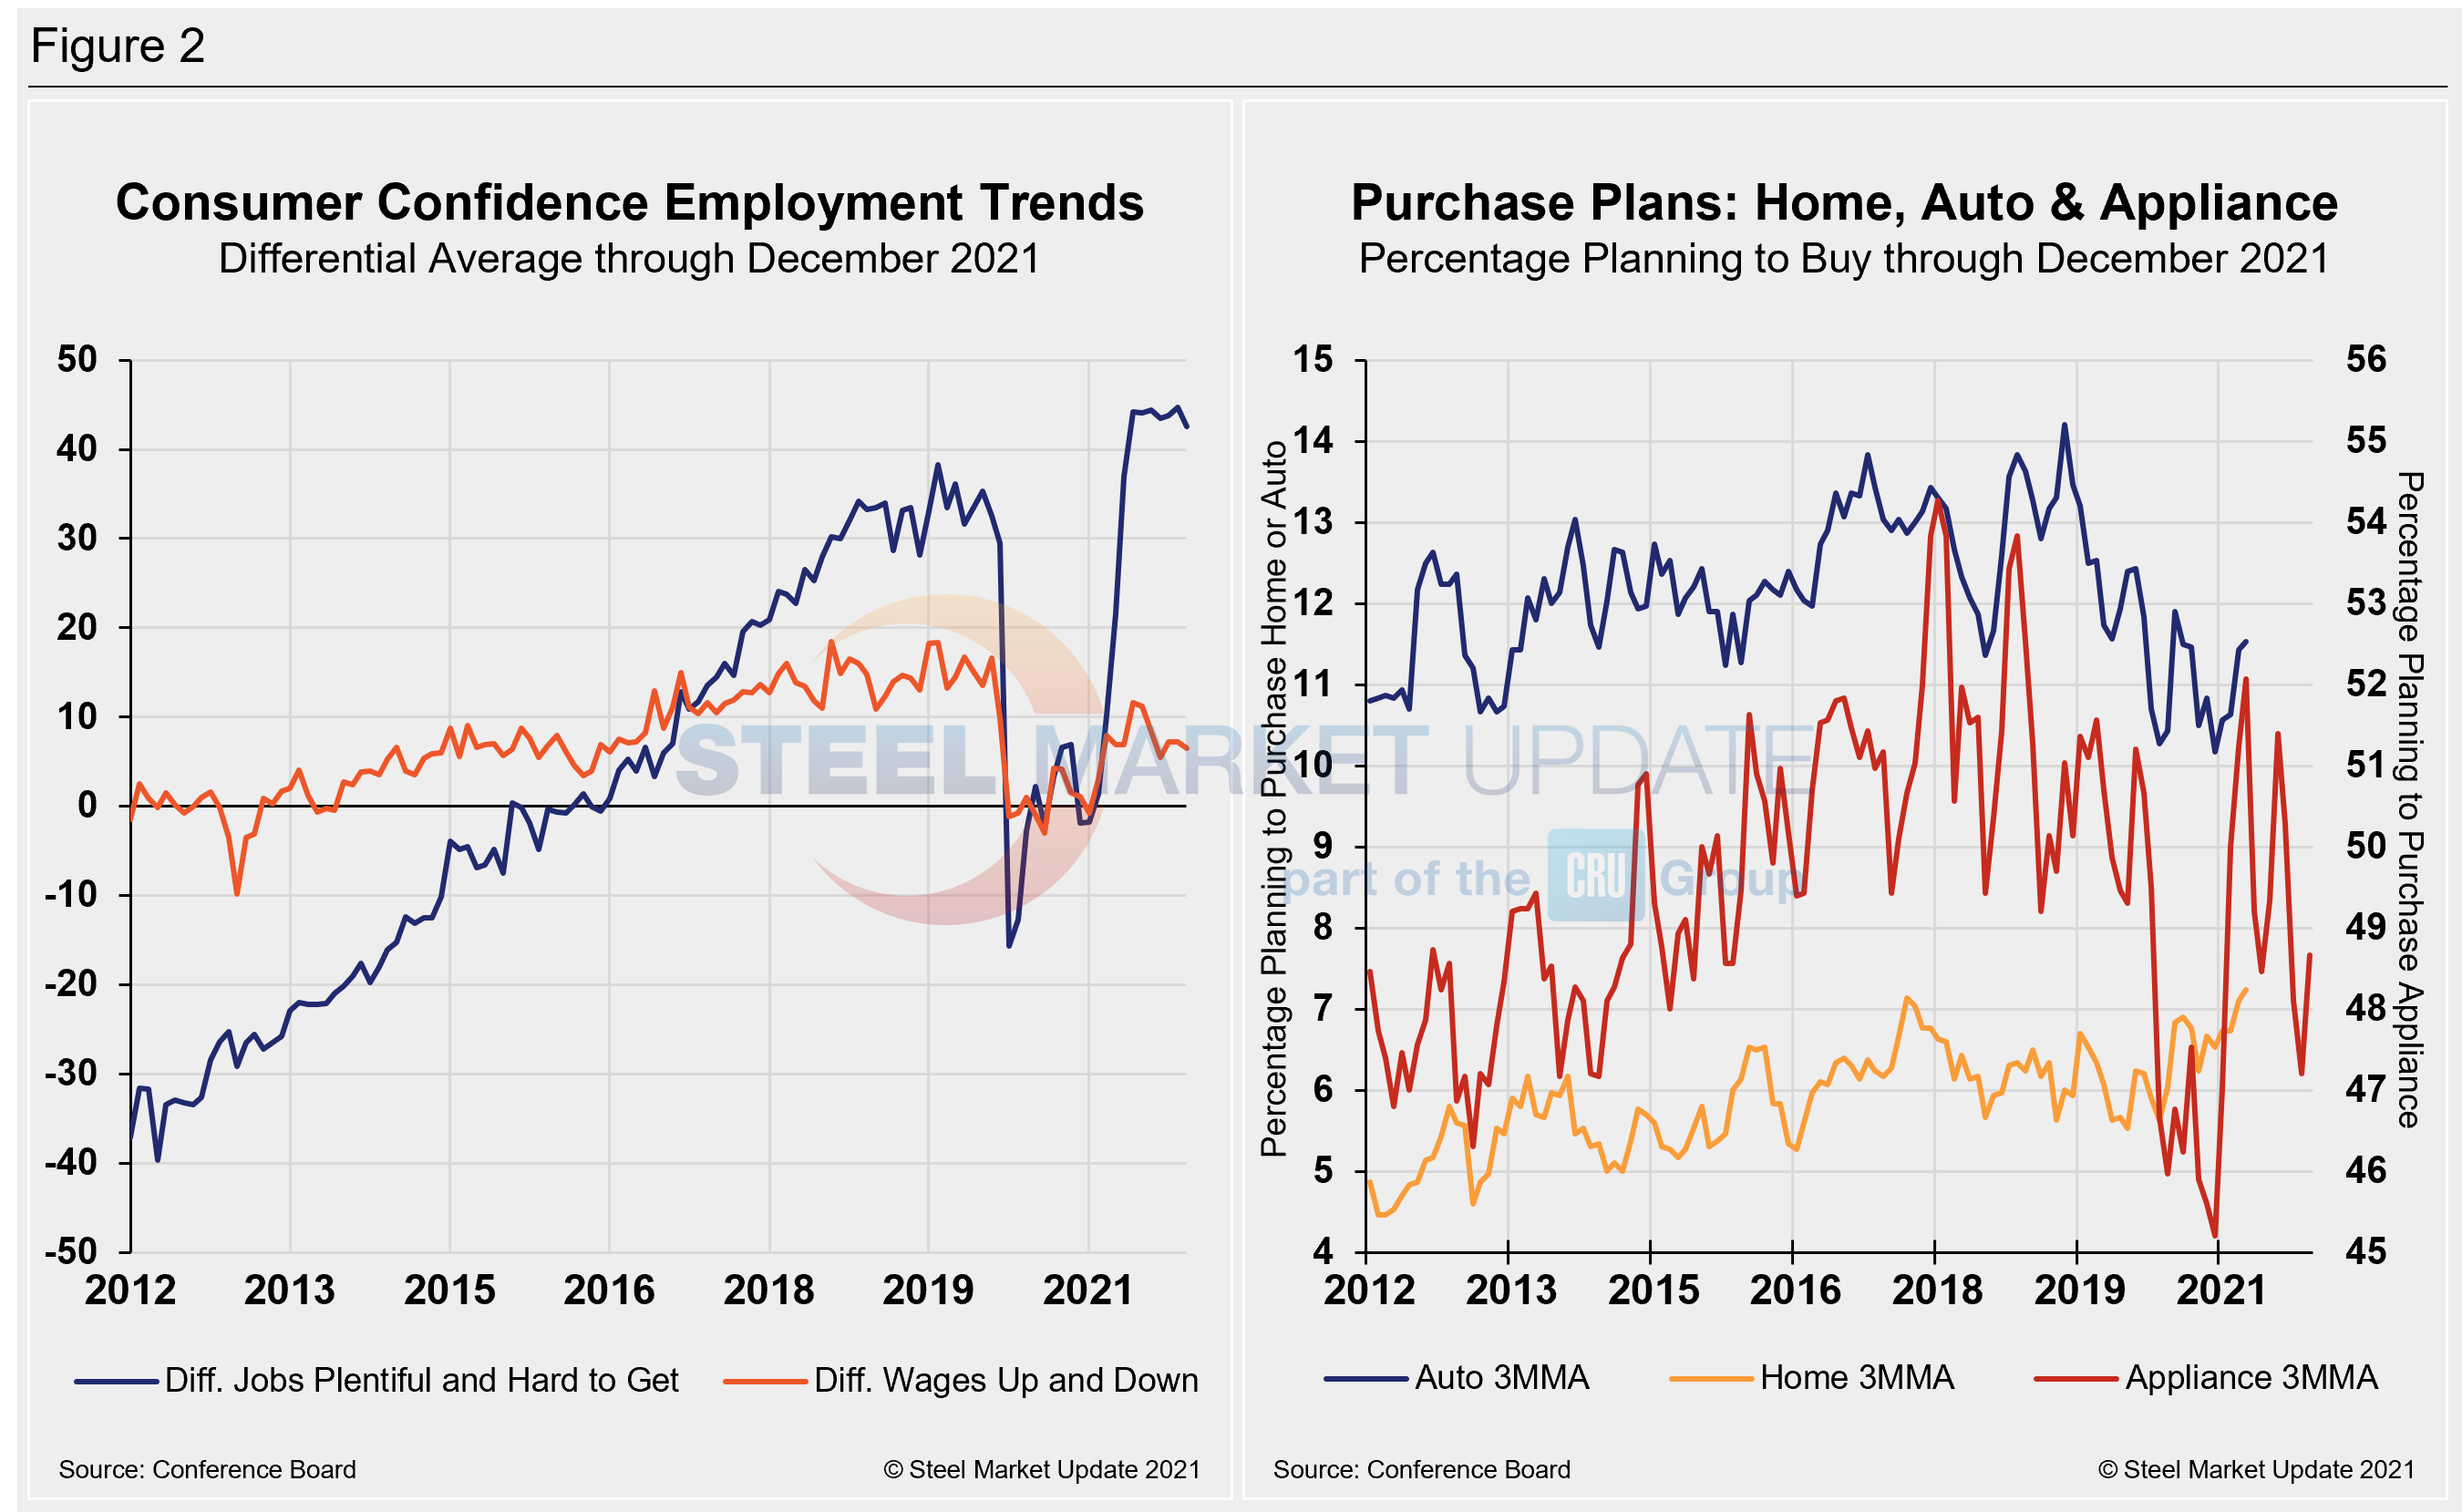
People found jobs slightly more plentiful in November but were a bit less optimistic about wage increases compared to the month prior. The differential between those finding jobs plentiful and those having difficulty was 44.9 in November, up from 43.8 in October. The measure has easily eclipsed the most recent pre-pandemic high of 35.3 in January 2020, and is a strong rally from the -1.8 seen at the beginning of the year. The differential between those expecting wages to rise versus those expecting wages to fall is presently 5.9, down 1.3 points month on month and down from the recent high of 11.6 in June.
Spending plans for consumer goods as measured by automobiles, homes and appliances had been trending up through June, but started slowing in July. Since then, figures have moved down in four out of the past five months, with consumer goods spending edging up slightly in October, but dipping back down in November. Automotive buying plans saw the strongest decline, down 2.5 points in November to a reading of 7.8. Home buying dipped 2.1 points to 4.8, the lowest pandemic-era reading, and the smallest reading since July 2016. Appliance buying also fell in November, down 1.6 points to 45.8 in November, the second-lowest reading of the year. These recent dynamics and historical movements are illustrated below in Figure 2.
About The Conference Board: The Conference Board is a global, independent business membership and research association working in the public interest. The monthly Consumer Confidence Survey®, based on a probability-design random sample, is conducted for The Conference Board by Nielsen. The index is based on 1985 = 100. The composite value of consumer confidence combines the view of the present situation and of expectations for the next six months.
By David Schollaert, David@SteelMarketUpdate.com


