

Plate

January 14, 2022
Imports' Share of U.S. Sheet and Plate Markets Up Again in November
Written by David Schollaert
Imports of less-expensive sheet and plate products continue to arrive on U.S. shores, a steady increase over the past seven months, driven by the need for buyers to find relief from inflated steel prices in the U.S. Although domestic steel prices have been declining, November Commerce Department data show imports’ shares of the U.S. flat products markets at their highest levels in the past 4-5 years and still trending up.
Imports’ share of total sheet product shipments into the U.S. was 21.5% in November, an increase from 19.0% the month prior. The gain was driven by a 3.9% decline in domestic shipments of sheet products, while foreign sheet grew by 11.8%, its highest mark in nearly seven years. Market share of plate product imports rose to 28.6% in November versus 27.6% the month prior, and the top mark in six years.
Imports’ share of domestic sheet product shipments hit its lowest level in more than a decade at 9.7% at the beginning of 2020. Since then, except for a slight contraction in April, sheet imports into the U.S. have risen continuously. November’s imports totaled 1.179 million tons, exceeding the 1-million-ton mark for the third straight month and nearing the 1.2 million-ton high since January 2015.
Overall sheet product shipments (domestic shipments plus imports) were down 0.9% in November versus October, totaling 5.493 million tons and driven by a decrease of 175,354 tons of domestic shipments. Hot rolled coil (HRC) imports totaled 445,181 tons in November, down 6.8% versus the month prior, and pushing import market share down fractionally to 20.3%. These details are shown below in Figure 1.
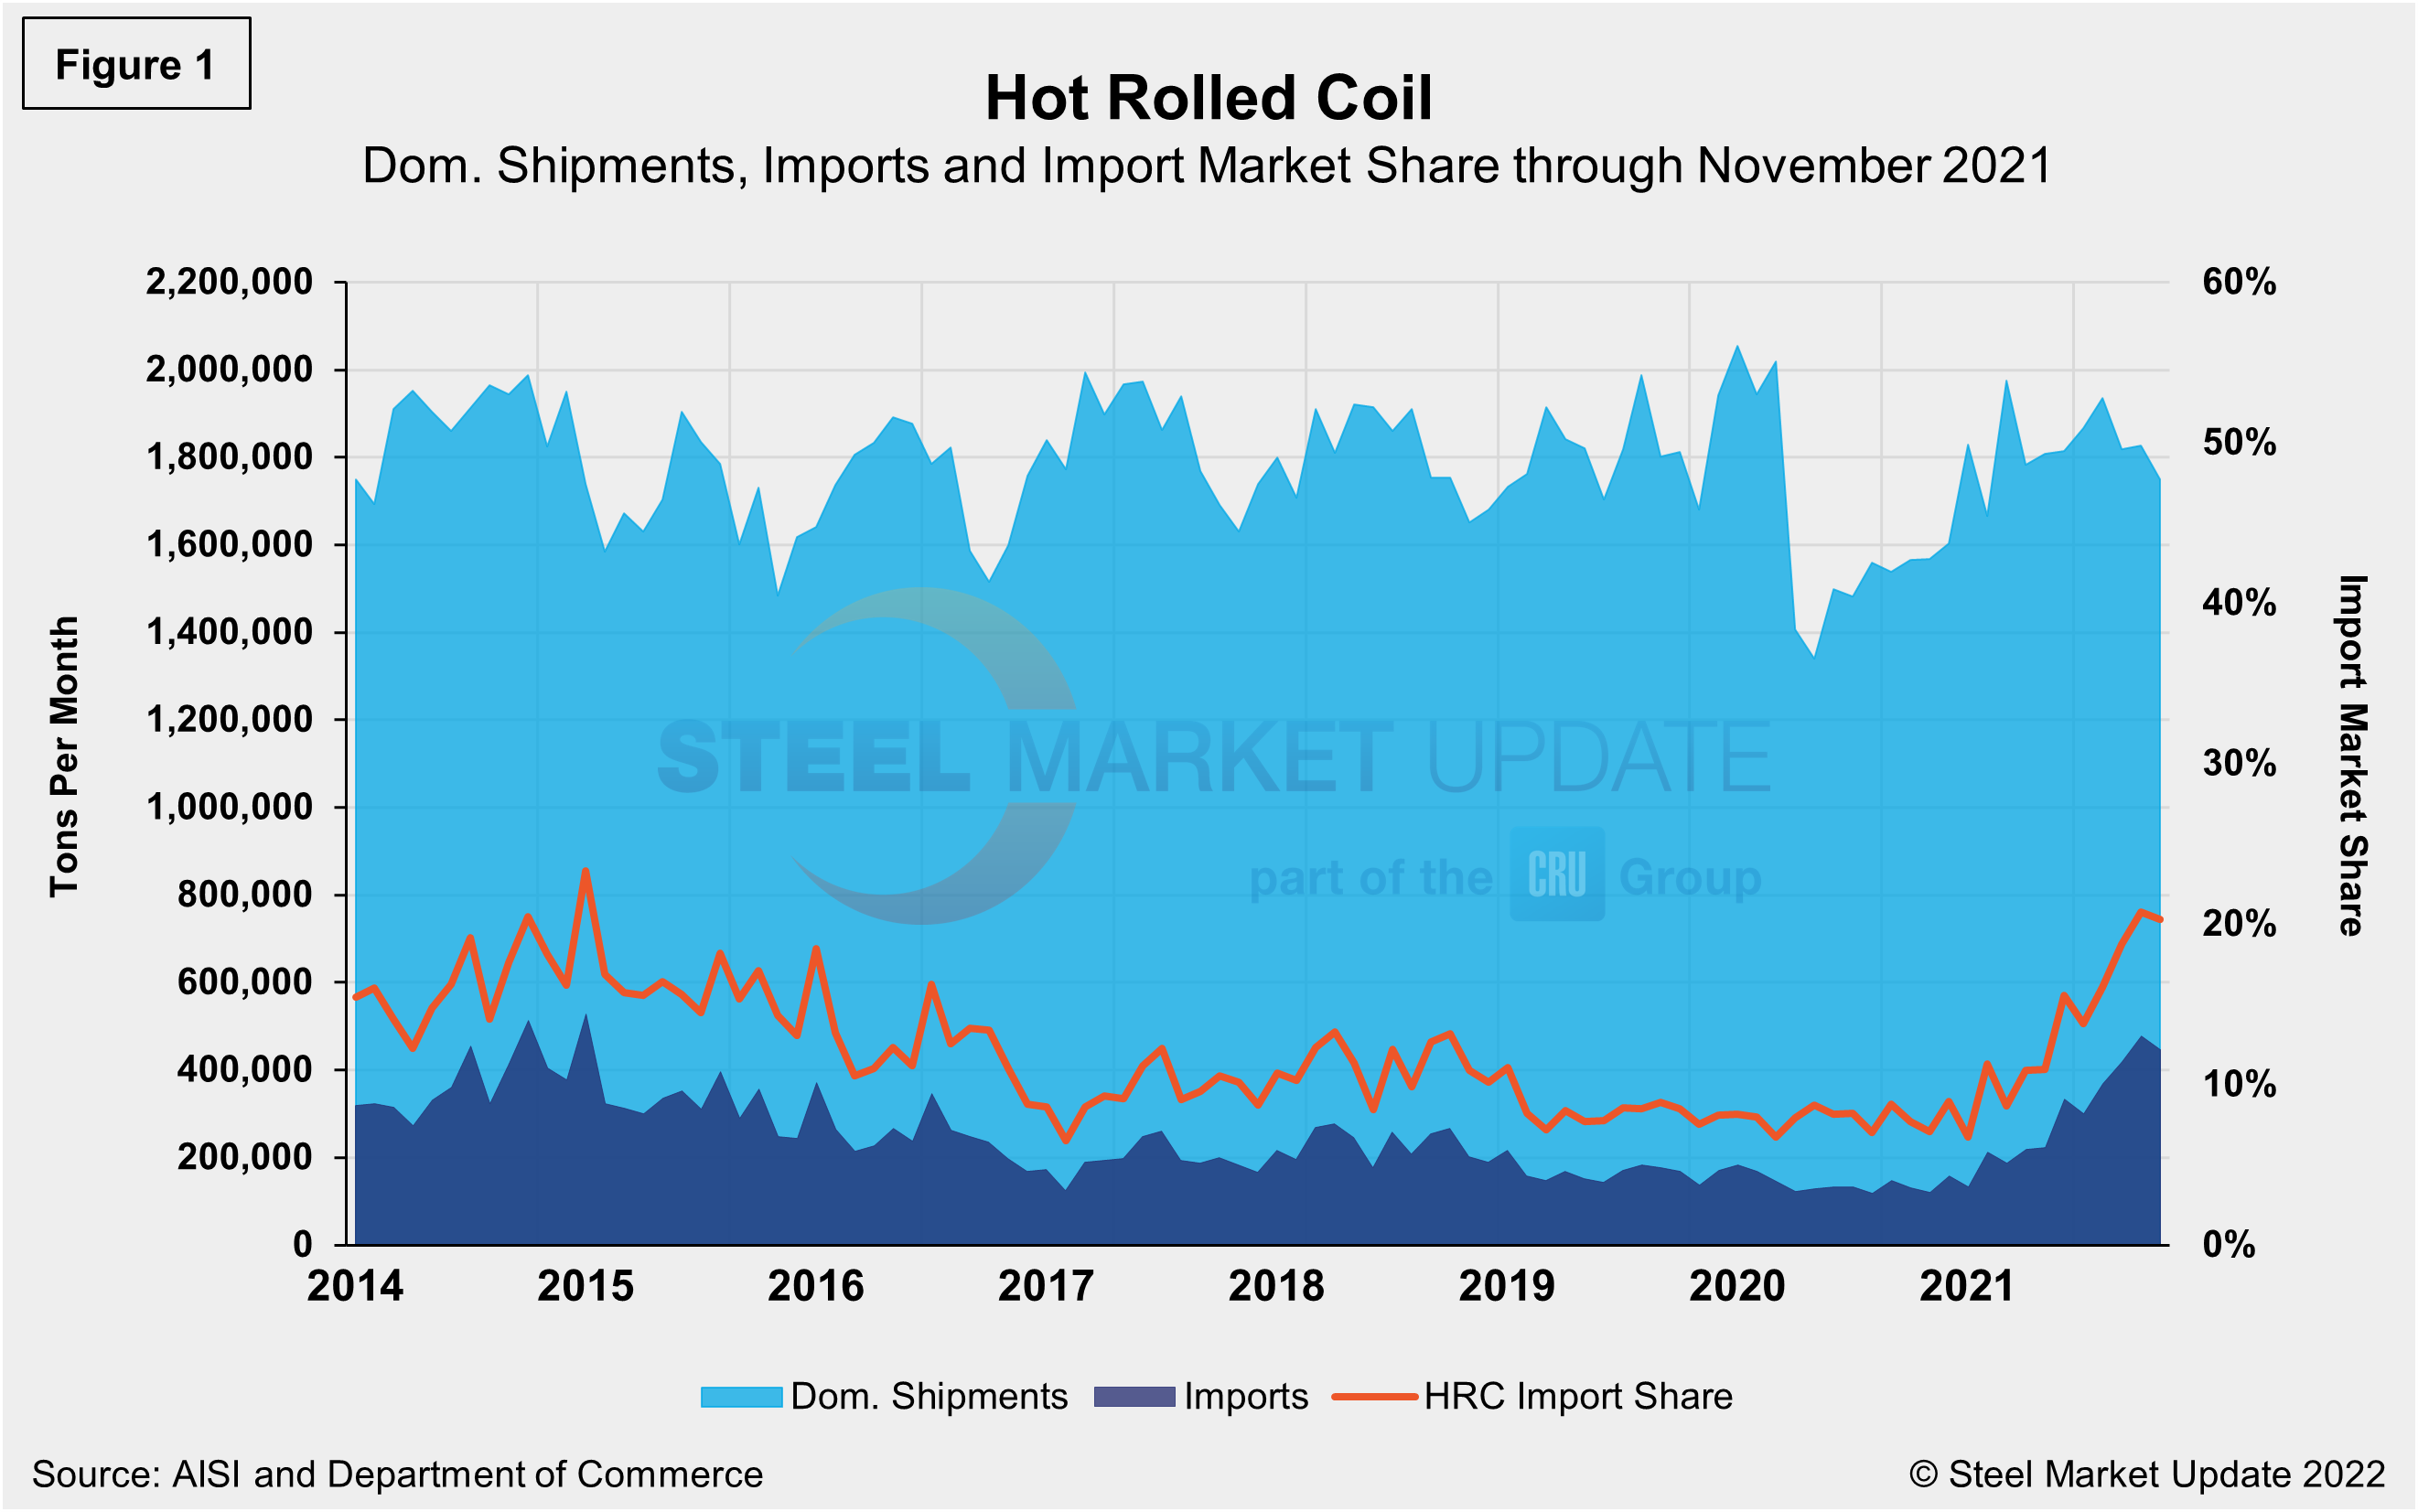
Plate products in November saw an overall decrease in shipments as apparent supply slipped by 3.5% month on month. The loss was driven by a decline of 4.8% in domestic plate shipments, while imported plate products saw a small decline from the prior month. November plate imports of 220,778 tons represented the highest monthly total year-to-date and the strongest since May 2018. All told, total plate shipments downstream, including foreign and domestic, were 772,441 tons in November, down from 800,103 tons the month prior.
The import share of HRC rose 0.4 percentage points to 20.3% in November, still the second highest mark since January 2015. The fractional dip in share was driven by a 4.2% decrease in domestic shipments, while imports fell by 6.8% month on month. HRC imports totaled 445,181 tons, the second highest in nearly seven years and nearly doubling in just a matter of three months.
Imports of cold rolled coil (CRC) and other metallic coat (OMC) were both up in November after slipping in October. Market share of foreign CRC and OMC both grew to 18.7% and 28.7%, respectively. Galvanized (hot dipped and electrolytic) imports jumped 26.5% in November to 318,972 tons or a 19.0% market share. The figure is a 3.7 percentage point increase month on month from 15.3% in October.
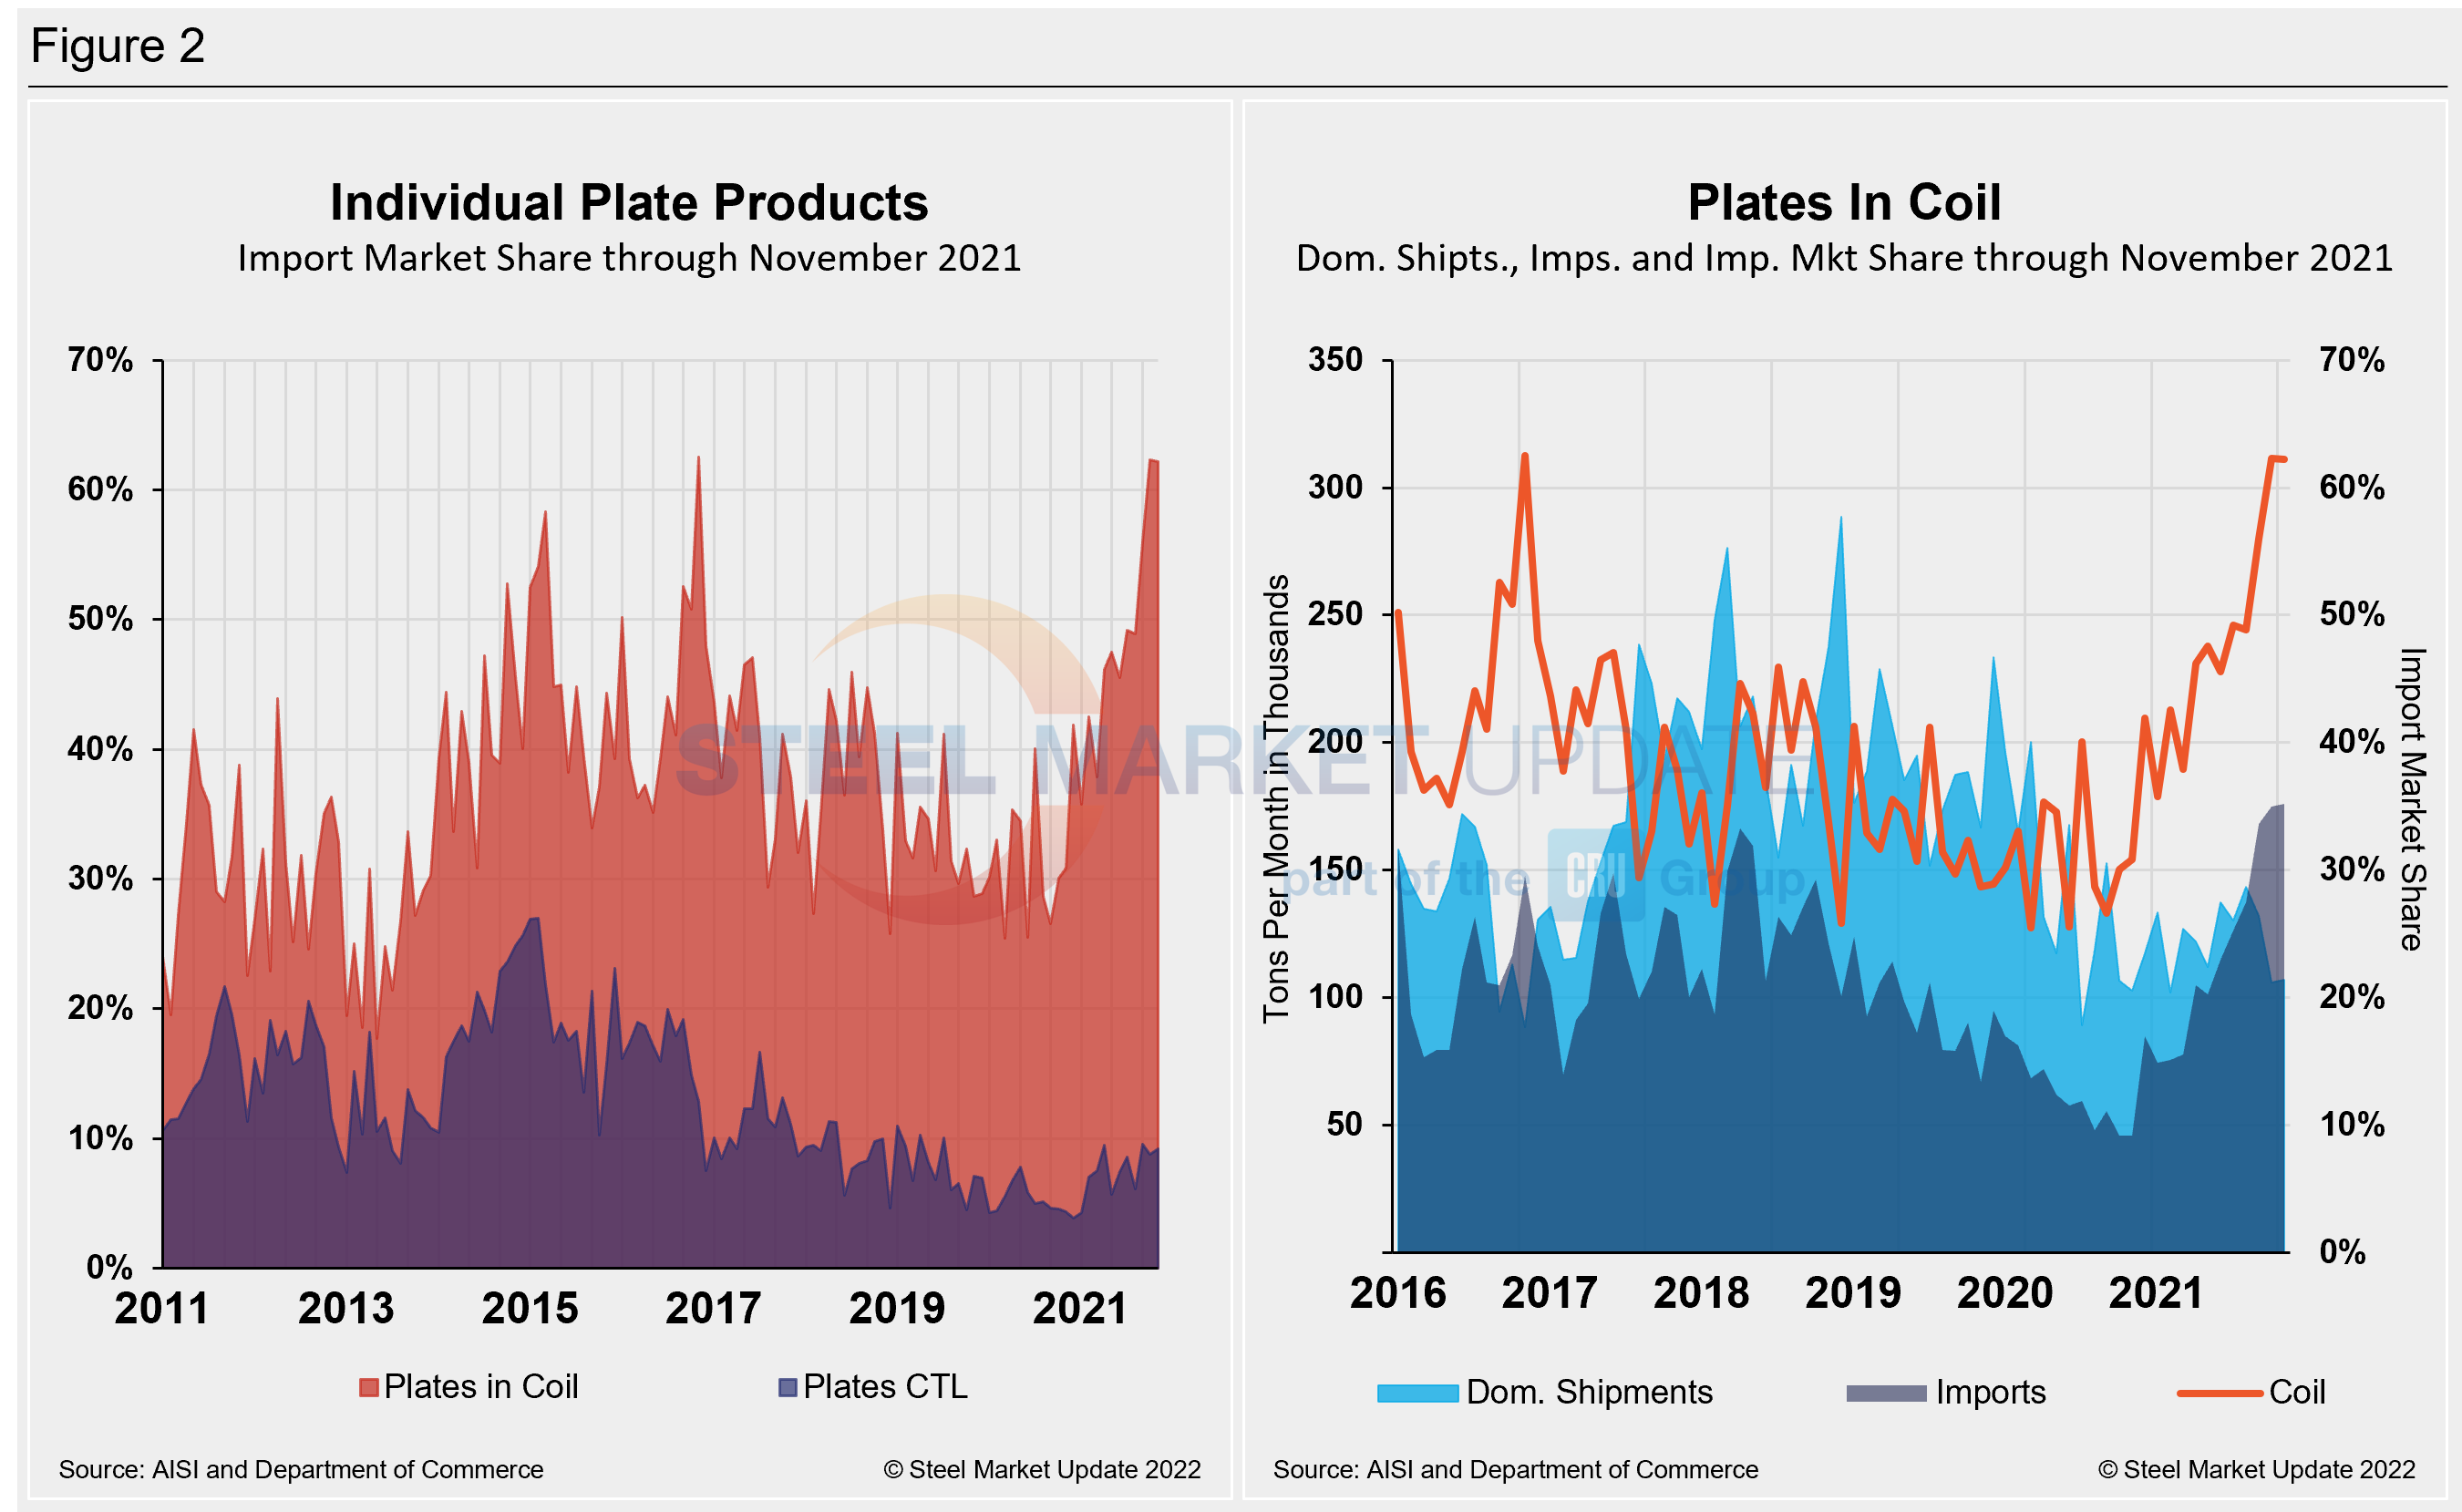
The import market share for plates in coil edged down fractionally to 62.2% in November, a 0.1 percentage point slip month on month. The decrease was driven by a 1.0% increase in domestic shipments, while imports increased by just 0.5% month on month. Total imports of plates in coil were 175,817 tons in November, the highest since July 2015. The slight increases in both U.S. mill shipments and imports of plate in coil brought total supply up marginally by 0.7% month on month to 282,731 tons, the second best total year-to-date and over the past two years.
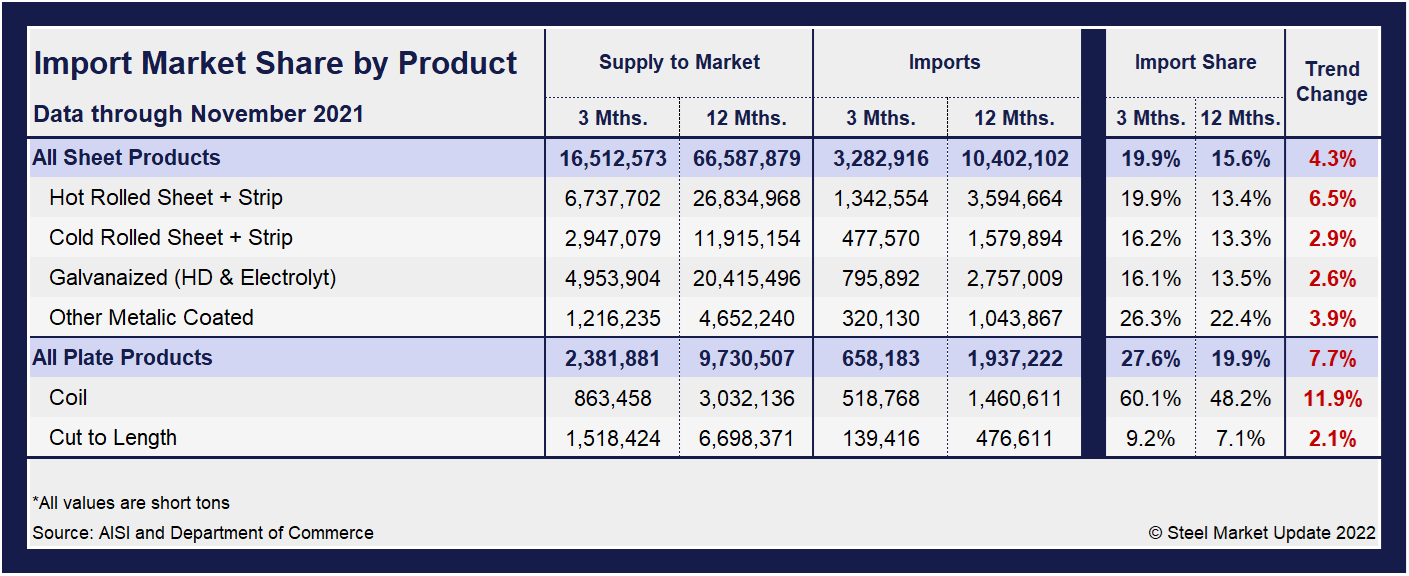
The table below displays total supply to the market in three months and 12 months through November 2021 for sheet and plate products and six subcategories. Supply to the market is the total of domestic mill shipments plus imports. It shows imports on the same three- and 12-month basis and then calculates import market share for the two time periods for six products. Finally, it subtracts the 12-month share from the three-month share and color codes the result green or red according to gains or losses. If the result of the subtraction is positive, it means that import share is increasing and the code is red.
The big picture is that imports’ share of U.S. sheet and plate sales continues to rise month after month, in some cases just under all-time highs. The big second-half jump in total imports is the result of historically and disproportionately high domestic steel prices. December preliminary license data already suggests that total import numbers will be even higher. Although U.S. domestic steel prices have been eroding, they remain at a premium to foreign material, thus the trend is likely to continue for the time being.
Hot rolled and cold rolled sheet and strip have seen a trend shift along with plate products, illustrating how import competition is rising versus domestic products in three months compared to 12 months. Most notable of those subcategories are plates in coil (up 11.9%) and hot rolled coil (up 6.5%) through November 2021.
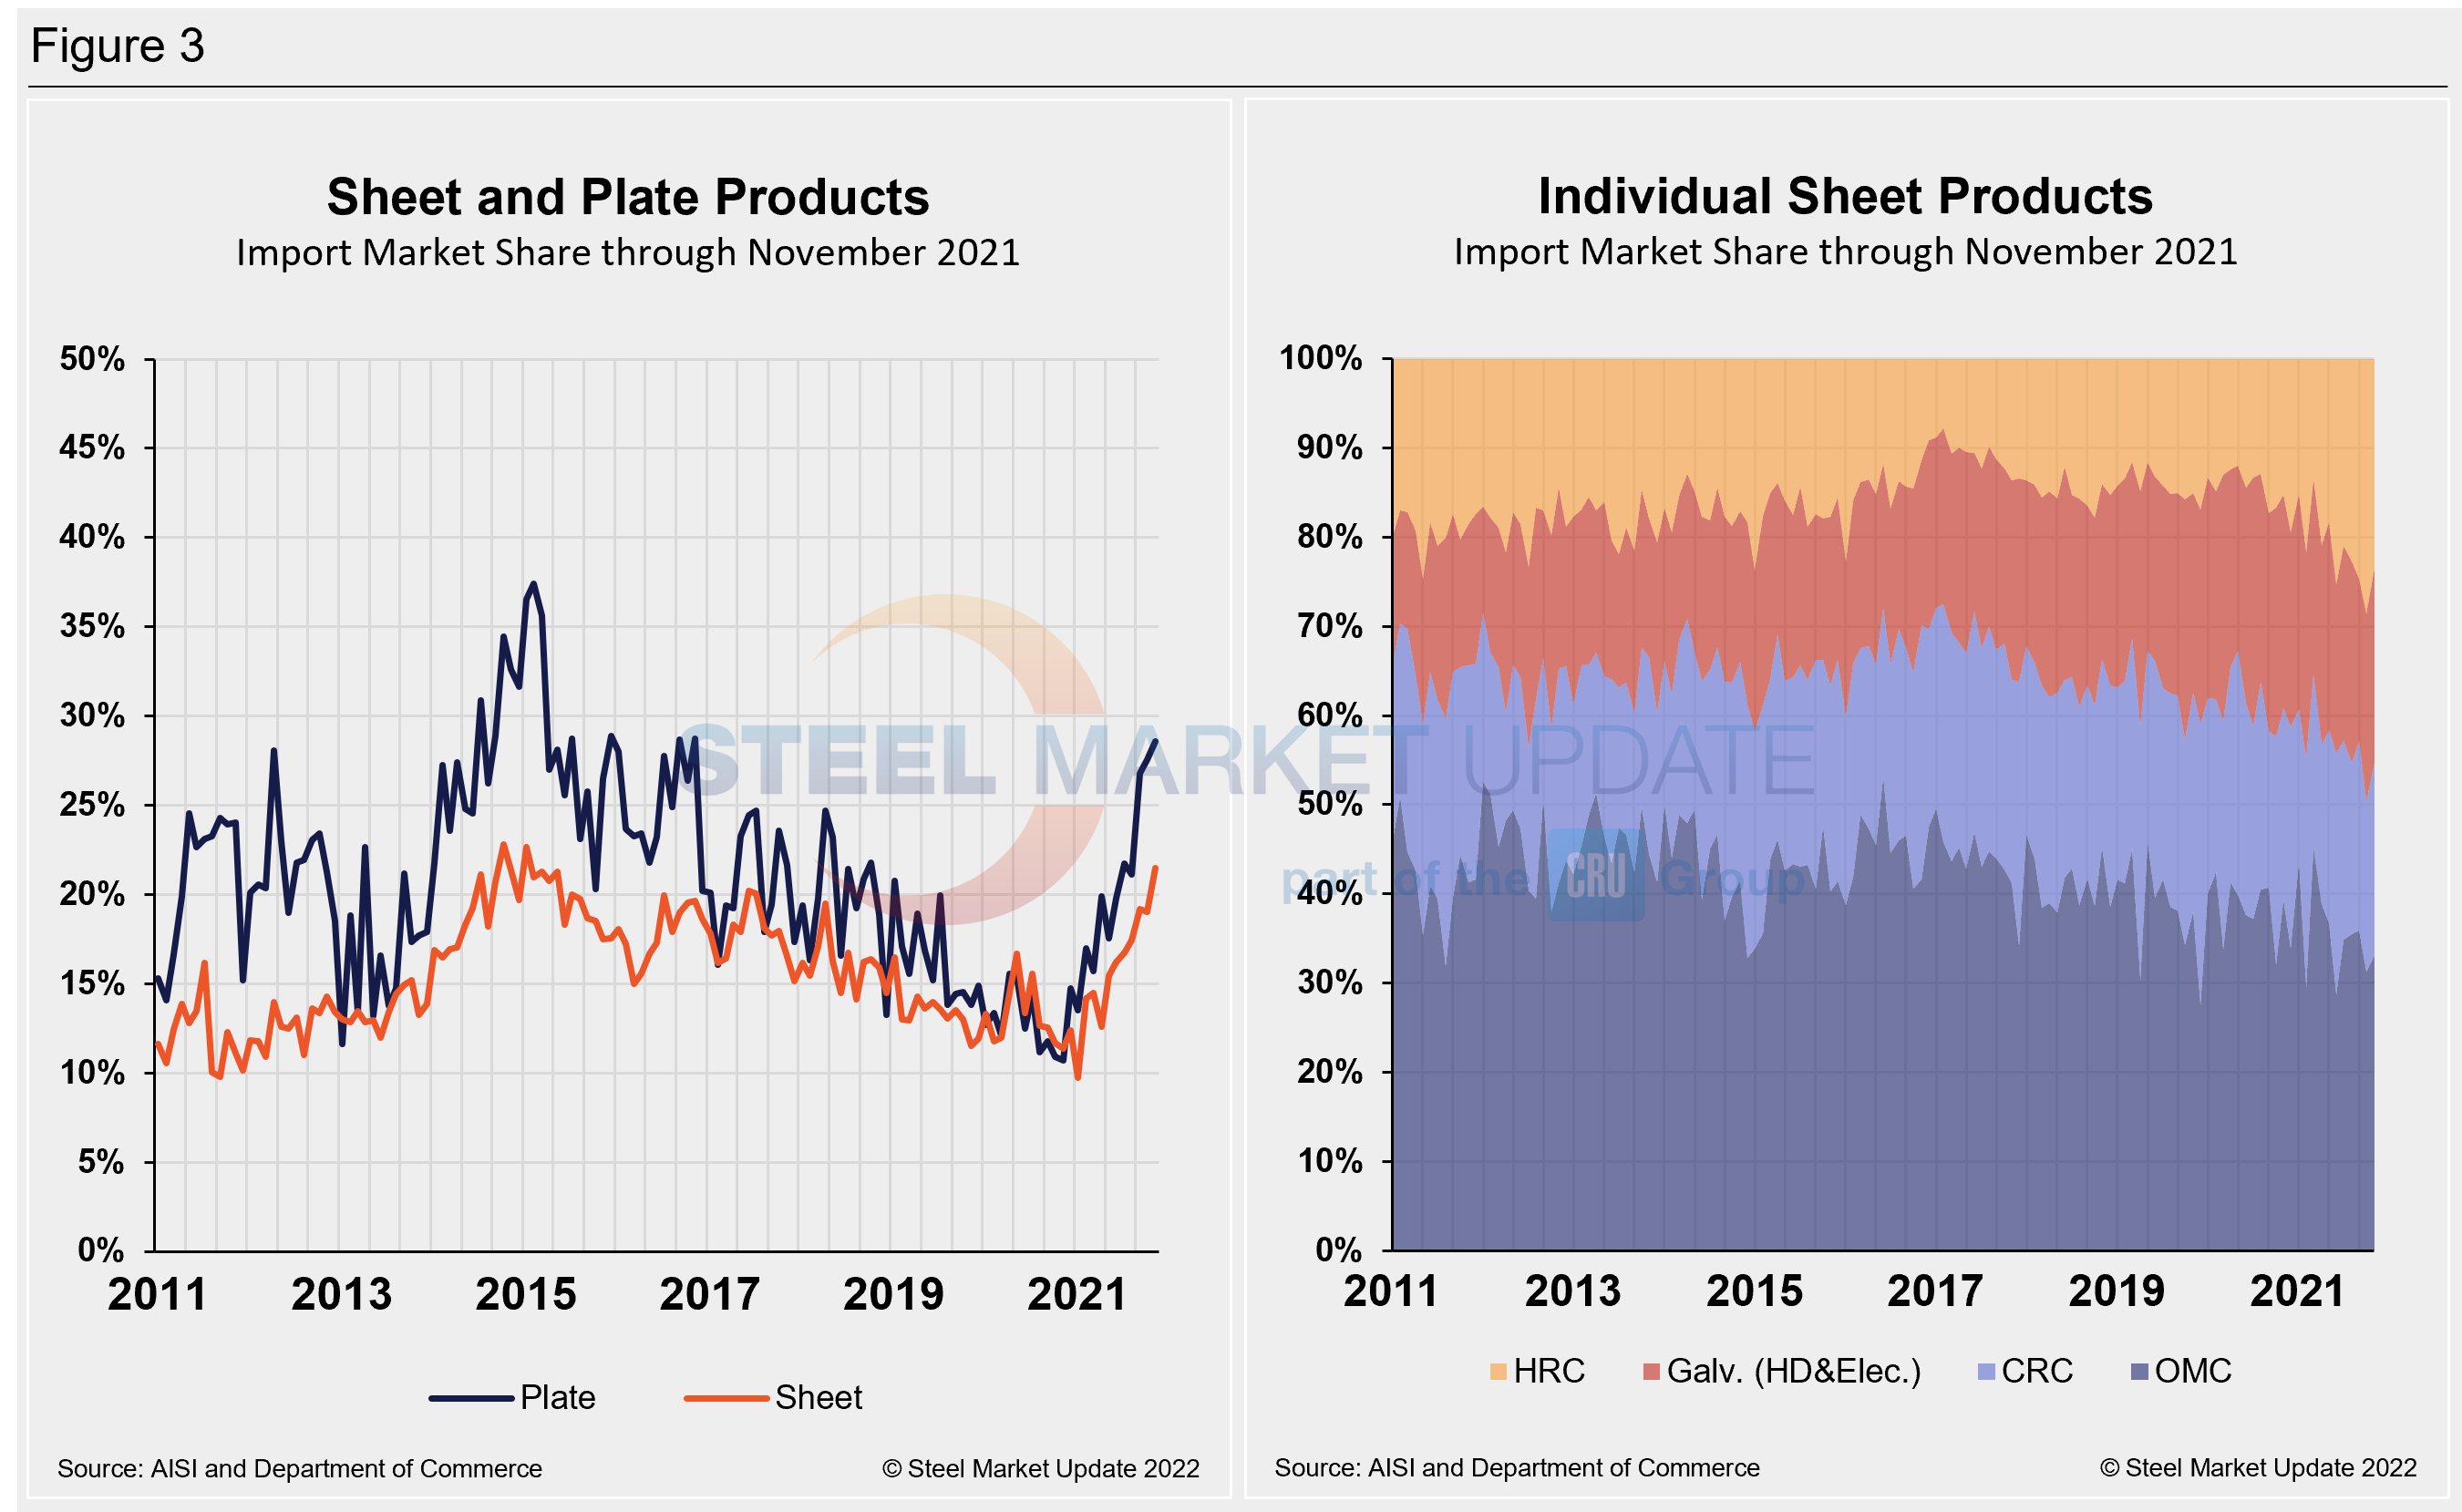
The import market share of individual plate products as well as a breakdown of the market share for plates in coil are displayed together in Figure 2. The historical import market share of plate and sheet products and the import market share of the four major sheet products are shown side-by-side in Figure 3. The import share of plate had been decreasing erratically over the past six years, but has trended up this year and is back to pre-pandemic levels, hovering just below 30.0%. Sheet product imports’ share had also trended down over the past several years, but has gained ground since the beginning of the year despite a steady rise in domestic shipments. The import market share of plates in coil is now higher than domestic shipments at 62.2%, and holding strong since the beginning of the year.
By David Schollaert, David@SteelMarketUpdate.com


