

Market Data

January 17, 2022
SMU Key Market Indicators Remain Uncertain
Written by David Schollaert
Monthly Key Market Indicators continued their shift to a neutral position throughout December, according to the latest analysis by Steel Market Update. Positive indicators held for the first time in seven months, while negative indicators eased. Ongoing economic dynamics such as an underperforming job market, supply-chain bottlenecks, rising inflation and producer prices, as well as a global pandemic that seems unwilling to retreat, have pushed indicators further towards a more neutral or watchful market.
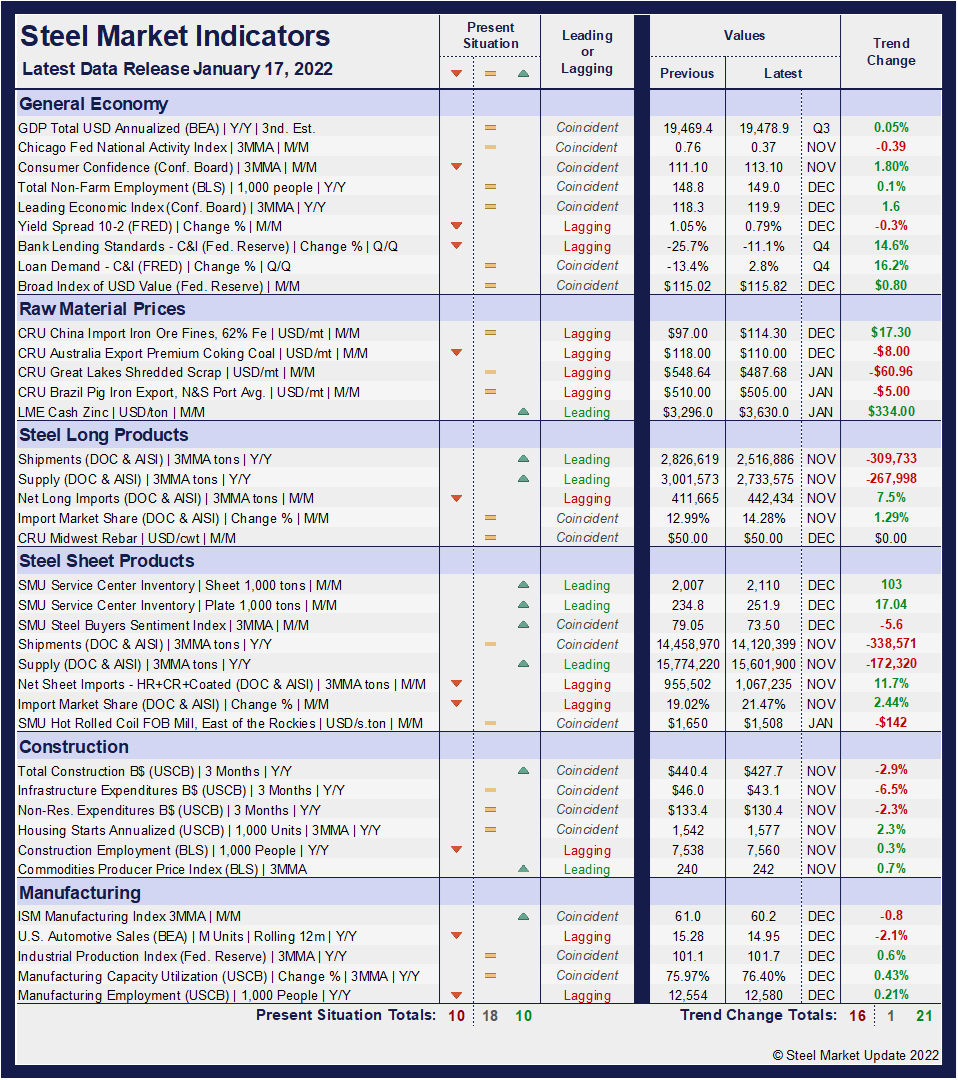
SMU’s Key Market Indicators include a host of data on the economy, raw materials, manufacturing, construction, and steel sheet and long products, offering a snapshot of current sentiment and the near-term expected trajectory of the economy. Markers for the Present Situation were sideways for the first time since June, while Trends markers slipped further versus the prior month.
In the latest data, 10 of the 38 Present Situation indicators are positive, flat month on month, while the neutral position expanded by two points to a reading of 18 in December from 16 the month prior. The negative indicators eased by two points in December versus November’s reading, slipping to 10.
Negative indicators trended down consecutively from February through May reaching as low as three. However, since expanding by four points from August to November, December’s erosion, and shift towards neutral highlight the lack of clarity in the market. At its worst, 18 of the 38 indicators shifted negative last year as the economy was decimated by the pandemic-driven closures. Although present results have improved during the pandemic-era, gains have decelerated in the final quarter of the year.
SMU’s Present Situation and Trends analyses in the table below are based on the latest available data as of Jan. 17, 2022. Readers should regard the color codes in the “Present Situation” column as a visual summary of the current market condition. The “Trend” columns are also color coded to give a quick visual appreciation of the market’s direction. All data included in this table was released within the past month. The month or specific date to which the data refers is shown in the second column from the far right. Click to expand the table below.
Present Situation
SMU’s Present Situation indicators below highlight the upward trajectory of the domestic market. Although not smooth, the recovery has been remarkable. Since June, however, momentum has faded as the economy seems unable to find its footing. The direction was up and gaining ground through the first half of 2021, but has since eroded repeatedly, leading to a more uncertain and watchful trend. Positive indicators rose from 11 to 20 through June, but are now down at 10, their lowest mark since September 2020 when the reading was 9. Negative indicators had grown four out of the past five months through November but slipped in December. The more telling trend may be the growth in the neutral indicators, presently up at 18, its highest mark all year after holding at 14 for three straight months following a four-point expansion in August. The trend suggests the market’s direction is uncertain but maybe not as unstable as expected.
Supply shortages continue, particularly in the consumer goods, auto and construction sectors. The latest government data shows that U.S. retailers are facing roughly 12% out-of-stock levels on food, beverages, household cleaning, and personal hygiene products. The effects of rising producer prices and an underperforming employment sector are compounded by rising interest rates, expanding inflation, and a surge in cases of Omicron.
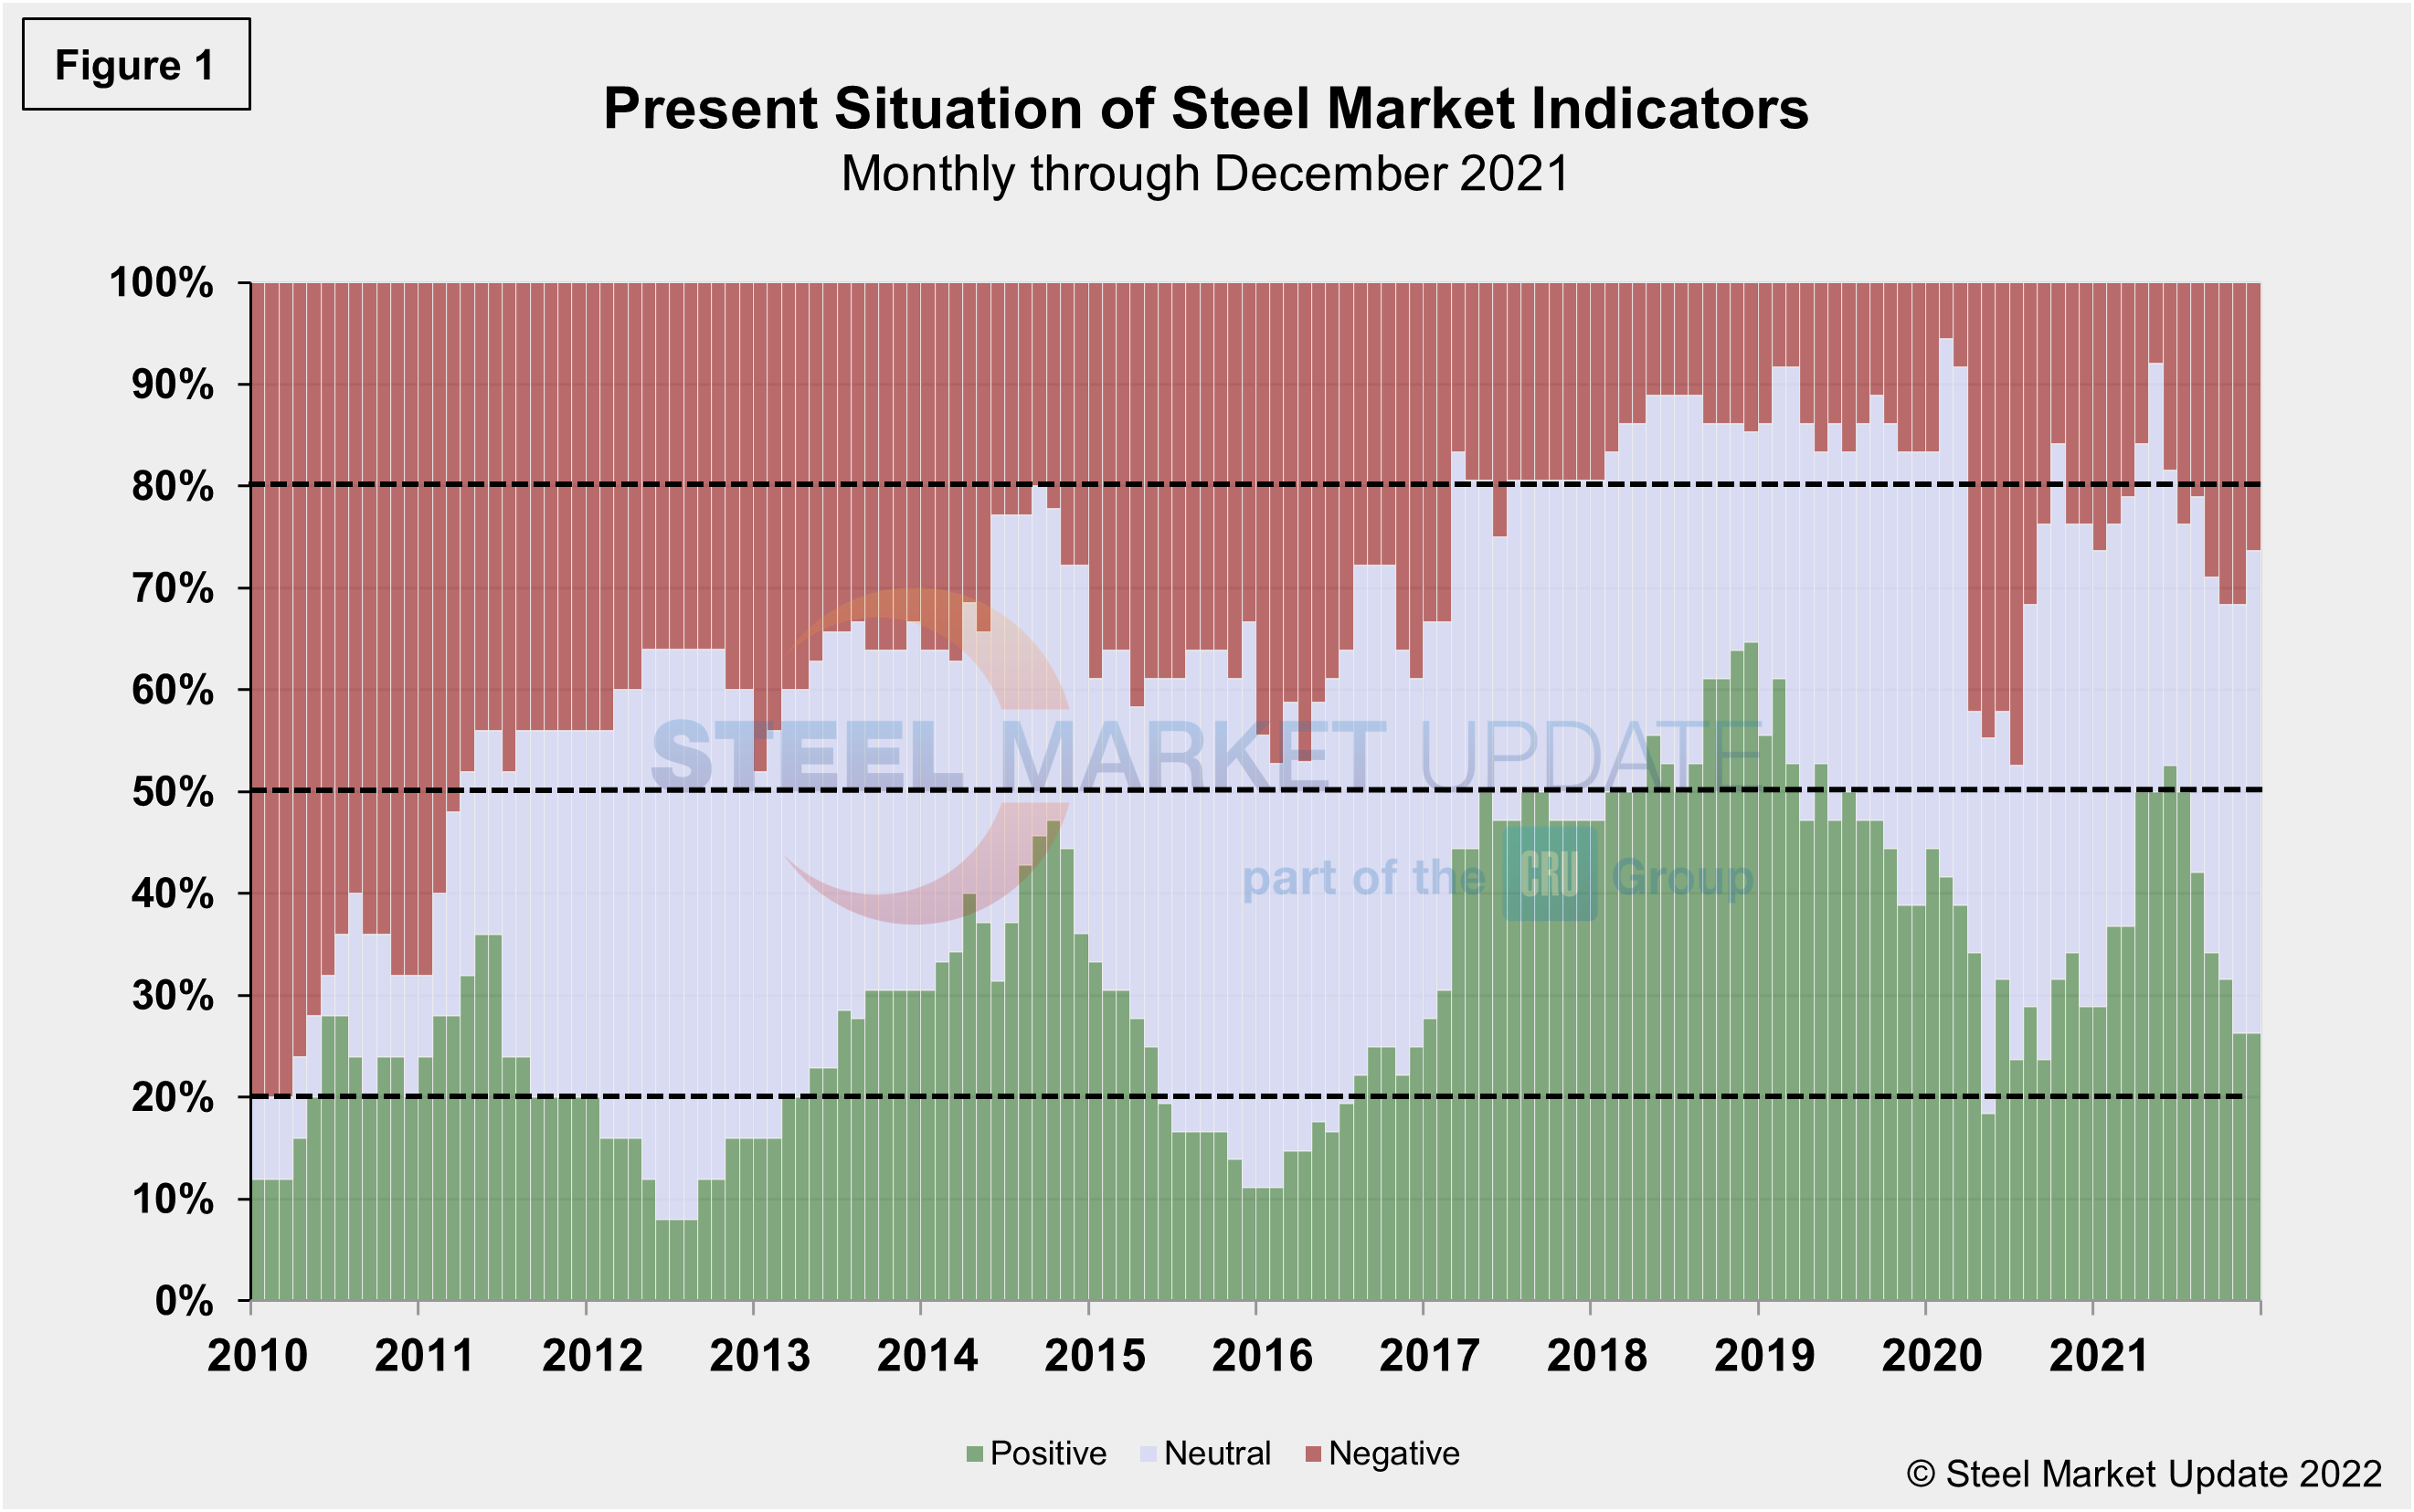
Present results have continued to reveal a more apprehensive marketplace compared to last month’s data due to the lack of change in positive totals and the continued expansion of the neutral figures. Presently, 47.4% of the marketplace is neutral or unclear, a 5.3 percentage point increase and highest total for 2021, and just two points away from its all-time high seen in September of 2020.
Through December, 26.3% of the marketplace is positive, flat versus the month prior, but down from a high of 52.6% in June. Presently, 26.3% of the market is negative, a 5.3 percentage point decline from November. With the expanded neutral indicator, now 73.7% of the population sees the marketplace as neutral-to-positive, according to SMU’s assessment of key market indicators, a slight increase from one month ago.
Our monthly assessment of the Present Situation since January 2010 on a percentage basis is shown in Figure 1.
Trends
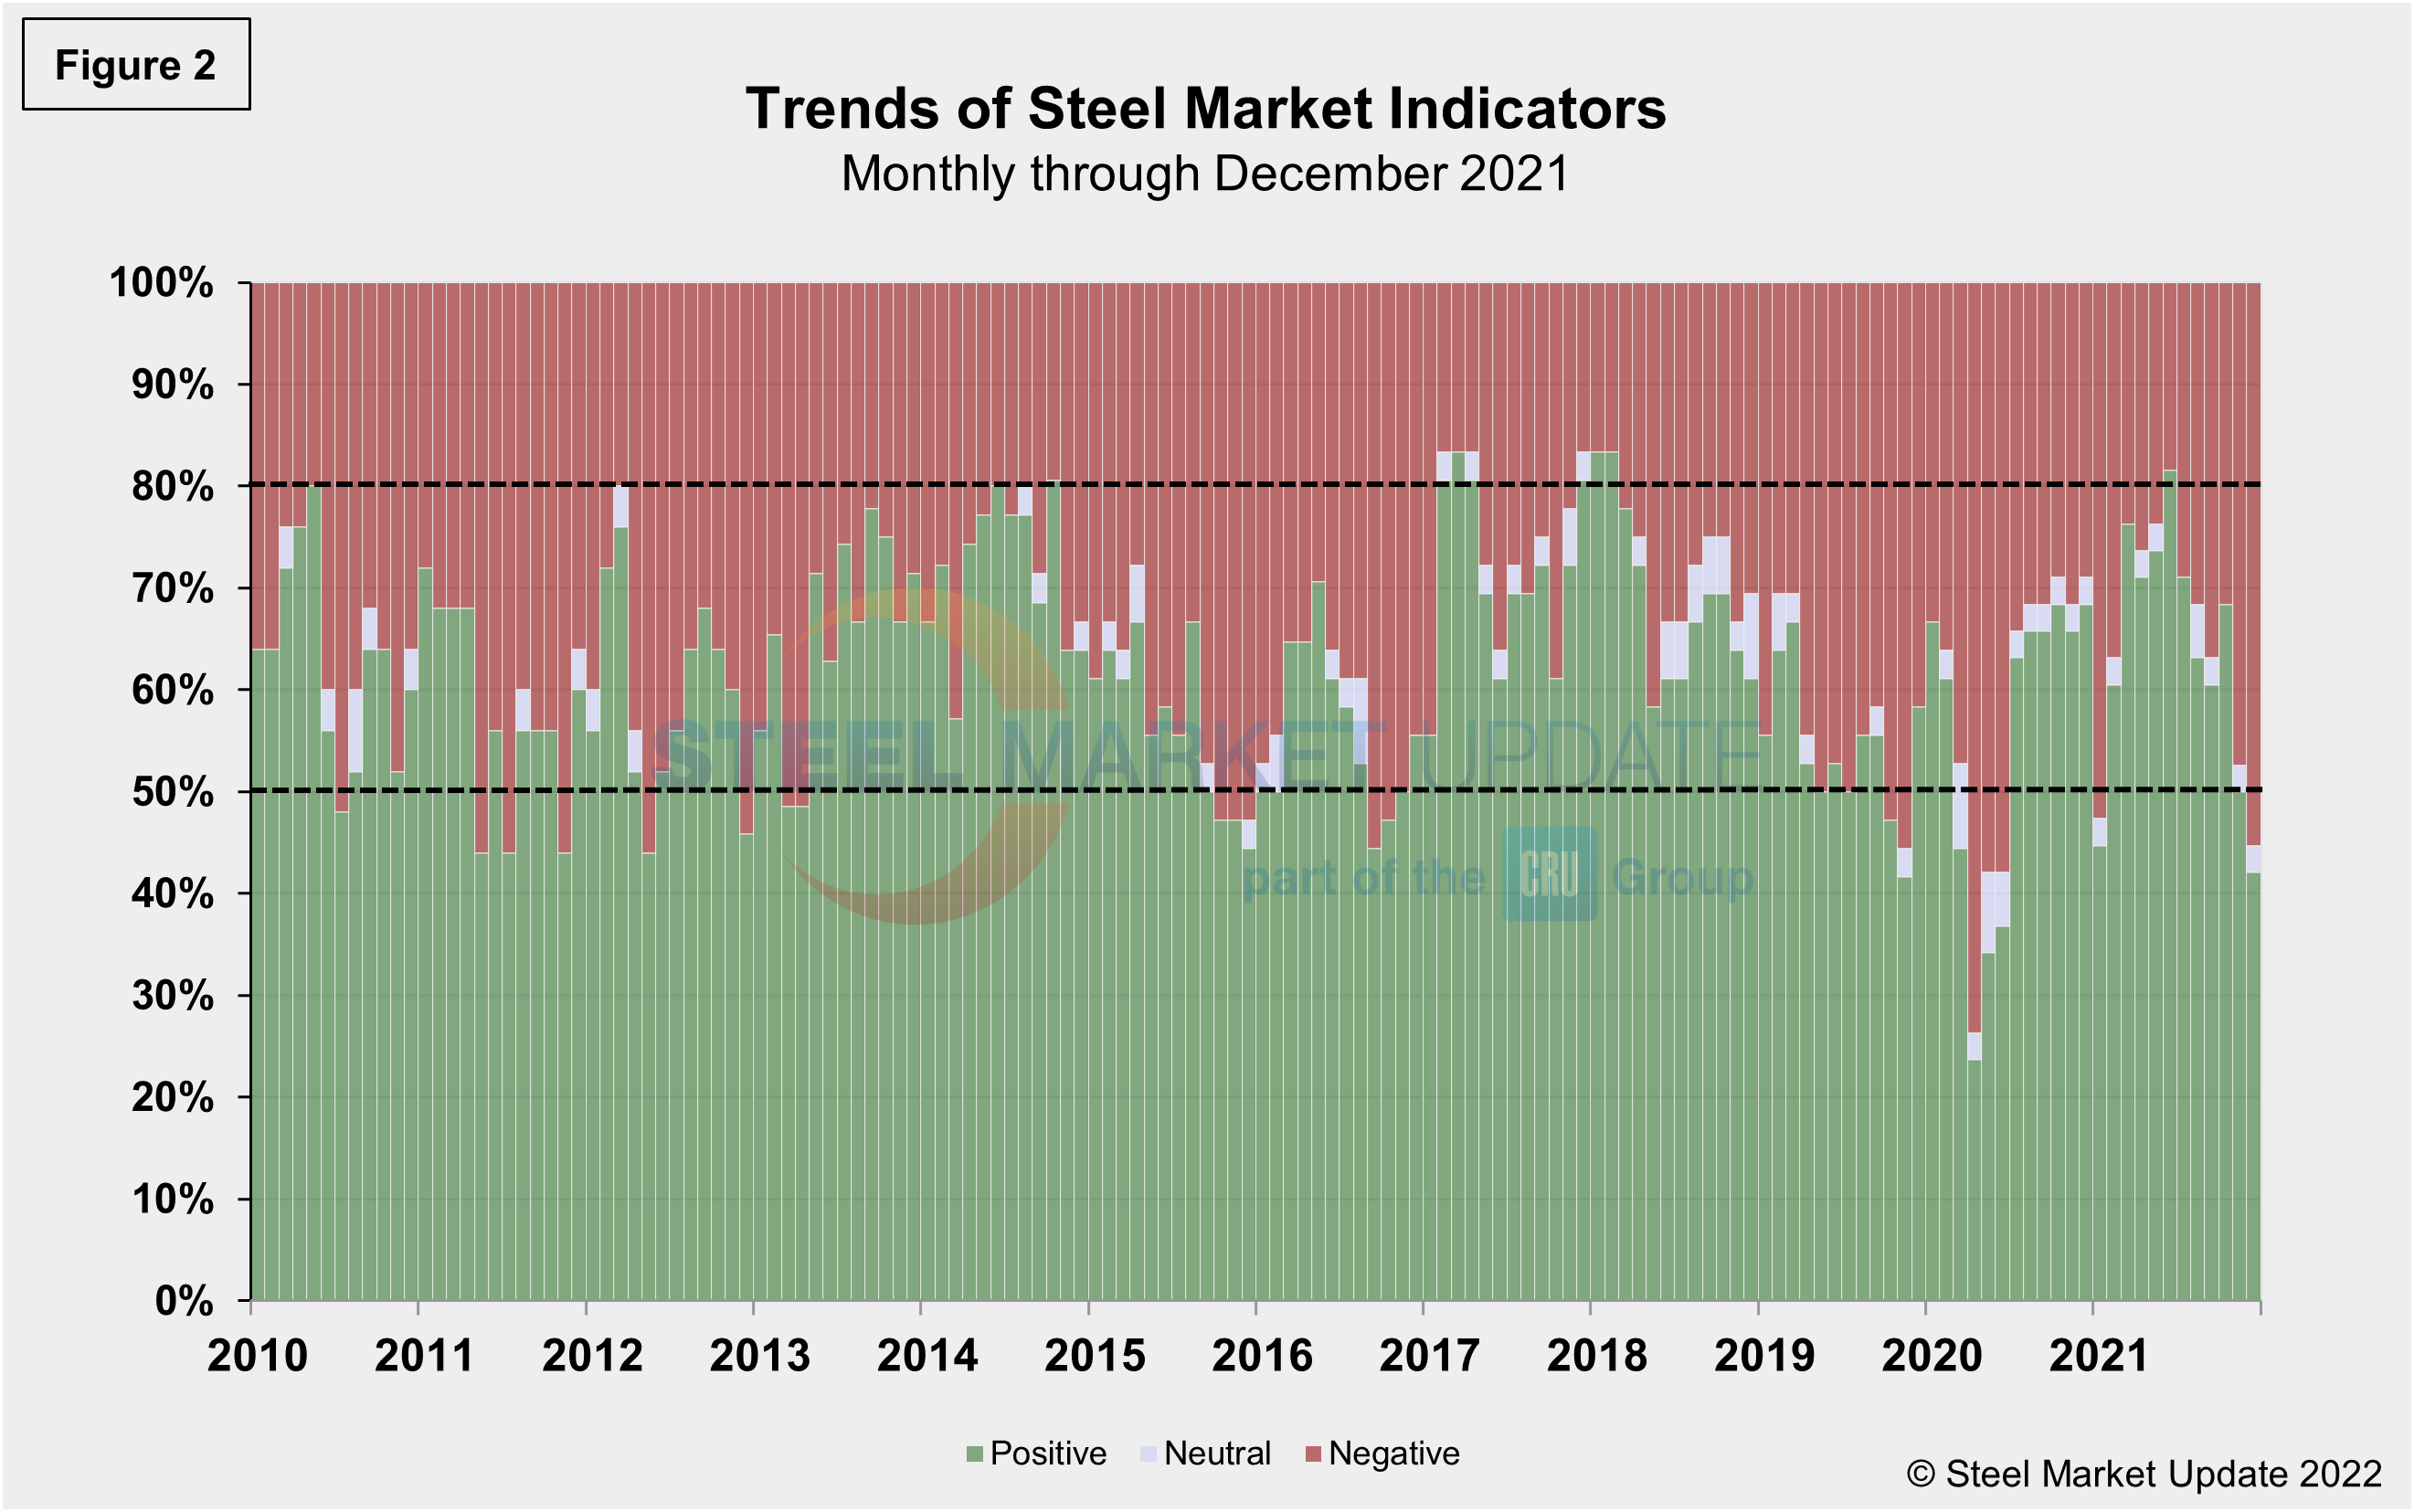
SMU’s Trends indicators fell further in December, a move more reflective of the market’s Present Situation and potentially bringing down the market outlook as 2022 tries to take shape. It is important to note that most values in the Trends columns are three-month moving averages (3MMA) to smooth erratic monthly data. Note that in many cases this is not December or January data, but data that was released in December and/or January for previous months. Compared to month-ago data, the negative trend jumped to 55.3% in December. The neutral trend was unchanged month on month at 2.6%, but still down from a high of 5.3% in August. The positive trend fell from 50.0% to 42.1%, a decline of nearly 8 percentage points months on month. A far cry from the high of 81.6% seen last June and slipping to its lowest total all year. Figure 2 shows the recent movement of the trends and historical data for comparison.
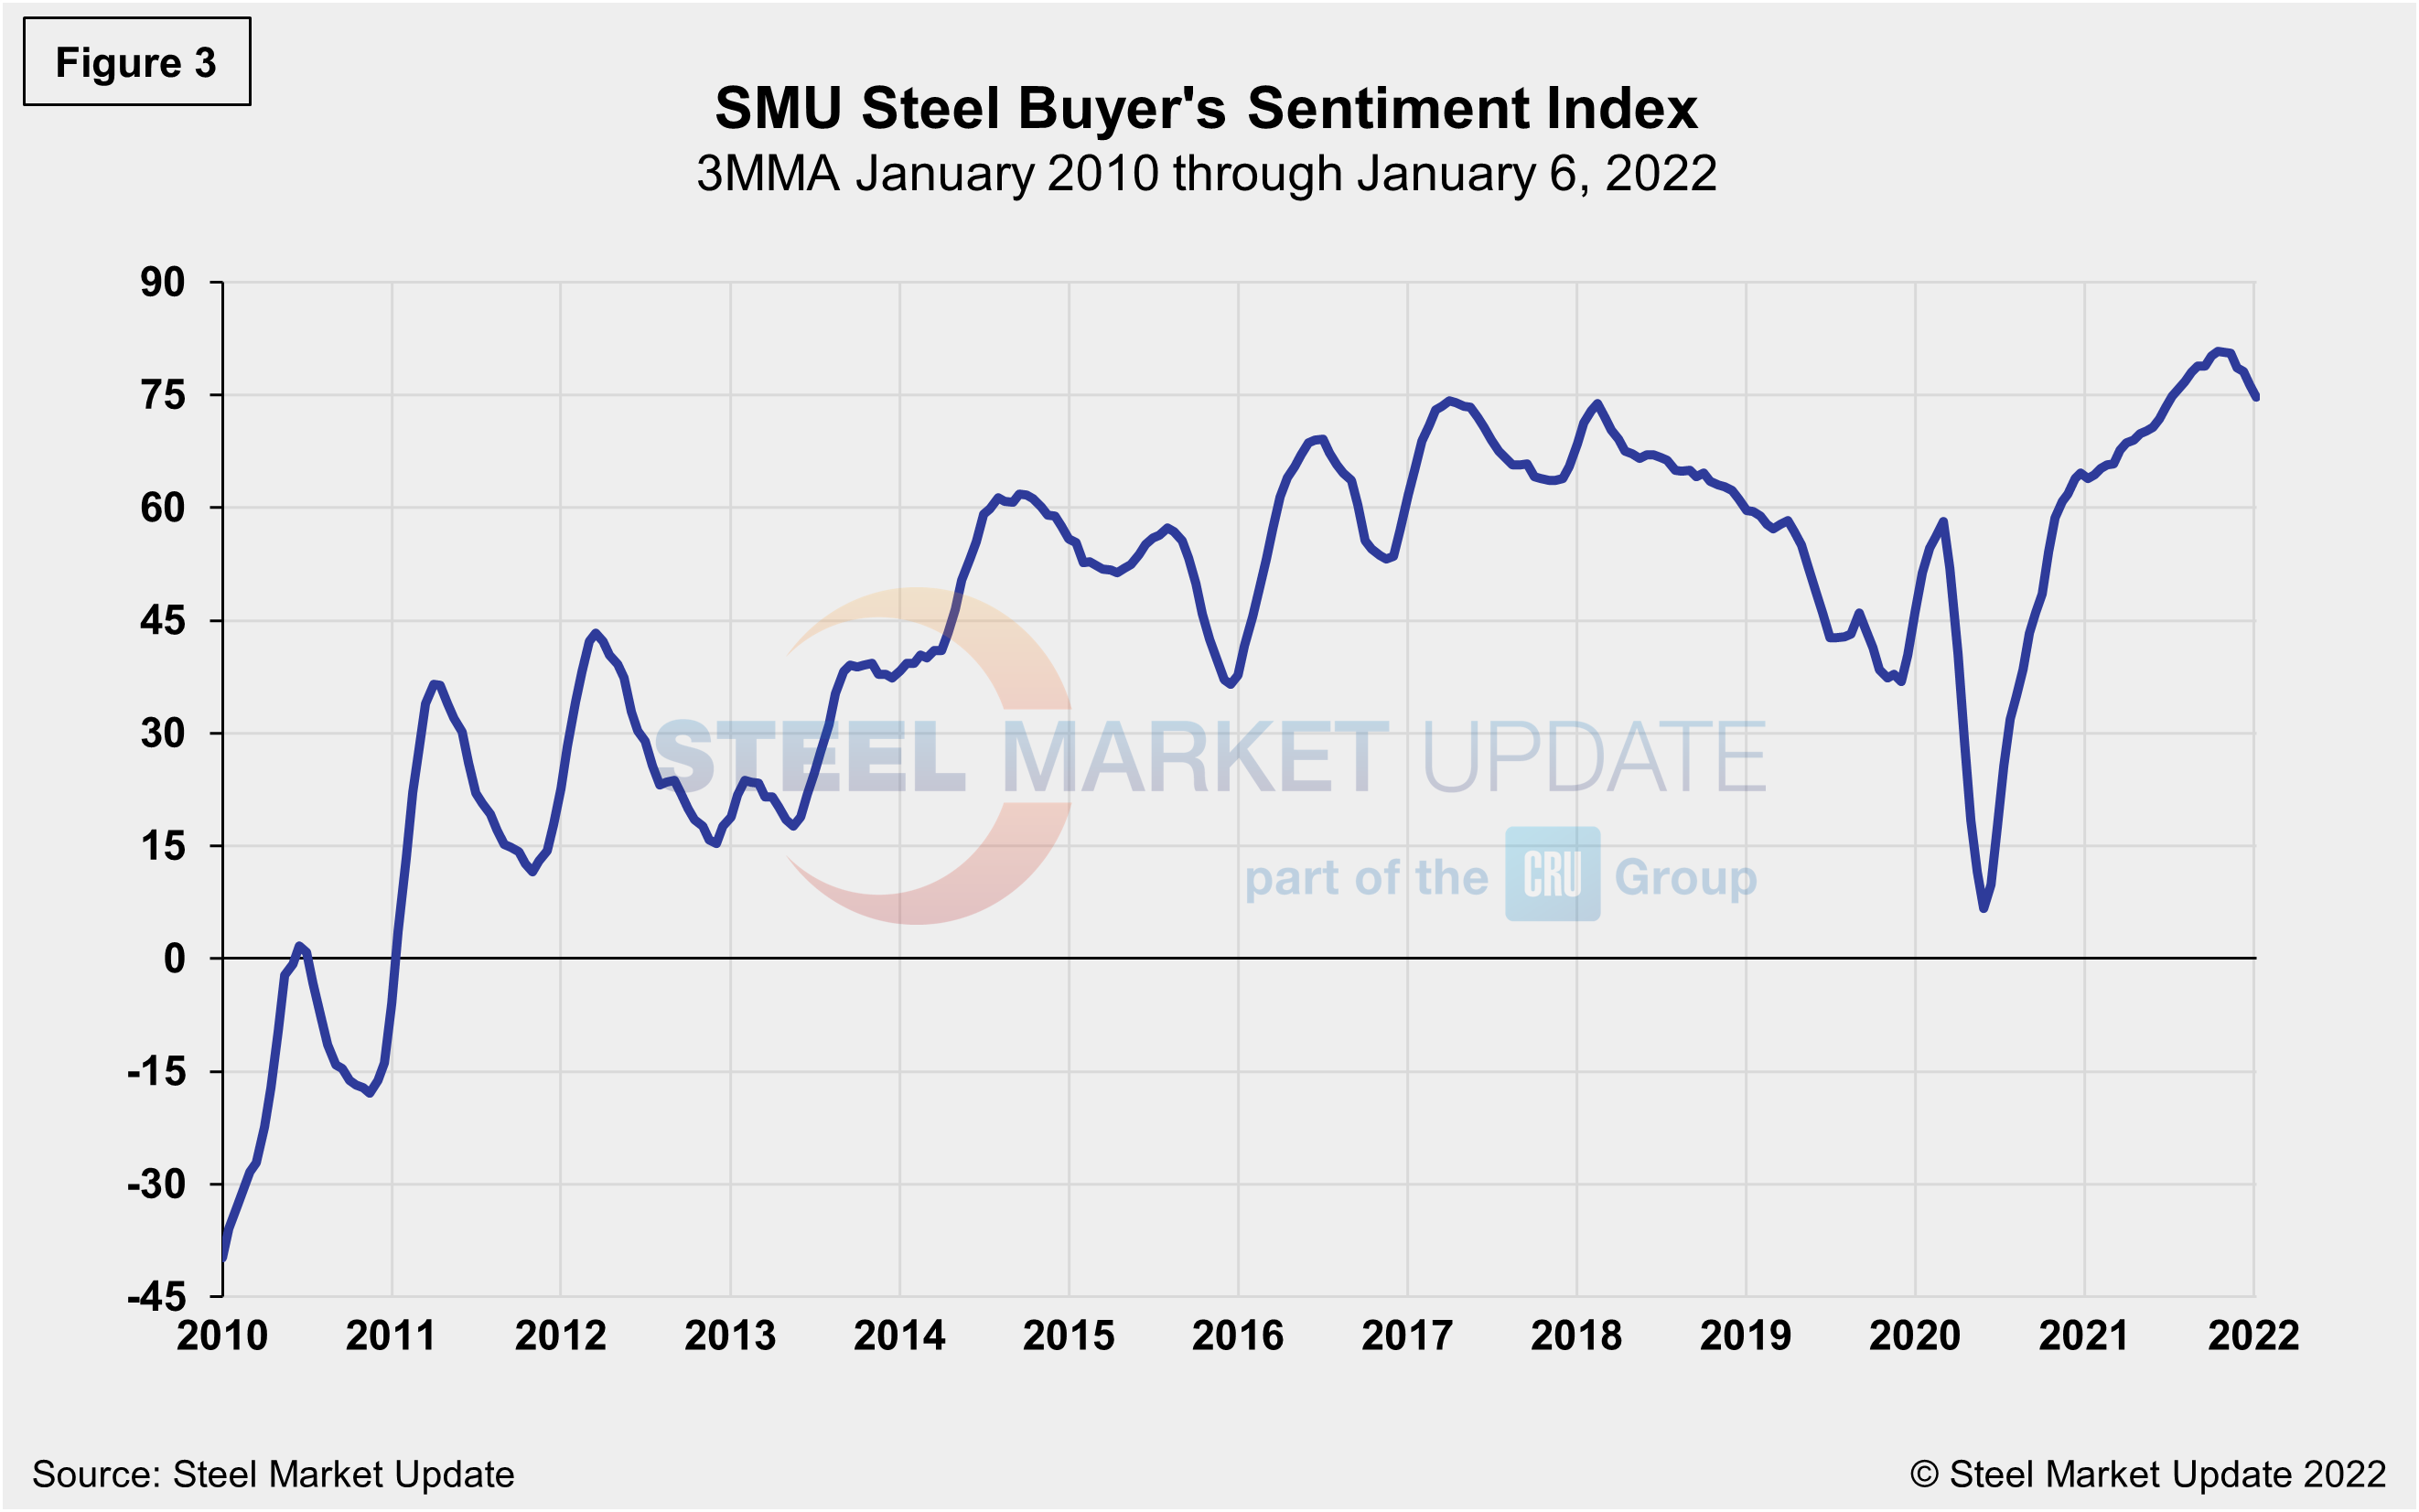
The SMU Steel Buyers Sentiment Index is a measure of the current attitude of North American steel buyers regarding their company’s chances for success in today’s market. The single value of the current sentiment index fell to -8 in early March 2020, a 66-point drop in just a month as the pandemic decimated the economy. It has since rebounded to a healthy +73 as of Jan. 6, but is still down from the high of +84 seen Sept. 2. Figure 3 shows the 3MMA of the index since 2010. A reading above the neutral point of zero indicates that buyers have a positive attitude about their prospects. Steady demand appears to be keeping the Steel Buyer’s Sentiment Index at a highly optimistic level despite the current price correction.
By David Schollaert, David@SteelMarketUpdate.com


