

Market Data

January 20, 2022
Steel Mill Lead Times: Getting Back to "Normal"
Written by Tim Triplett
Steel mill lead times – a leading indicator of prices – continue to trend downward and are approaching what used to be considered “normal.” If lead times are nearing a point at which they may soon level off, what might that say about steel prices?
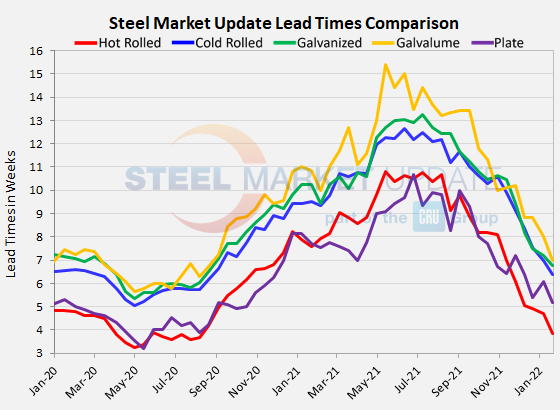
Steel Market Update’s check of the market this week puts the average lead time for hot rolled below four weeks for the first time since August 2020. Likewise, lead times for cold rolled and galvanized have shortened to about six and a half weeks over the past year and a half. Buyers polled by SMU over the past three days reported mill lead times ranging from 2-6 weeks for hot rolled, 5-8 weeks for cold rolled, 4-10 weeks for galvanized, 6-10 weeks for Galvalume, and 3-8 weeks for plate.
To appreciate how far lead times have come in, consider that the average mill lead time for hot rolled orders in 2019, prior to the pandemic, was 3.99 weeks – about where it is right now. In 2020, as the economy and steel market struggled with COVID-related disruptions, the average lead time stretched to 4.87 weeks. In 2021, the effect was even more pronounced with buyers waiting 8.69 weeks for their orders to be processed. But the average hot rolled lead time has shortened by nearly seven weeks since its peak last summer, and the trend is nearly the same for other steel products.
The latest survey shows that the average lead time for hot rolled has declined to 3.83 weeks from 4.69 two weeks ago. Cold rolled lead times now average 6.38 weeks, a decline from 6.99 in early January. Galvanized lead times dipped to 6.78 weeks from 7.21 in the same timeframe. The average Galvalume lead time is down by nearly a week to about 7.0 weeks. Mill lead times for plate are now at 5.17 weeks, down from 6.07 in SMU’s last check of the market.
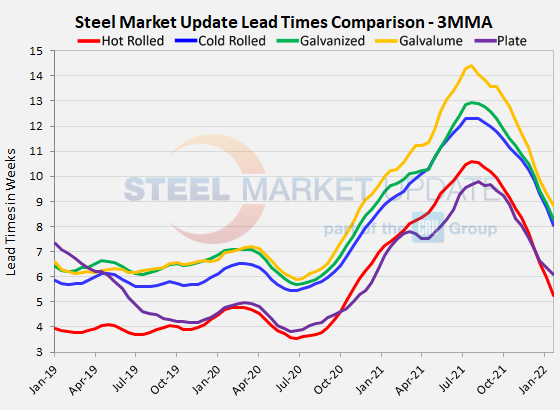
Measured as a three-month moving average to smooth out the variability, the 3MMA is 5.26 weeks for hot rolled, 8.05 weeks for cold rolled, 8.26 weeks for galvanized, 8.83 weeks for Galvalume and 6.11 weeks for plate.
If declining lead times are a leading indicator of declining steel prices, and the correction in lead times has nearly run its course, then perhaps the price correction is further along the curve than some have predicted.
Note: These lead times are based on the average from manufacturers and steel service centers who participated in this week’s SMU market trends analysis. SMU measures lead times as the time it takes from when an order is placed with the mill to when the order is processed and ready for shipping, not including delivery time to the buyer. Our lead times do not predict what any individual may get from any specific mill supplier. Look to your mill rep for actual lead times. To see an interactive history of our Steel Mill Lead Times data, visit our website here.
By Tim Triplett, Tim@SteelMarketUpdate.com


