

Market Data

January 24, 2022
Consumer Confidence Slips in January
Written by David Schollaert
U.S. consumer confidence fell in January, the first decline in four months, reported The Conference Board. The headline index lost momentum at the onset of 2022 after staging a small recovery during the fourth quarter, rebounding from a summer lull.
Sentiment towards current business and labor market conditions was slightly improved in January even though Americans’ views on the outlook for the economy cooled. The share of respondents who said conditions were “good” rose to a six-month high, and buying plans firmed.
Though still elevated, concerns about the effects of inflation moderated in January, the report said. However, fewer consumers expected the economy to improve, incomes to increase and more jobs to be available in the next six months. Americans were also slightly more upbeat about present business conditions.
“Consumer confidence moderated in January, following gains in the final three months of 2021,” said Lynn Franco, senior director of economic indicators at The Conference Board. “The present situation index improved, suggesting the economy entered the new year on solid footing. However, expectations about short-term growth prospects weakened, pointing to a likely moderation in growth during the first quarter of 2022. Nevertheless, the proportion of consumers planning to purchase homes, automobiles and major appliances over the next six months all increased.”
“Meanwhile, concerns about inflation declined for the second straight month, but remain elevated after hitting a 13-year high in November 2021. Concerns about the pandemic increased slightly amid the ongoing Omicron surge. Looking ahead, both confidence and consumer spending may continue to be challenged by rising prices and the ongoing pandemic,” she added.
The headline index slipped by 1.4 points in January to 113.8 after edging up 3.3 points in December. The result remained 15.1 points behind its peak of 128.9 seen last June, and a disappointing start to the New Year. Despite the contraction, January’s total was still 26.7 points above the same year-ago total, when the index measured just 87.1.
January’s present situation index, which is based on consumers’ assessment of current business and labor market conditions, improved for the second straight month, a 3.4-point growth month on month to a reading of 148.2. The expectations index, which is based on consumers’ short-term outlook for income, business and the labor market, fell by 4.6 points to 90.8, the first decline in four months.
Calculated as a three-month moving average (3MMA) to smooth out the volatility, The Conference Board’s composite index rose in January to 113.6 versus 112.9 in December – rising for the third straight month but still well below the pre-pandemic high of 130.4 seen in February 2020. The recent growth pushed the index 24.6 points higher than the 89.0 seen a year ago. The composite index is made up of two sub-indexes: consumers’ view of the present situation and their expectations for the future. Figure 1 below notes the 3MMA linear trend lines from January 2012 through January 2022 versus the trend lines of all three subcomponents of the index: present situation, composite and future expectations. All three were above the average composite line in October 2020 before falling consecutively through last February. The surge from March through June pulled all three indexes above the composite line once again, but a summer lull pulled them back down, causing expectations slip below the average composite line as it tries to recover.
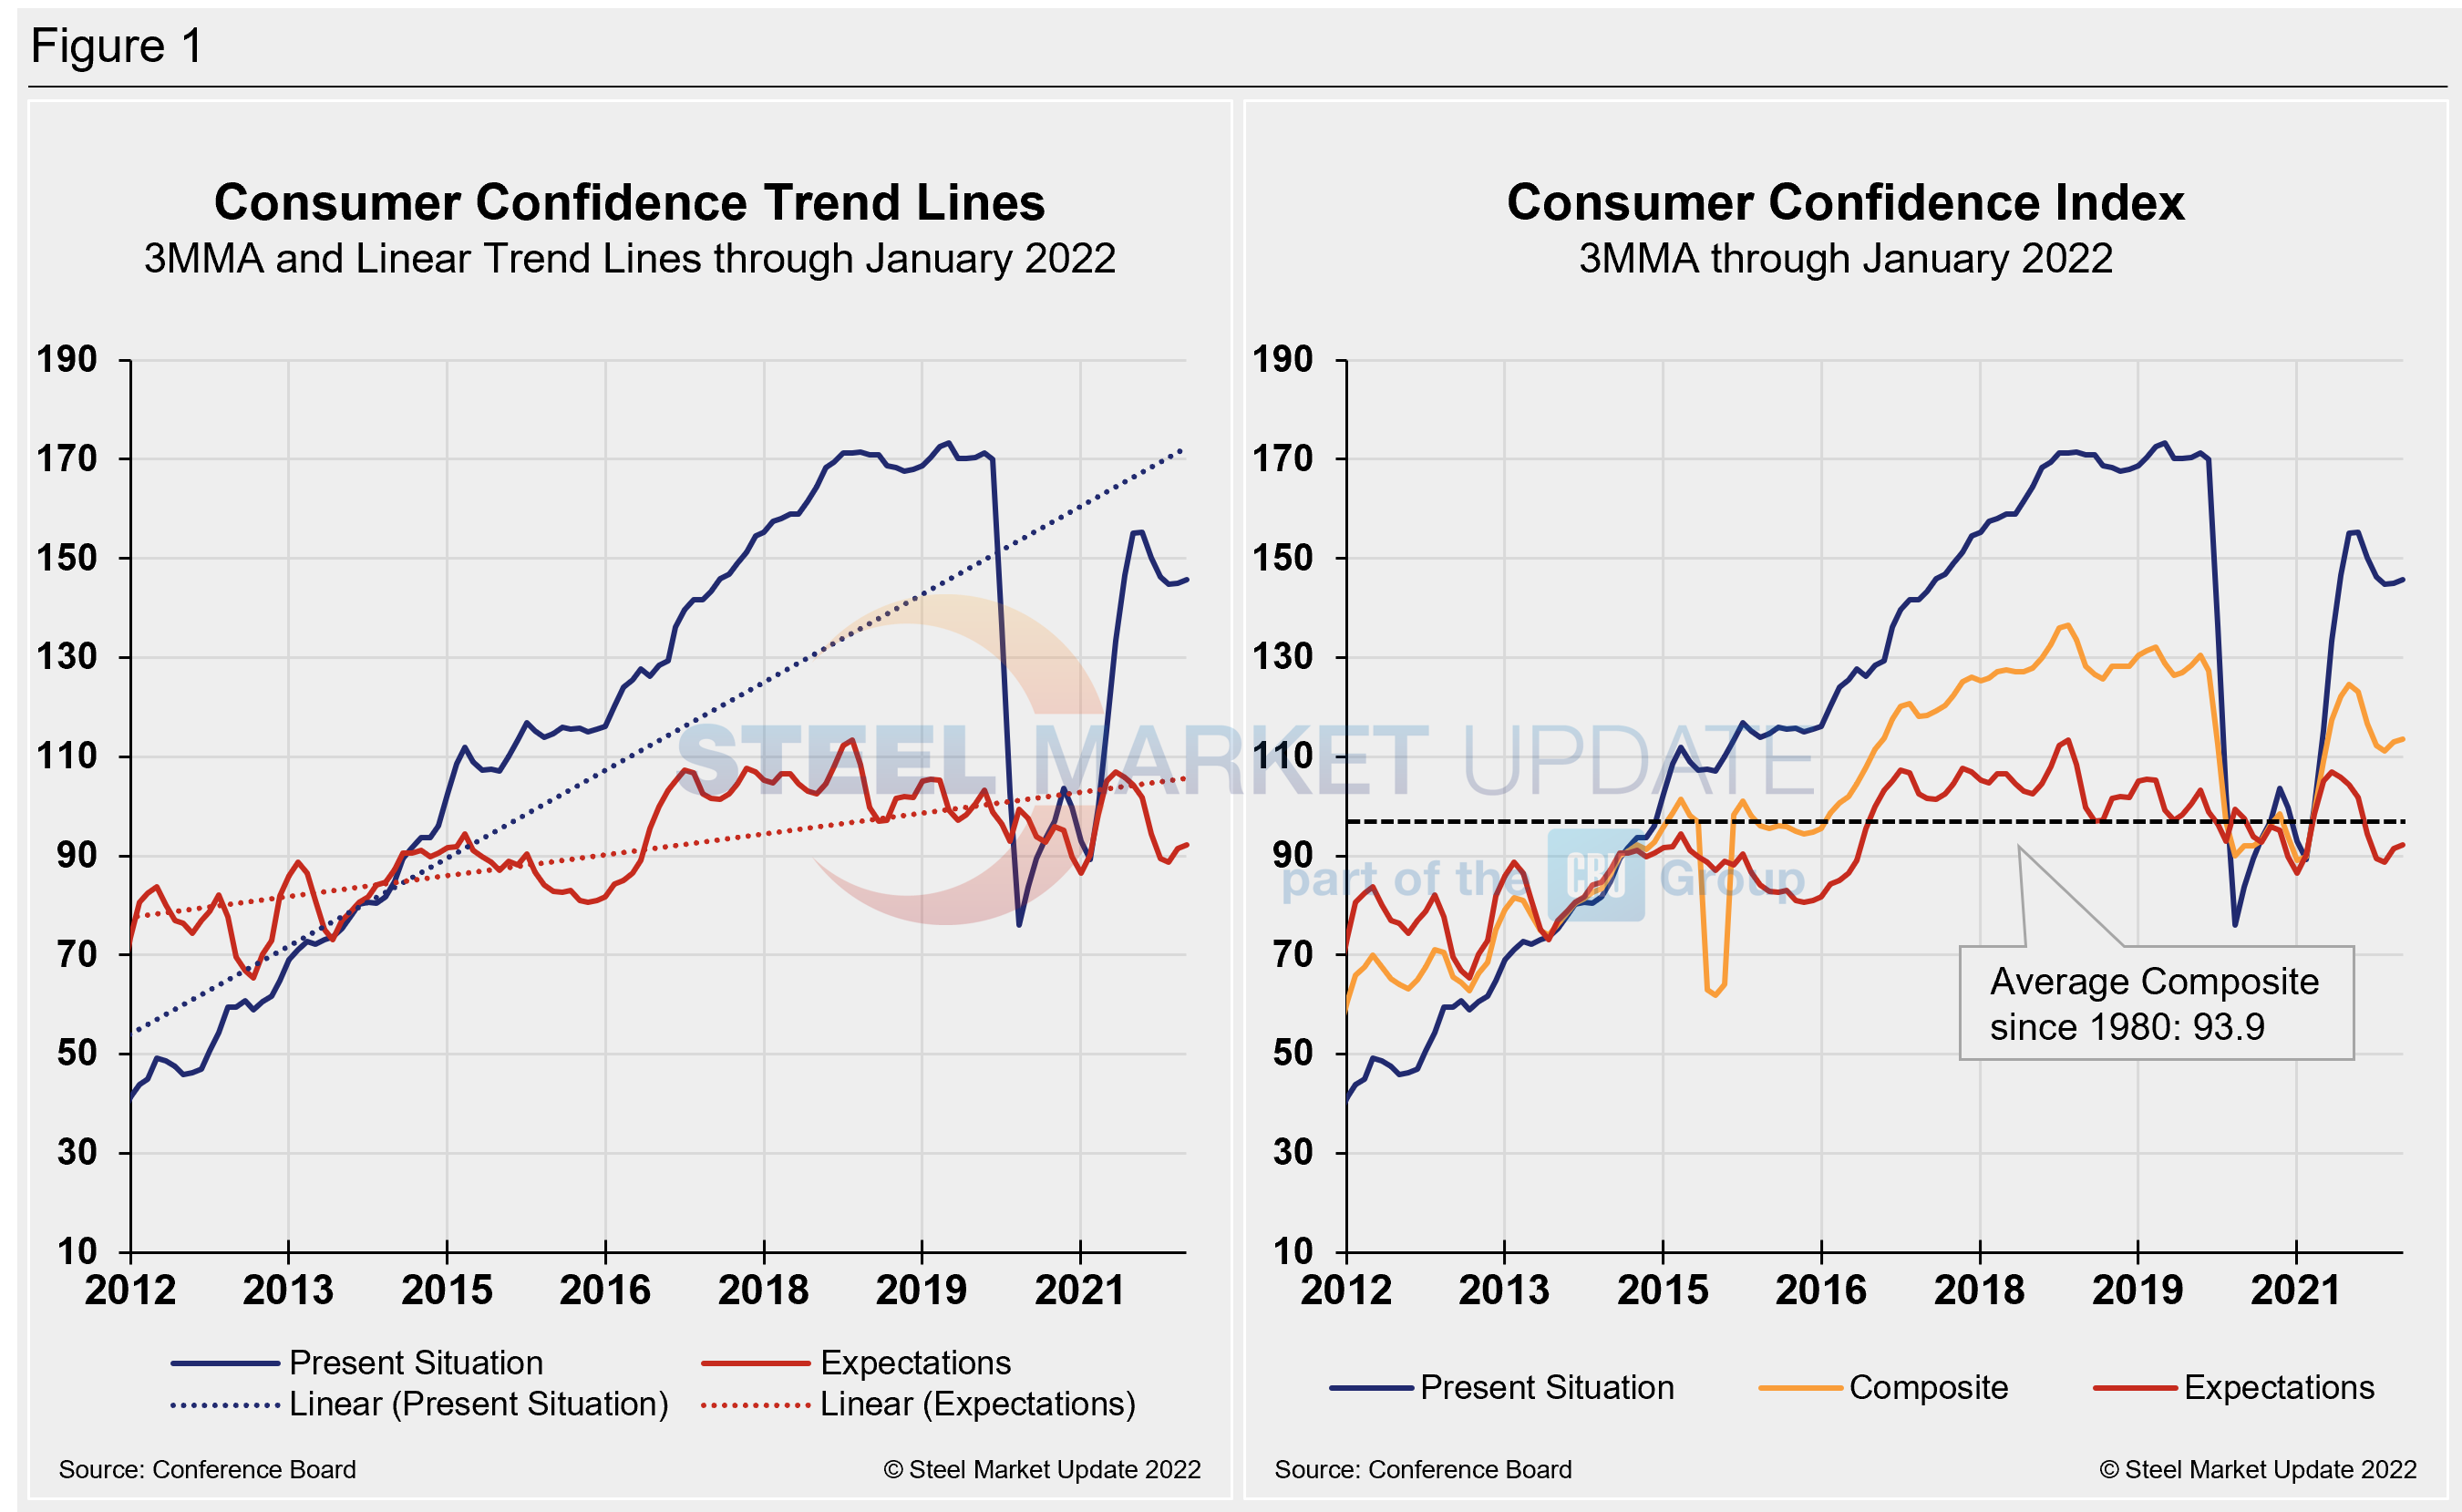
On a 3MMA basis comparing January 2022 with January 2021 in the table below, the present situation has an index reading of 145.8, a 0.9-point increase from the month prior and 52.9 points above the year-ago reading. Expectations are at 92.1, up 0.6 points from December, and 5.7 points above year-ago levels. Despite some erosion in January, all three indexes show positive gains against year-ago measures when the economy was still recovering from the first wave of COVID-19, with the momentum indicator also moving up.
When comparing current 3MMA totals to the 2019 pre-pandemic year, the composite is still down 14.6 points, while the present situation is down 25.1 points. The expectations reading is down 7.7 points in January when compared to the same 2019 period. The consumer confidence report also includes both employment data and some purchase plans and these are likewise summarized in the table below. The color codes show improvement or deterioration of the individual components.
The composite, present situation and expectations indices rallied mid-way through 2021, recovering much of what was lost in the fallout from the global pandemic. Driven by the surge in Delta variant cases, momentum shifted downward during Q3, followed by a bit of a rally in the fourth quarter. Despite the recent run, the measures remain below the pre-summer highs.
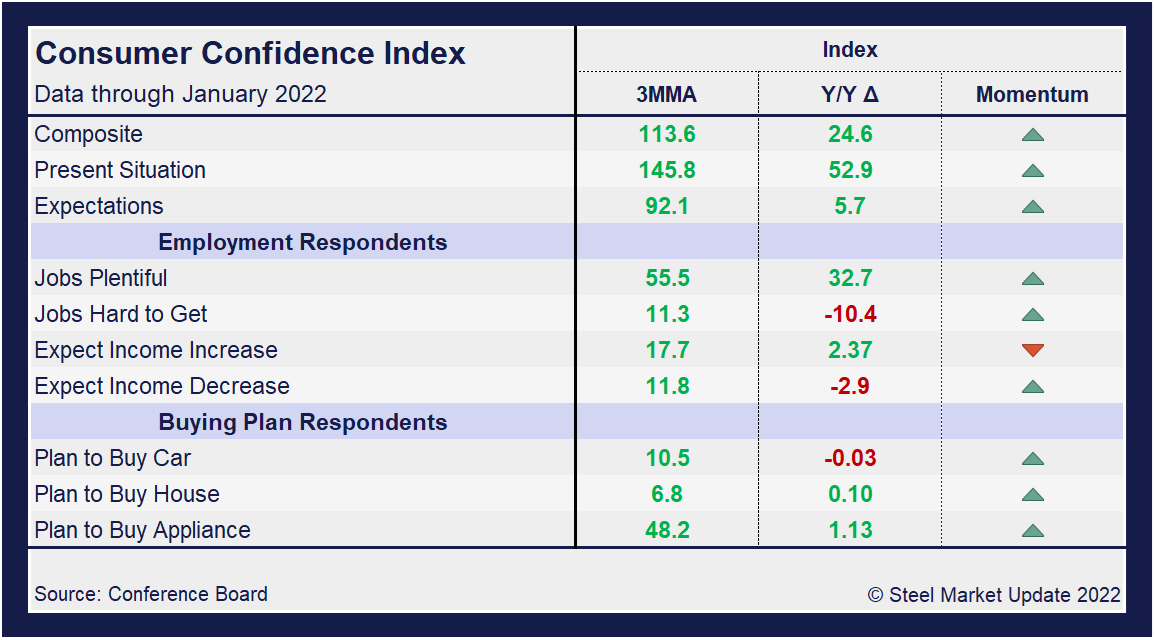
People found jobs slightly less plentiful in January and were a bit less optimistic about wage increases compared to the month prior, slipping sequentially. The differential between those finding jobs plentiful and those having difficulty was 43.8 in January, down from 44.2 in December. The measure has easily eclipsed the most recent pre-pandemic high of 35.3 seen in January 2020, and despite some recent inconsistencies is a strong rally from the -1.8 seen a year ago. The differential between those expecting wages to rise versus those expecting wages to fall is presently 4.3, down 2.0 points month on month and down from the recent high of 11.6 last June.
Spending plans for consumer goods as measured by automobiles, homes and appliances had been trending up through June, but started slowing through the summer and into the fourth quarter. Despite some recent variation, all three moved up in January. Home buying plans saw the strongest increase, up 0.9 points or 23.5% month on month in January to a reading of 7.8, its strongest pandemic-era reading. Automotive buying rose 0.4 points to 11.5. Appliance buying rose in January, up 1.1 points to 48.9. These recent dynamics and historical movements are illustrated below in Figure 2.

Note: The Conference Board is a global, independent business membership and research association working in the public interest. The monthly Consumer Confidence Survey®, based on a probability-design random sample, is conducted for The Conference Board by Nielsen. The index is based on 1985 = 100. The composite value of consumer confidence combines the view of the present situation and of expectations for the next six months.
By David Schollaert, David@SteelMarketUpdate.com


