

Prices

February 15, 2022
Apparent Steel Supply Hits 110 Million Tons in 2021, Highest Since 2018
Written by Brett Linton
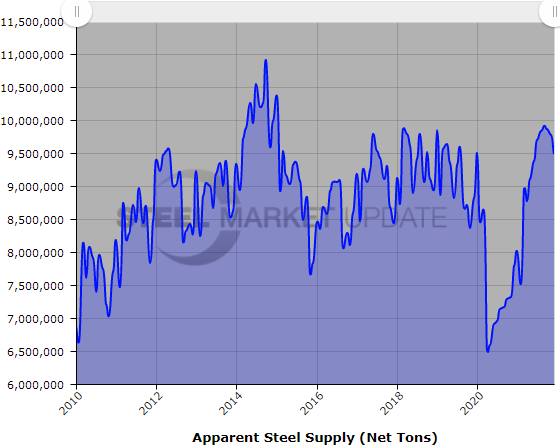
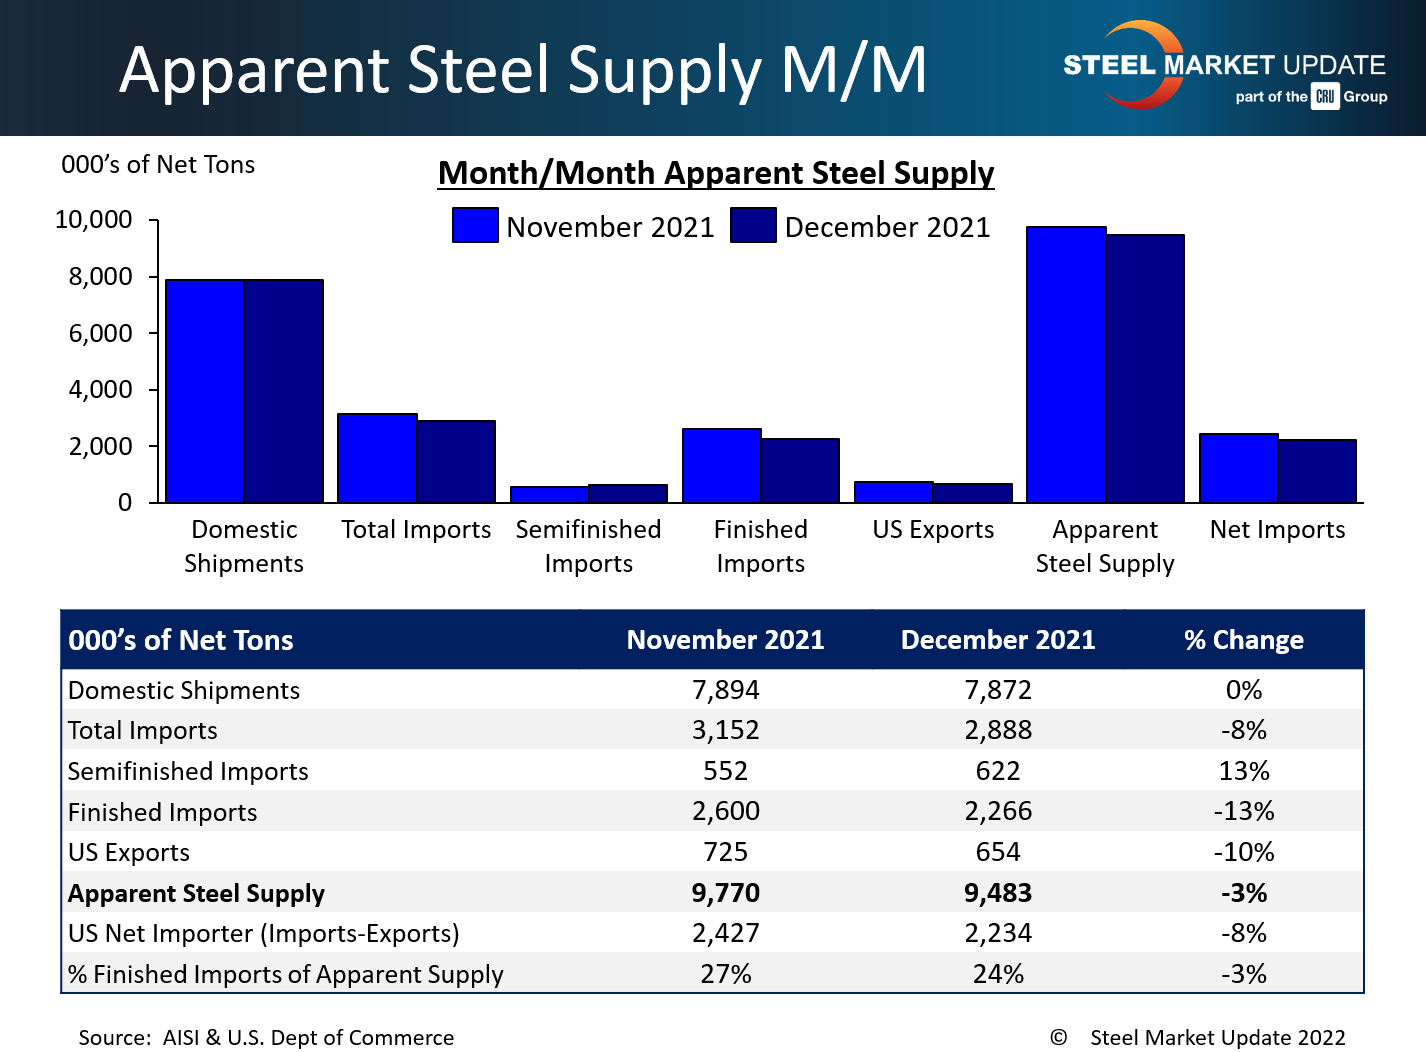
U.S. apparent steel supply levels slipped 3% from November to December, down 286,000 net tons to 9.48 million net tons, according to the latest U.S. Department of Commerce and American Iron and Steel Institute data. Recall that September 2021 saw the highest monthly supply level in over six years, going back to January 2015 when supply surpassed 10 million tons.
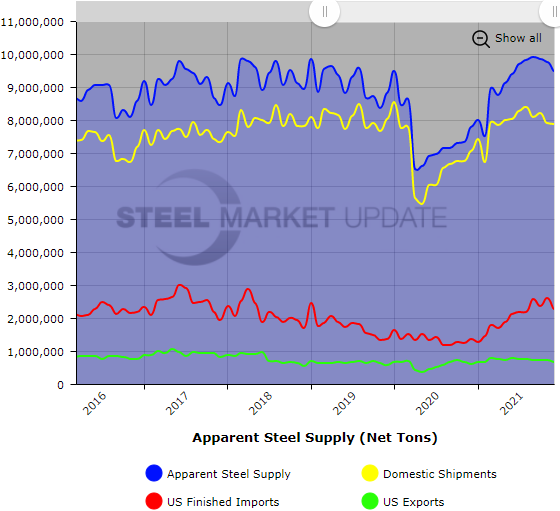
Apparent steel supply, a proxy for demand, is determined by combining domestic steel mill shipments and finished U.S. steel imports, then deducting total U.S. steel exports.
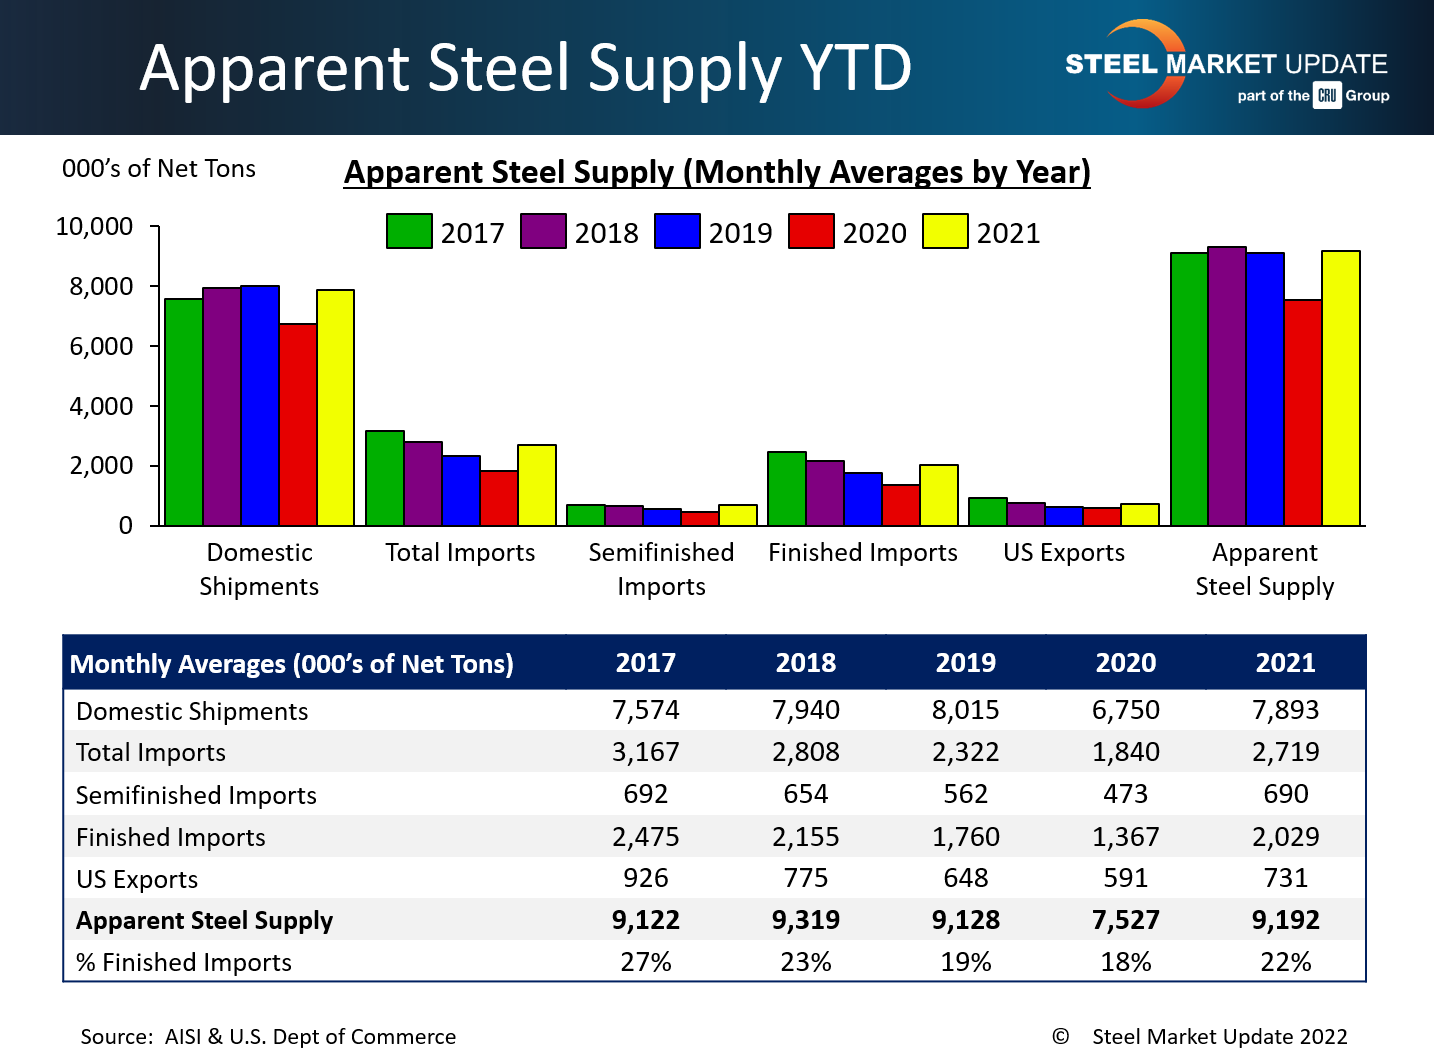
Apparent supply for 2021 totaled 110.3 million tons, up 22% from 90.3 million tons in 2020, and up 1% from 109.5 million tons in 2019. In Steel Market Update’s ~13-year data history, 2014 holds the annual record at 119.5 million tons.
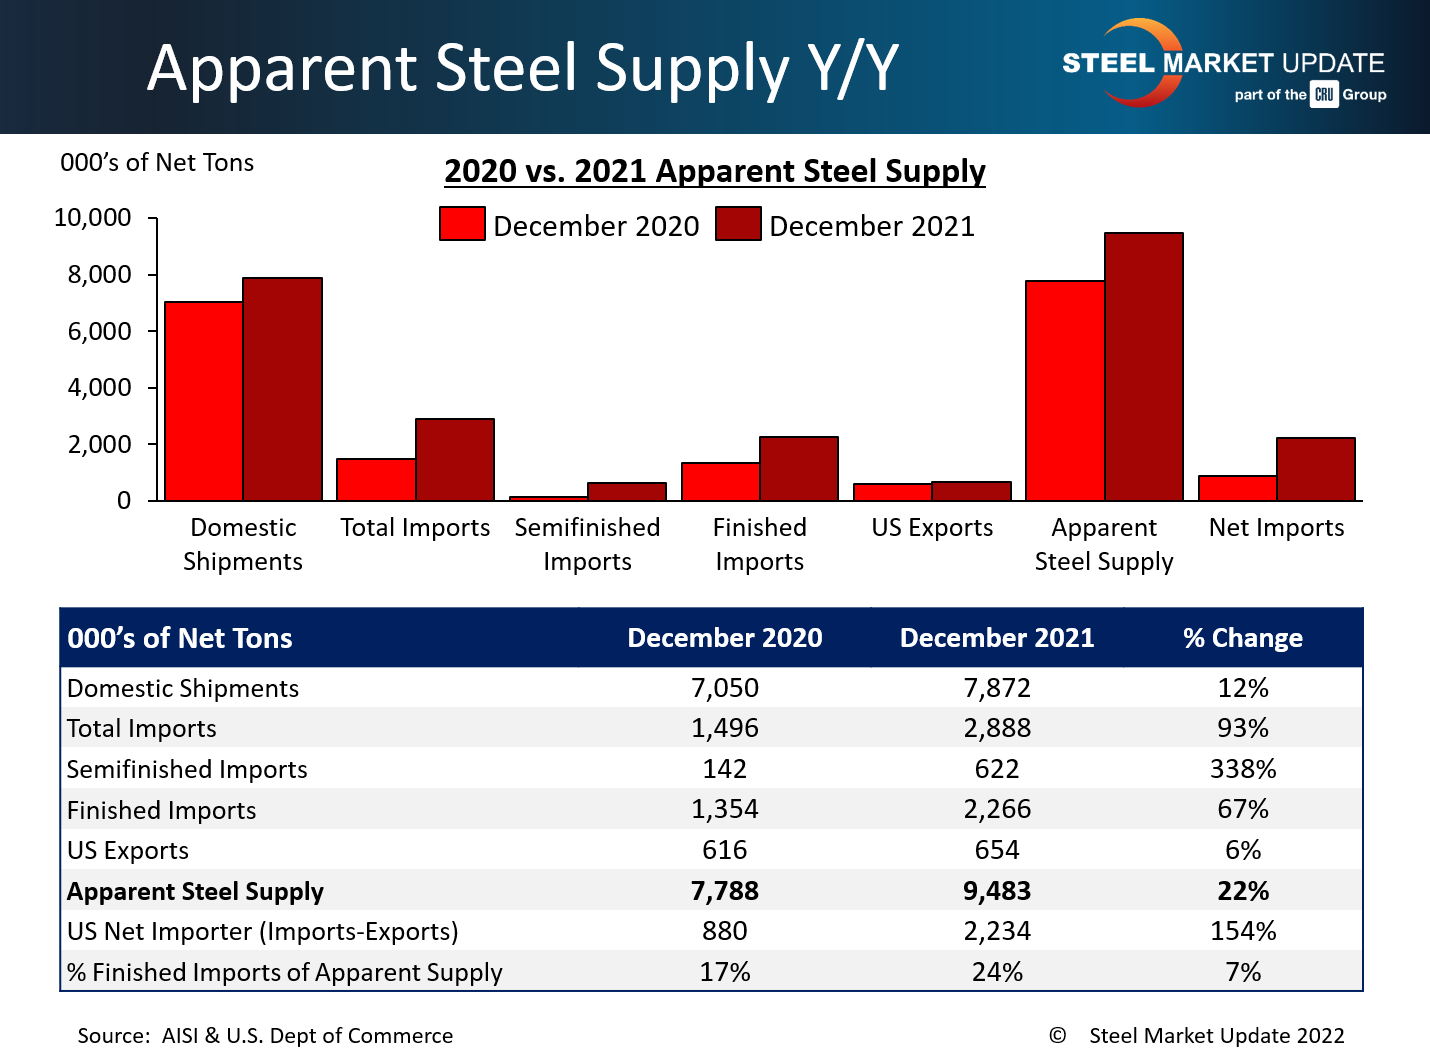
December apparent supply is 1.70 million tons higher than the same month one year ago, when supply was 7.79 million tons. This 22% improvement was primarily due to a 912,000-ton increase in finished steel imports and an 822,000-ton rise in domestic shipments, the sum of which was slightly reduced by a 38,000-ton increase in total exports. The net trade balance between U.S. steel imports and exports was at a surplus of 2.23 million tons imported in December, 1.35 million tons higher than one year prior. Finished steel imports accounted for 24% of apparent steel supply in December, up from 17% this time last year.
Compared to the month prior when apparent supply was 9.77 million tons, December supply declined by 286,000 tons. This decrease was due to a 334,000-ton decline in finished steel imports and a 22,000-ton decrease in domestic shipments, partially negated by a 70,000-ton decrease in total exports. The net trade balance between imports and exports in December fell 8% from November, and the percentage of apparent steel supply composed of finished steel imports decreased 3%.
The figure below shows monthly averages for each statistic over the last five years. The average monthly apparent supply level for 2021 has greatly improved compared to the 2020 average and is now back in line with the monthly averages of most previous years shown.
To see an interactive graphic of our Apparent Steel Supply history (example shown below), visit the Apparent Steel Supply page in the Analysis section of the SMU website. If you need any assistance logging into or navigating the website, contact us at info@SteelMarketUpdate.com.
By Brett Linton, Brett@SteelMarketUpdate.com


