Market Data

February 15, 2022
Service Center Shipments and Inventories Report for January
Written by Estelle Tran
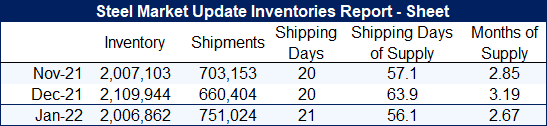
Flat Rolled = 56.1 Shipping Days of Supply
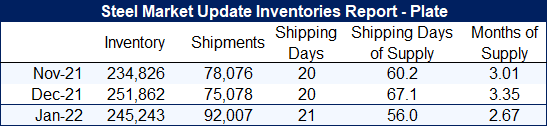
Plate = 56 Shipping Days of Supply
Flat Rolled
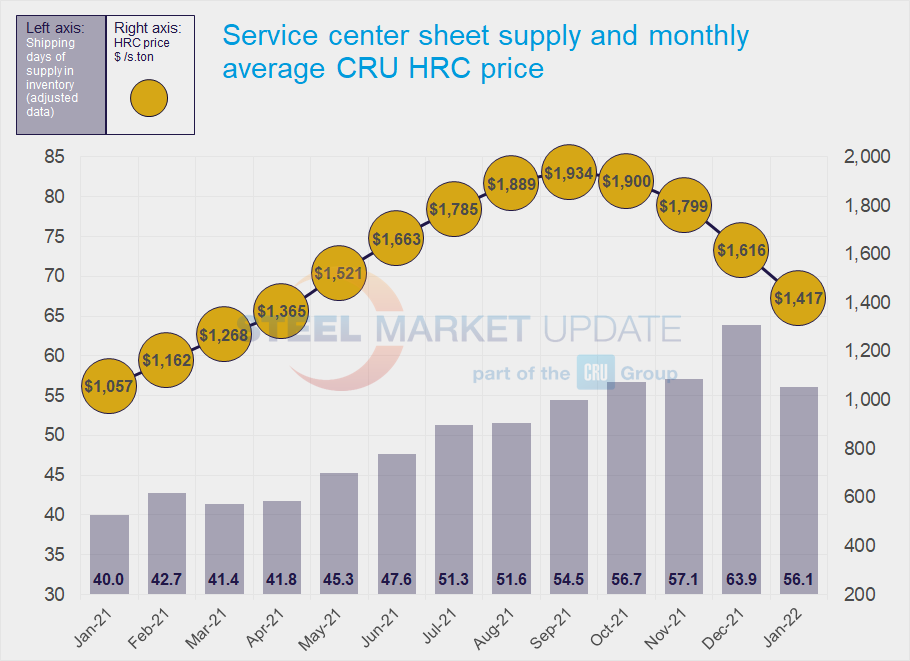
U.S. service center flat rolled inventories fell from their December highs, though the seasonal pick-up in demand in January was weaker than expected. At the end of January, service centers carried 56.1 shipping days of supply on an adjusted basis, down from 63.9 shipping days in December, according to Steel Market Update data. Sheet inventories in January represented 2.67 months of supply, down from 3.19 in December.
January had 21 shipping days, while December had 20. Shipments picked up in January because of the seasonal boost in demand, but also because of the additional shipping day. Service centers have reported customers delaying their orders and revising forecasts downward. With customers pulling less material than expected, some said it would take a few months for their inventories to return to normal levels.
Demand has been weaker than expected because of the ongoing component shortage in the auto industry, labor issues, Covid-19-related disruptions and other factors. However, we also believe that real demand seems to be lower because of delays and cancellations by end-users who double booked material when the market was tight. Because of the pullback in end-user demand, many service centers have been struggling to meet their contract minimums. With prices falling fast, particularly for HRC, service centers also have been hesitant to purchase spot material unless it is at a significant discount or already pre-sold.
The amount of material on order at the end of January dropped; this is in line with shortening lead times. The latest SMU survey measured HRC lead times at 3.89 weeks, down from 4.69 weeks a month ago. Mills shipping material earlier than expected and quiet deals in December to move January tons have contributed to the elevated inventory levels
Plate
U.S. service center plate inventories also dropped in January, in line with seasonal trends. At the end of January, service centers carried 56 shipping days of plate supply; this was down from 67.1 days of supply in December. Plate inventories represented 2.67 months of supply in January, down from 3.35 in December.
Demand for plate has been steady, but service centers said they are avoiding replacing material for as long as possible because of views that prices will soften. While sheet prices have been declining, plate prices have been fairly stable for the last couple months. Some market contacts have reported that mills were willing to negotiate on freight extras to win business, however, others said that mills were still resisting price decreases.
As domestic prices have remained high, imports have become more attractive. Some have said that they have had to turn to imports to remain competitive.
The amount of plate on order eased back in December, following the trend of shortening lead times. SMU’s latest survey reported plate lead times at 4.08 weeks, down from 6.07 weeks a month ago.
By Estelle Tran, Estelle.Tran@CRUGroup.com