

Market Data

February 16, 2022
SMU Key Market Indicators See Encouraging Growth Signs
Written by David Schollaert
Monthly Key Market Indicators improved slightly through January, showing promising signs of progress, according to the latest analysis by Steel Market Update. Following a more uncertain close to 2021, both neutral and positive indicators expanded, while negative indicators continued to ease.
Though economic dynamics remain in flux, with supply-chain bottlenecks and rising inflation and producer prices, January saw steady improvement as COVID-19 cases fell and the jobs report included an unexpected boost. The turn pushed indicators to a watchful but positive posture, suggesting renewed confidence in the marketplace for the months ahead.
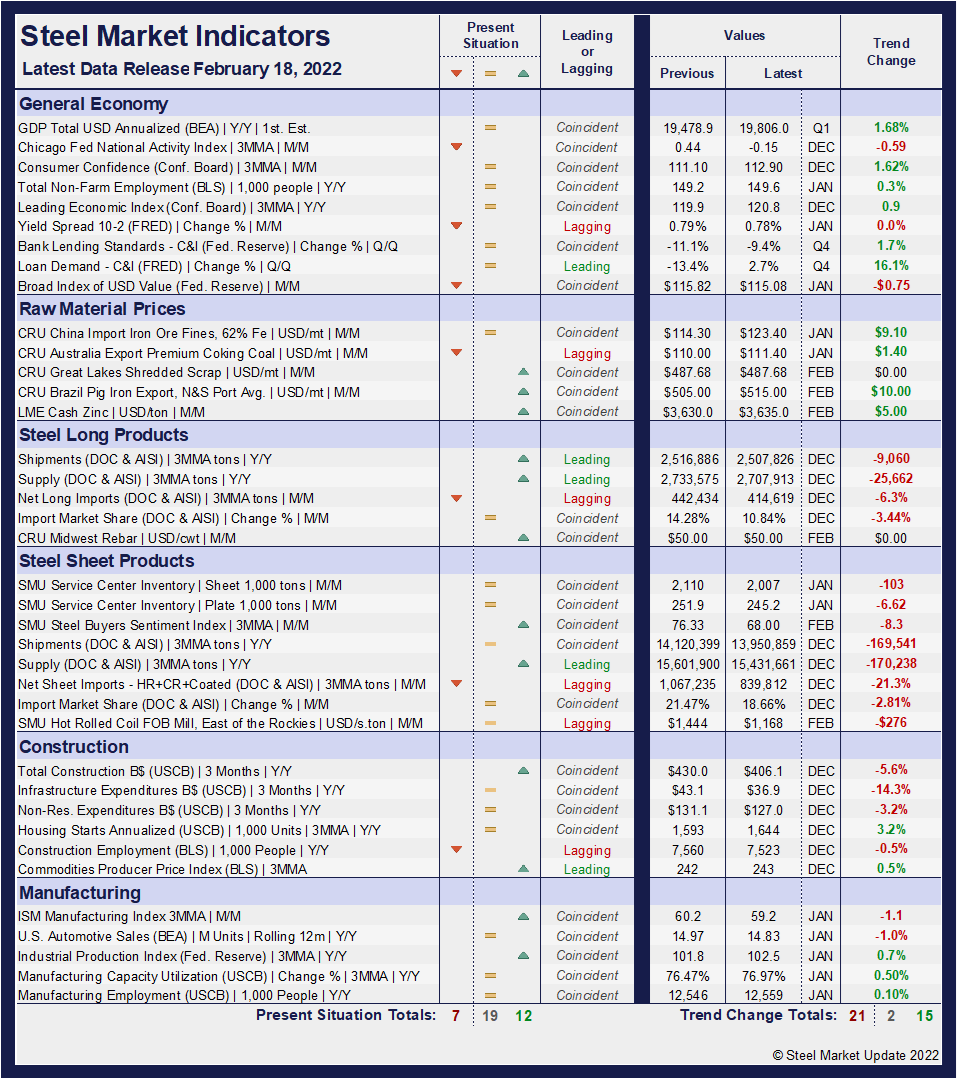
SMU’s Key Market Indicators include a host of data on the economy, raw materials, manufacturing, construction, and steel sheet and long products, offering a snapshot of current sentiment and the near-term expected trajectory of the economy. Markers for the Present Situation were sideways in December for only the second time all year, while Trends slipped further. The New Year has brought with it, however, a positive inflow for both Present Situation and Trend markers.
In the latest data, 12 of the 38 Present Situation indicators are positive, expanding the positive position by two points month on month. The neutral position expanded by one point to a reading of 19 in January, while the negative indicators eased by three points in January versus December’s reading, slipping to 7.
Negative indicators have trended down repeatedly by five points over the past two months after topping out at 12 in November, its highest measure all year. At its worst, during the height of the pandemic in July 2020, 18 of the 38 indicators shifted negative as the economy was decimated by closures. Although the neutral indicators, at 19, are just one point below their highest reading over the past two years, the two-point expansion for the positive indicators is an encouraging sign for the marketplace as the New Year is underway.
SMU’s Present Situation and Trends analyses in the table below are based on the latest available data as of Feb. 18, 2022. Readers should regard the color codes in the “Present Situation” column as a visual summary of the current market condition. The “Trend” columns are also color coded to give a quick visual appreciation of the market’s direction. All data included in this table was released within the past month. The month or specific date to which the data refers is shown in the second column from the far right. Click to expand the table below.
Present Situation
SMU’s Present Situation indicators below highlight the upward trajectory of the domestic market. Even if not smooth, the recovery has been remarkable. Beginning last June, momentum faded as the economy seemed unable to find its footing while new coronavirus variants spread. The direction was up and gaining ground through the first half of 2021, but eroded repeatedly, leading to a more uncertain and watchful trend through December as unemployment stalled and job reports continued to underperform.
The result, positive indicators fell from 20 to 10 through December, not far from their lowest reading of 7 seen in May 2020. Negative indicators pushed as high at 12 during that period, a 7-point gain from a low of 3 seen in May 2021. The more telling trend may be the growth in the neutral indicators, presently up at 19, the highest mark in 16 months. The trend suggests the market’s direction is still uncertain but maybe not as unstable as expected, as a positive outlook gains traction.
Supply shortages continue, particularly in the consumer goods, auto and construction sectors. The latest government data shows that U.S. retailers are facing roughly 10-12% out-of-stock levels on food, beverages, household cleaning, and personal hygiene products. The effects of inflation on producer prices remains a notable concern. Yet, the unexpected surge in employment in January and rapidly falling Omicron cases seem to be boosting morale.
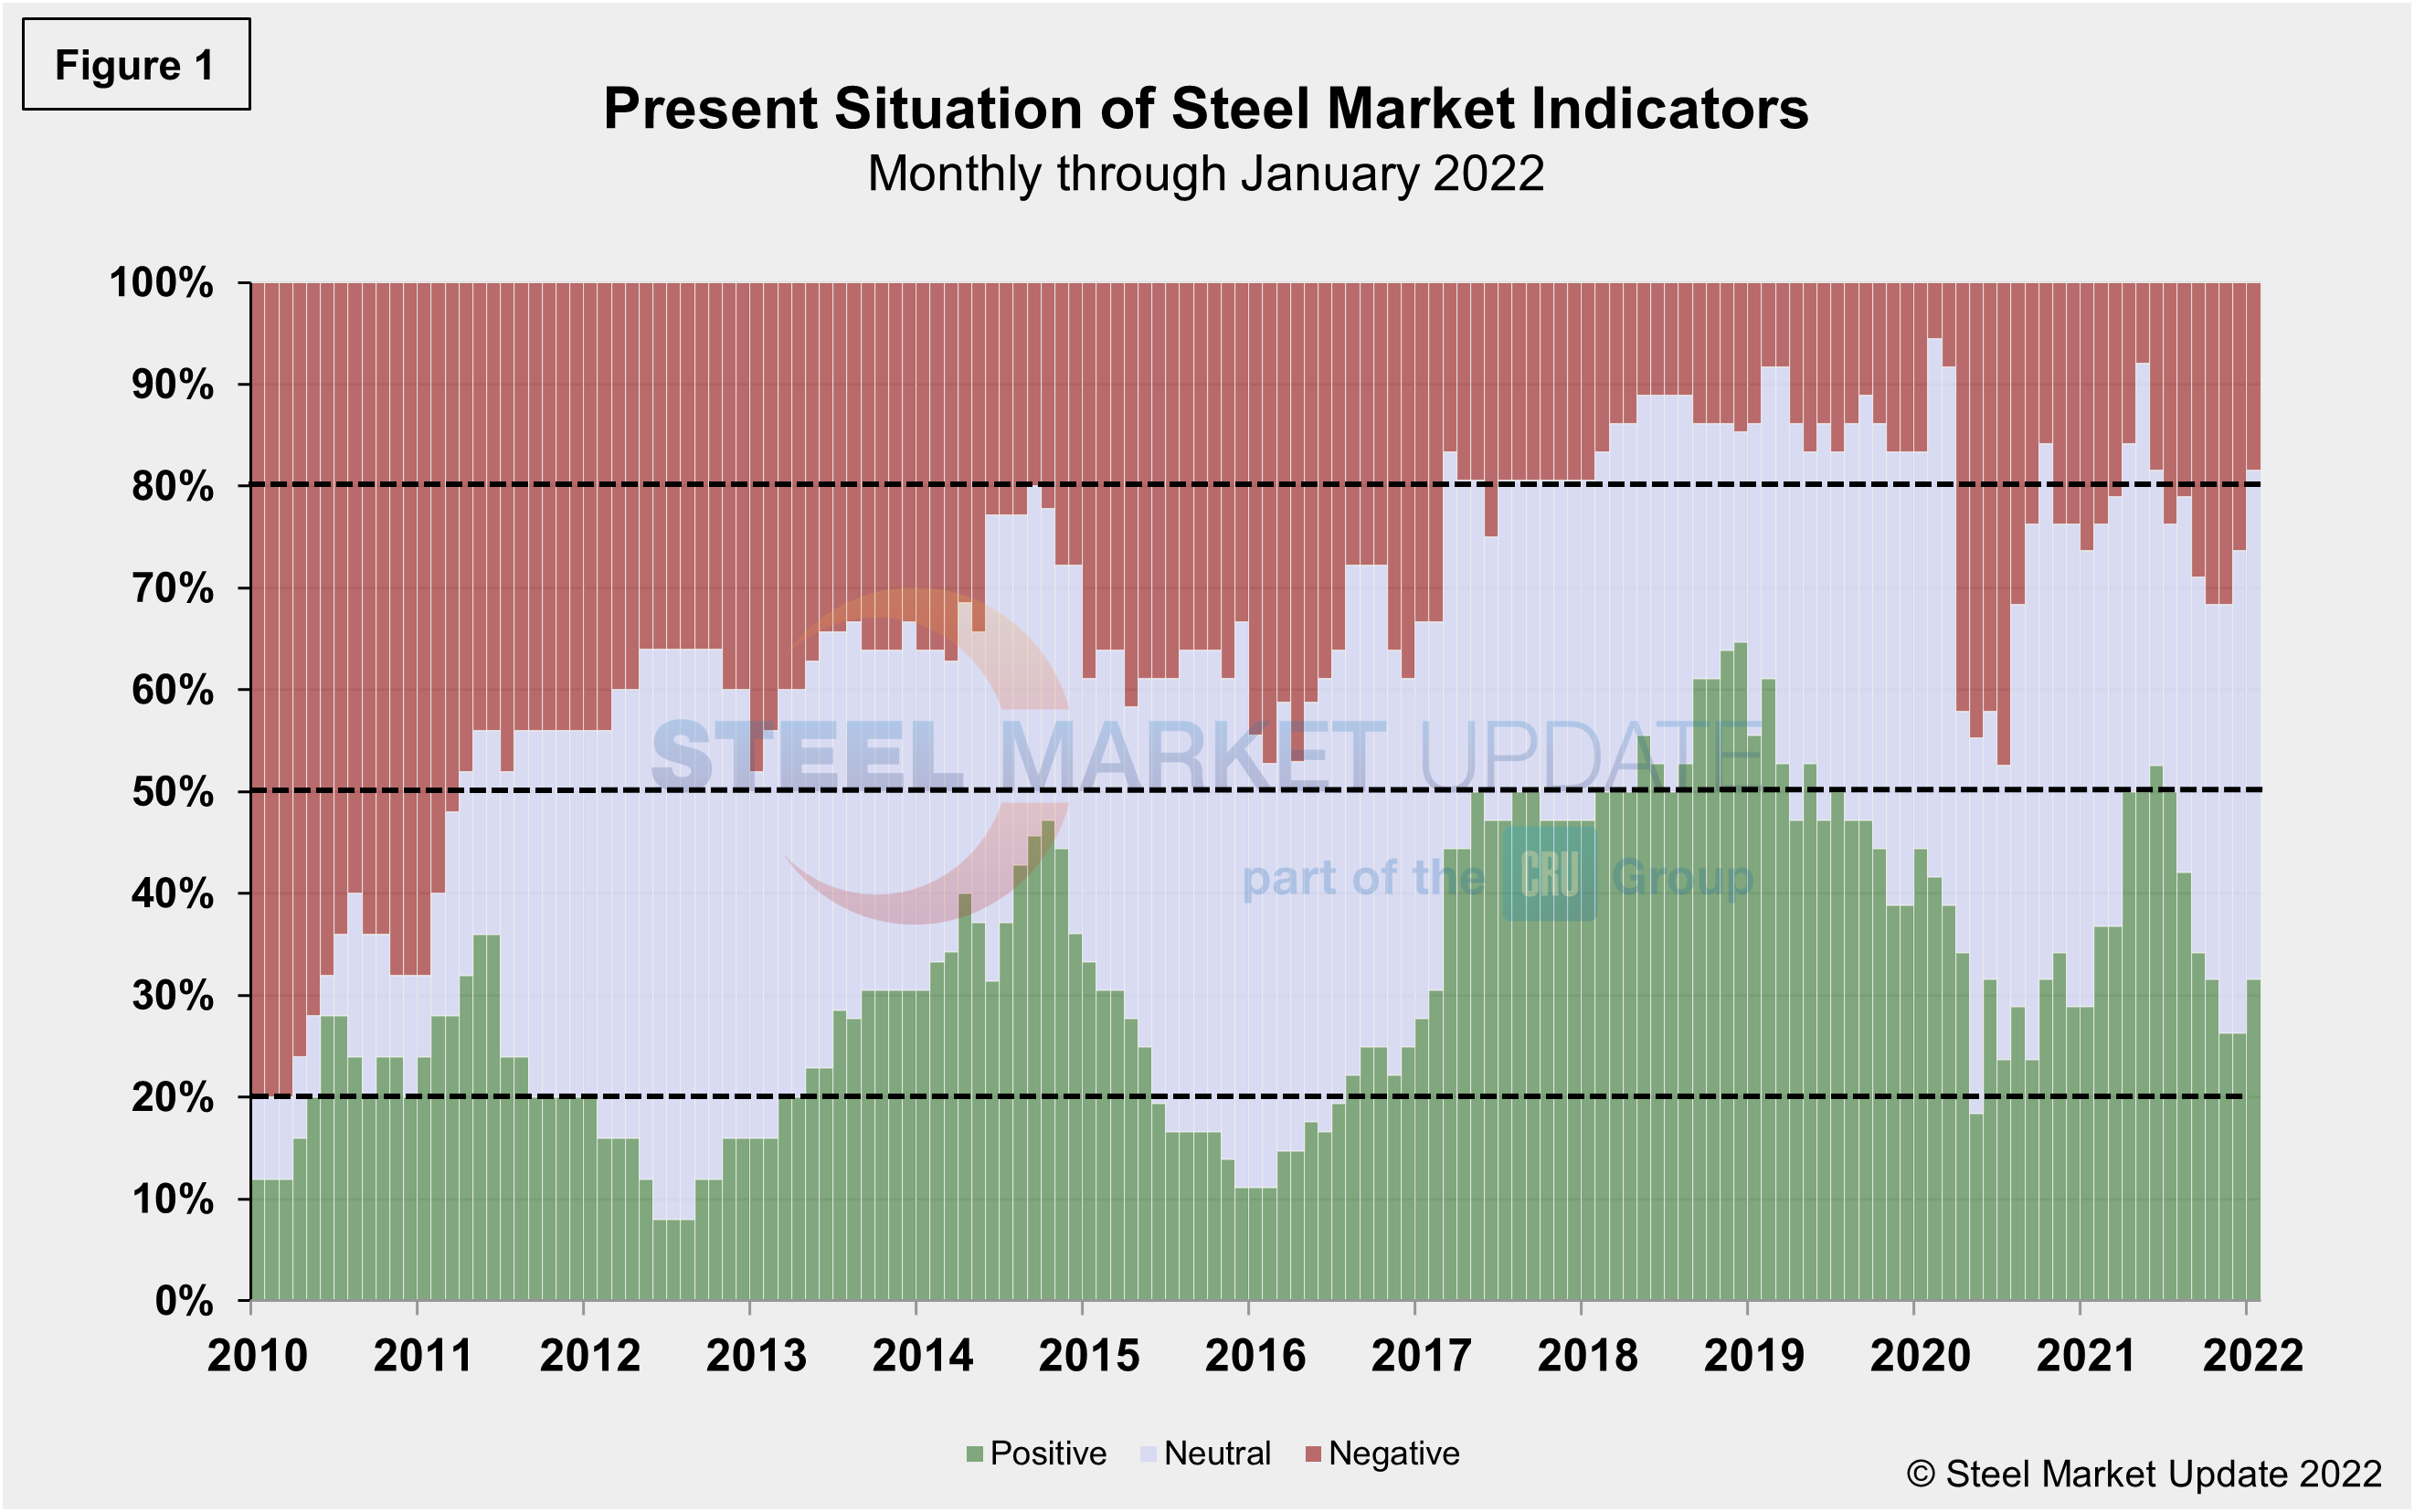
Present results have improved, though they still indicate a wait-and-see attitude in the marketplace compared to last month’s data due to the total gains in positive and neutral figures. Currently, 50.0% of the marketplace is neutral or unclear, a 2.6 percentage point increase and the highest total since September 2020, the top measure on record.
Through January, 31.6% of the marketplace is positive, a 5.3 percentage point increase, but still down from a high of 52.6% in June 2021. Presently, 18.4% of the market is negative, a 7.9 percentage point decline from December. With the expanded neutral and positive indicators, now 81.6% of the population sees the marketplace as neutral-to-positive, according to SMU’s assessment of key market indicators, a strong increase from 73.7% one month ago.
Our monthly assessment of the Present Situation since January 2010 on a percentage basis is shown in Figure 1.
Trends
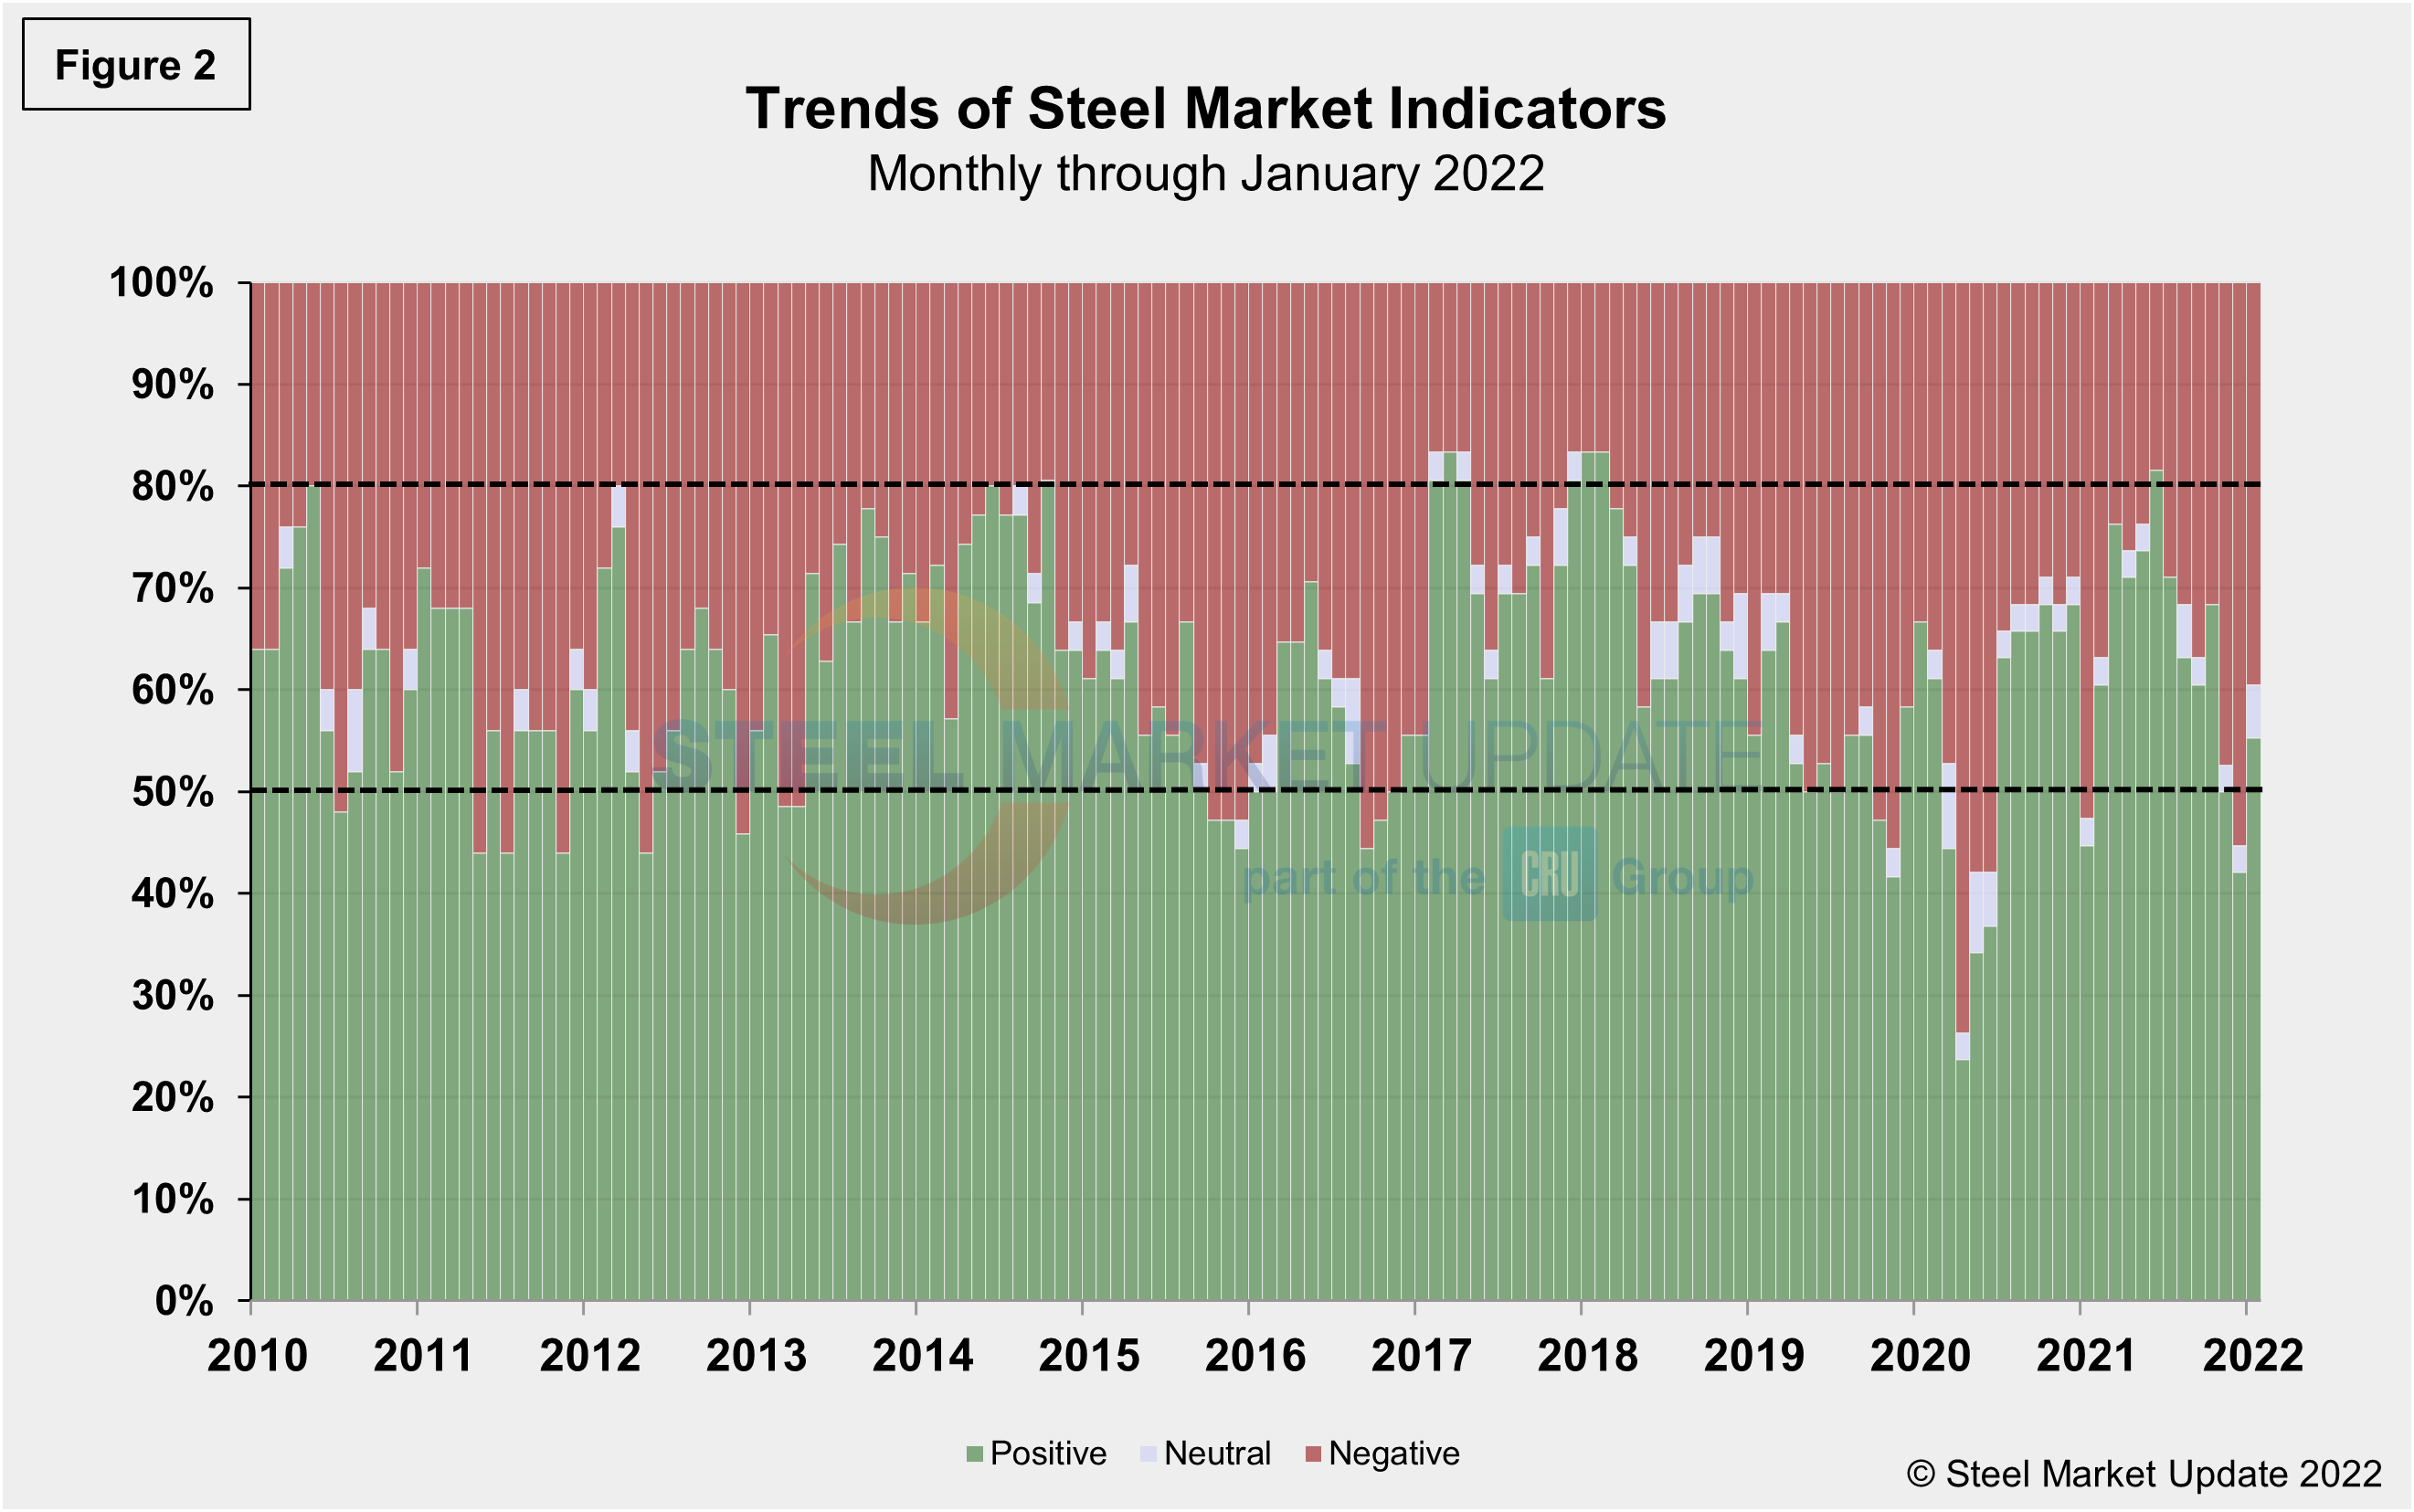
SMU’s Trends indicators jumped in January, an optimistic move beyond the market’s Present Situation, and a positive sign for 2022. It is important to note that most values in the Trends columns are three-month moving averages (3MMA) to smooth erratic monthly data. Note that in many cases this is not January or February data, but data that was released in January and/or February for previous months. Compared to month-ago data, the negative trend fell from 55.3% to 39.5% in January. The neutral trend grew by 2.7 percentage points to 5.3%, matching the high seen last August. The positive trend grew from 42.1% to 55.3%, a 13.2-percentage-points surge month on month. Despite the positive boost, January’s reading remains well behind the high of 81.6% seen last June. Figure 2 shows the recent movement of the trends and historical data for comparison.
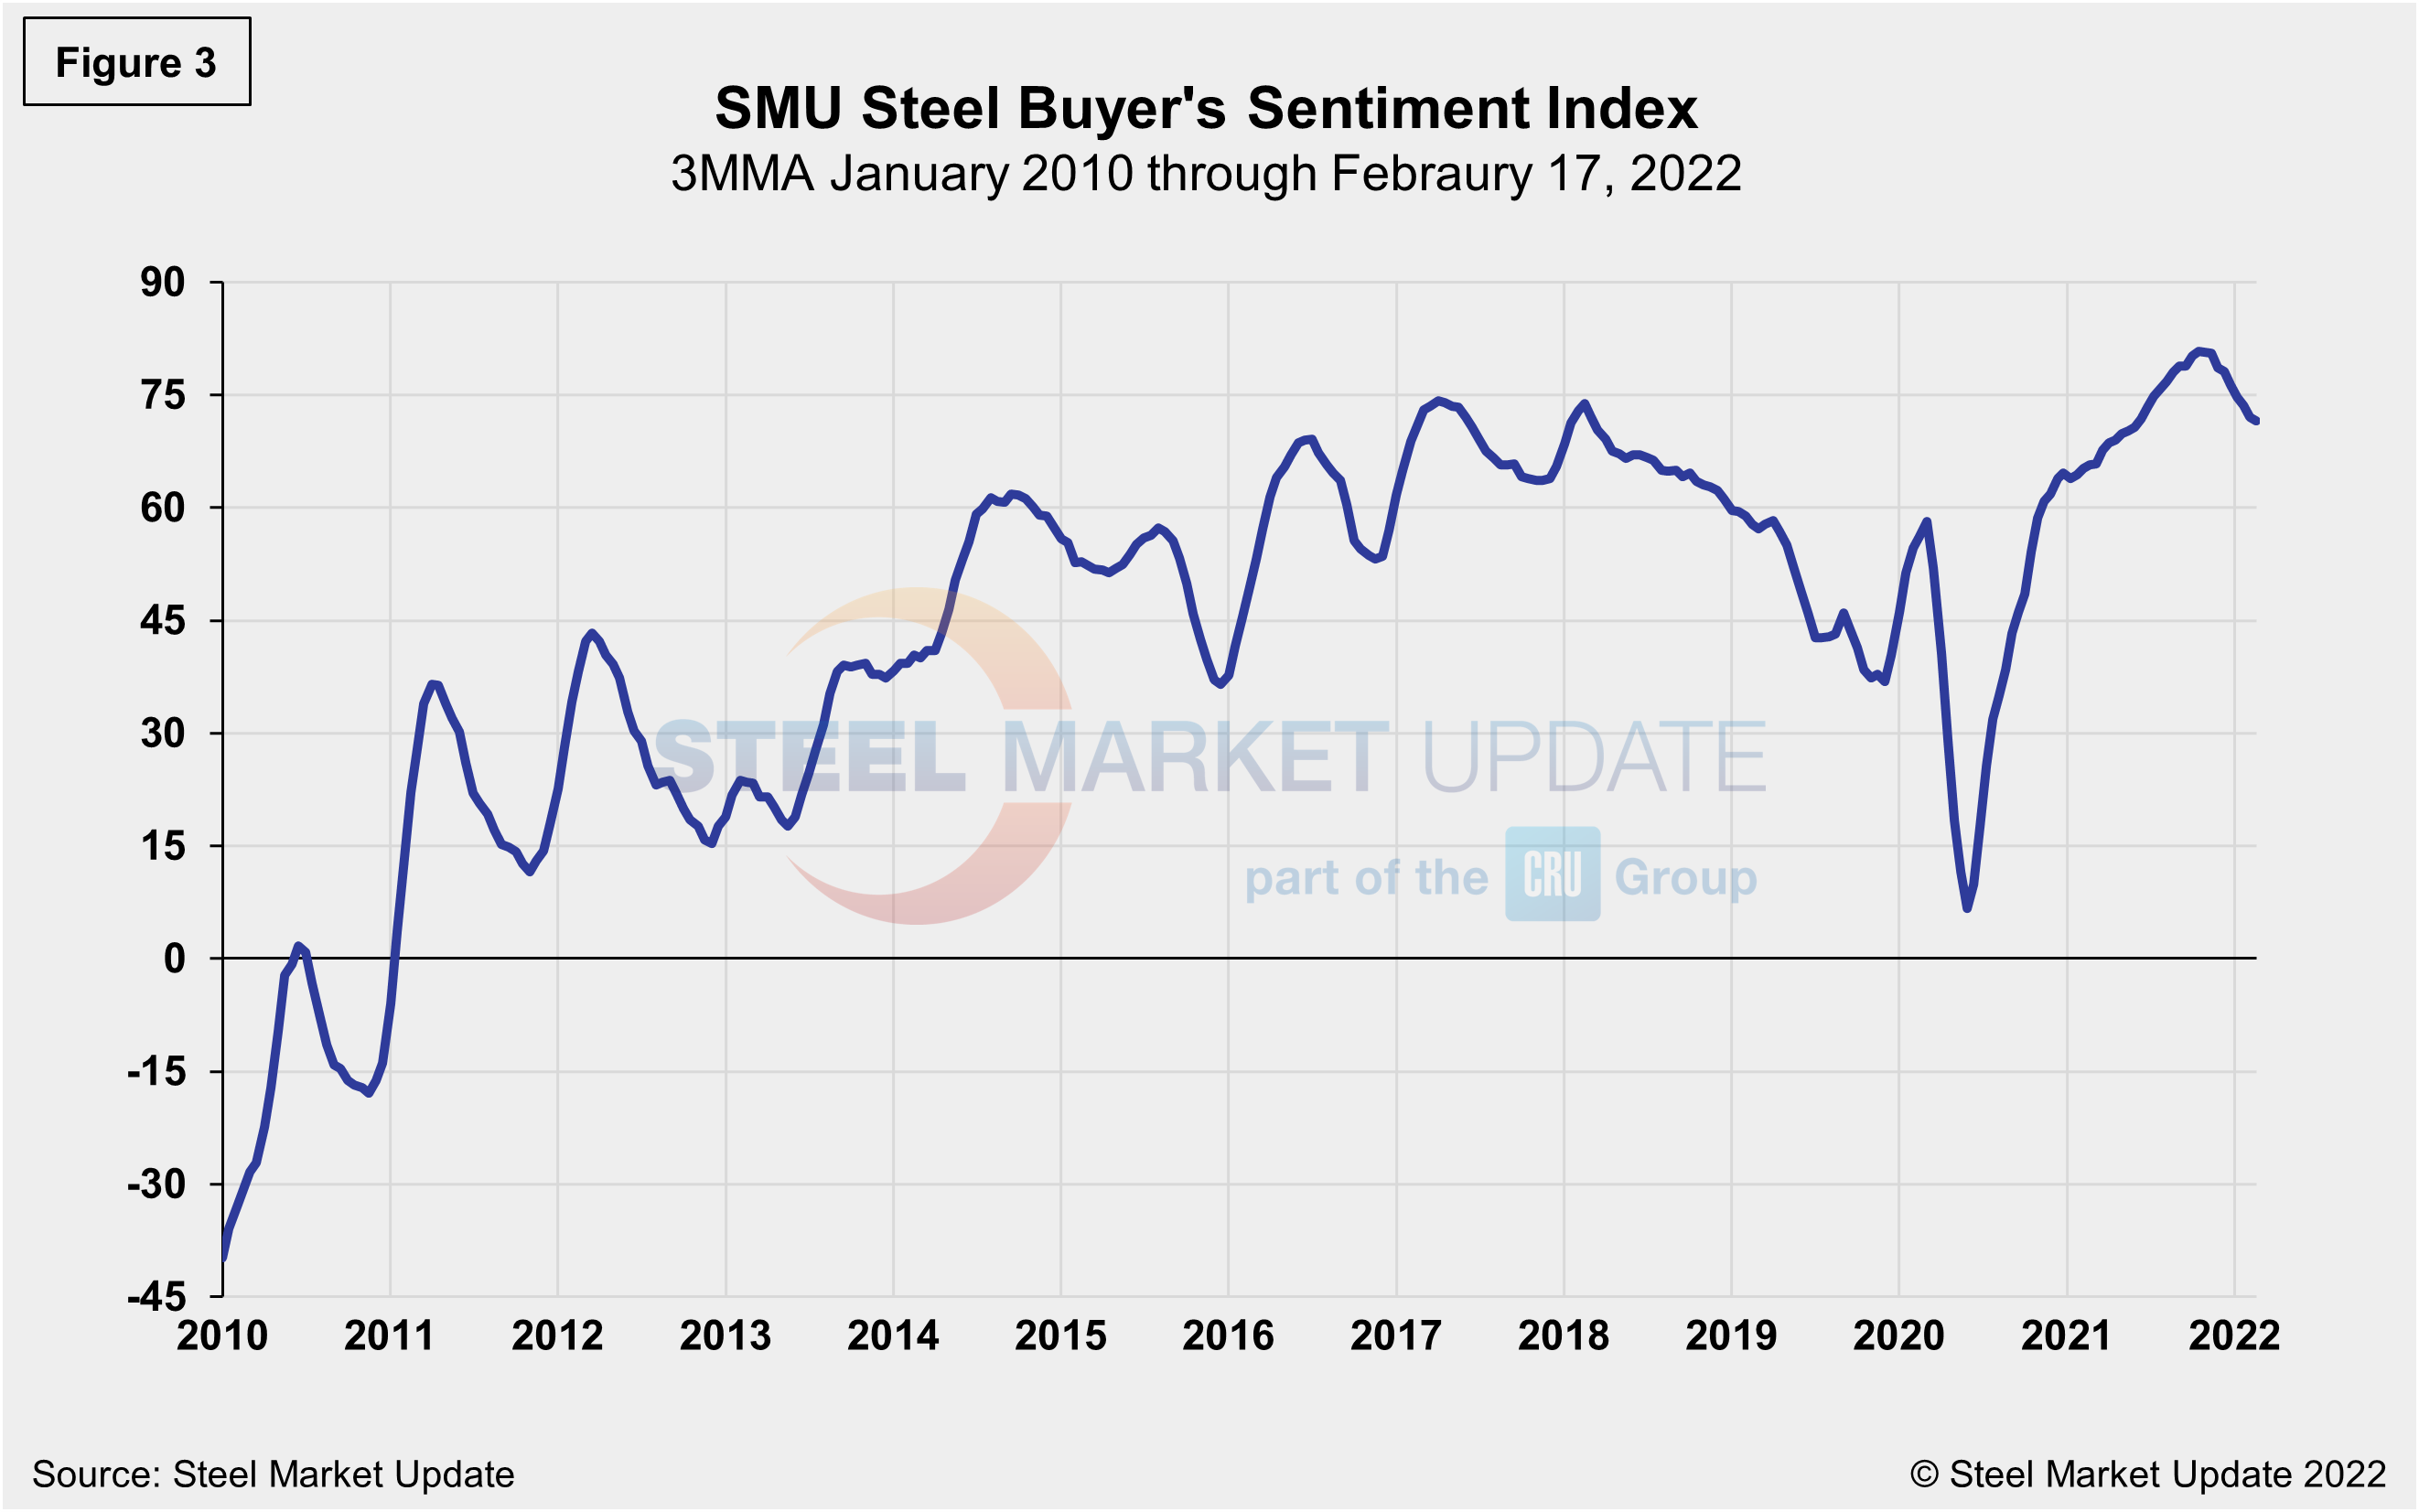
The SMU Steel Buyers Sentiment Index is a measure of the current attitude of North American steel buyers regarding their company’s chances for success in today’s market. The single value of the current sentiment index fell to -8 in early March 2020, a 66-point drop in just a month as the pandemic devastated the economy. It has since rebounded to a healthy +70 as of Feb. 17, but is still down from the high of +84 seen Sept. 2, 2021. Figure 3 shows the 3MMA of the index since 2010. A reading above the neutral point of zero indicates that buyers have a positive attitude about their prospects. Steady demand appears to be keeping the Steel Buyer’s Sentiment Index at a highly optimistic level despite the rapid price correction.
By David Schollaert, David@SteelMarketUpdate.com


