

Prices
February 17, 2022
HRC Futures: HRC Epic Short Squeeze above $1,600; Busheling Trades $800
Written by David Feldstein
Editor’s note: SMU Contributor David Feldstein is president of Rock Trading Advisors. Rock provides customers attached to the steel industry with commodity price risk management services and market intelligence. RTA is registered with the National Futures Association as a Commodity Trade Advisor. David has over 20 years of professional trading experience and has been active in the ferrous derivatives space since 2012.
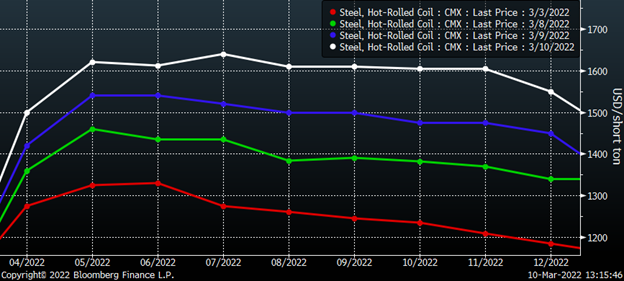
Much has changed since my last article only three weeks ago. On Feb. 17, I discussed how the Midwest HRC futures curve had shifted from being steeply backwardated through 2021 to a relatively flat curve. Since then, the curve has maintained its flat shape, but has rallied over $600 per ton for the months of May through December ’22.
CME HRC Futures Curve
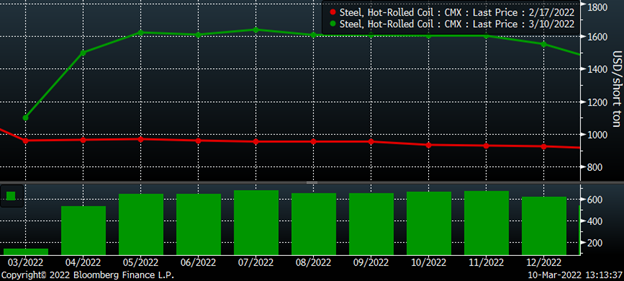
From last Thursday until Tuesday, the curve jumped $130 to $160 depending on the month. Then it jumped about $100 yesterday and another $100 today. The squeeze is on.
CME HRC Futures Curve
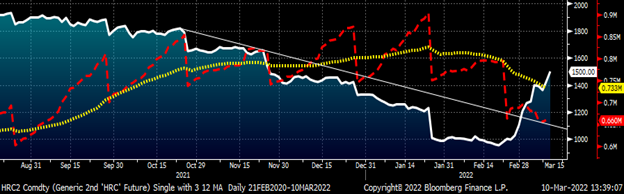
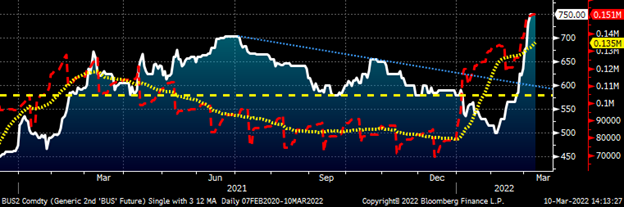
In the chart below of the rolling 2nd month Midwest HRC future (currently April), the red line is the aggregate open interest in short tons across all HRC futures months with a 22-day moving average in yellow. Open interest peaked in January and has continued to decline through the sharp rally of the past few weeks, which has blown through the down trend line dating back to last October. This appears to be evidence of shorts exiting their positions and, due to the sharp moves higher in the futures market, likely doing so unwillingly.
Rolling 2nd Month CME HRC Future
The CRU printing Midwest HRC at $957 this week while the April future settled today at $1,550 and May at $1,620 is baffling. Does the curve know something? Is it a reliable prediction of the future? Or is something else happening?
“Once upon a time, a woman was picking up firewood. She came upon a poisonous snake frozen in the snow. She took the snake home and nursed it back to health. One day the snake bit her on the cheek. As she lay dying, she asked the snake, ‘Why have you done this to me?’ And the snake answered, ‘Look, you knew I was a snake.’” – Natural Born Killers
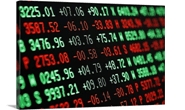
I took this snapshot of the market on Wednesday morning around 7 a.m. CST. Notice the net change in price and the volume circled in red. June up $123 on 20 tons, August up $138 on 120 tons, October up $119 on 20 tons and December up $156 on 20 tons. Is this someone covering their position? Of course not. Is it someone taking advantage of the illiquidity to squeeze the shorts? Bingo bango!
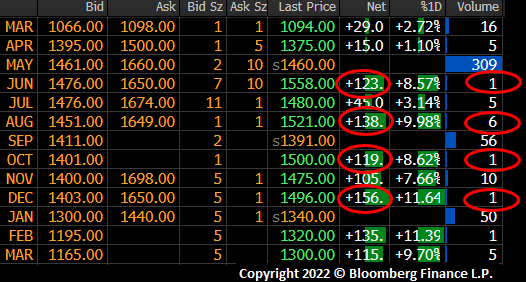
What is happening in HRC futures has nothing to do with fundamentals. This is a good-old-fashioned short squeeze. You force out the weakest short, they cover and in doing so push up the price further, which forces out the next weakest short that has to cover, driving the price higher for the next weakest short and so on. A little morning nudge on the futures $120 higher helps the squeeze get going like a strong cup of coffee. and then it’s on.
What if you could push up the market over $120 on 180 tons and then sell 10,000 tons at those levels?
Those commercial players long physical steel and hedging their tons by shorting futures wake up to the choice of sending millions to their clearing firm or buying back their short positions at these inflated values. They will make good money on their physical tons over the next 60-90 days, but the mark-to-market change in their account is immediate, leaving those lacking necessary capital in the crosshairs of the squeeze. I have my own opinions about this and suspect the participant selling thousands of tons to those being squeezed is the one bidding up the futures $120 on one lot.
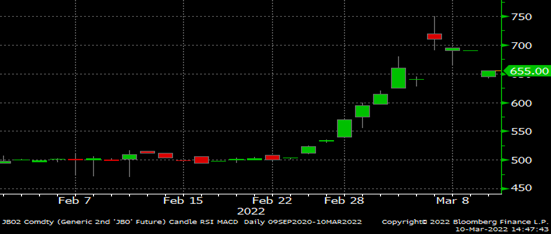
After breaking below $580, busheling traded to as low as $500. This coincided with record highs in open interest. With Russia and Ukraine accounting for roughly 60% of last year’s pig iron imports taken offline, busheling futures exploded higher. Yesterday, the May contract traded $800. The March physical scrap settlements have been opaque as little has transacted ahead of today’s settlement. Finally, yesterday, indications started to roll in with primes in the high $600s. The March CME busheling future settles at $703.54, up $183.53.
Rolling 2nd Mo. Busheling Future
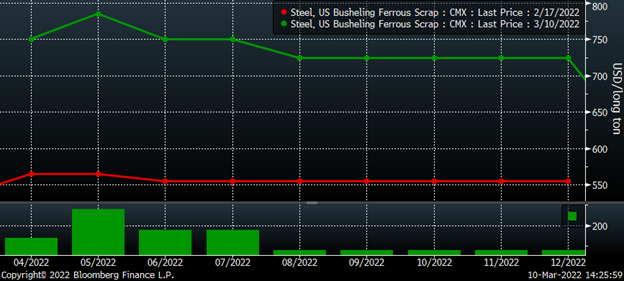
The April through July busheling futures have jumped $185, $220, $195 and $195 since Feb. 17.
CME Busheling Futures Curve
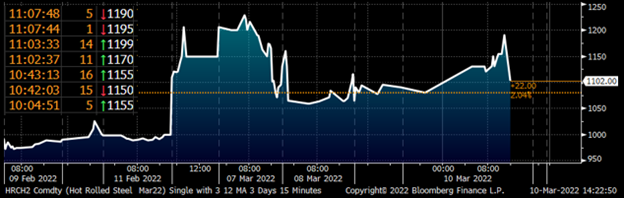
Famed economist John Maynard Keynes said, “Markets can stay irrational longer than you can stay solvent.” The March HRC future traded to as high as $1,238 on Monday. Then, today, the March contract traded to as high as $1,199 with Wednesday’s $957 CRU print being the big difference between the two days. If next week’s CRU is $1,200 (+$243) and that is followed by $1,350 (+$150) with the final March print at $1,500 (+$150), the average would be $1,188. Why would anyone pay $1,199? How can this be explained? In my opinion, it was a forced liquidation. If an account is unable to meet their margin call, the clearing firm goes out and buys back the position regardless of what is reasonable or not. Time is of the essence for the clearing firm.
March CME HRC Future
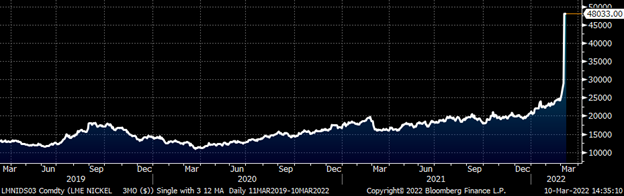
Commodities crash up. From wheat to crude oil to nickel and across commodities, the last couple weeks have brought historical price moves forcing unbelievably exorbitant margin calls. Exchanges and clearing firms have increased margin requirements across product lines with trading in LME nickel suspended.
3-Month LME Nickel
Buy the rumor, sell the news…
![]()
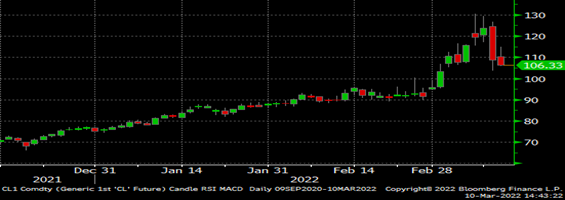
Shortly after the Biden administration announced the U.S would ban imports of Russian oil, gas and energy products, WTI crude oil, diesel and gasoline futures turned lower with crude trading back and forth between $120 and $130/bbl.
Yesterday, Ukrainian President Zelensky’s comments during an interview with a German newspaper prompted further selling that has continued through today with crude trading $106/bbl in the late afternoon.
![]()
Front Month CME WTI Crude Oil Future
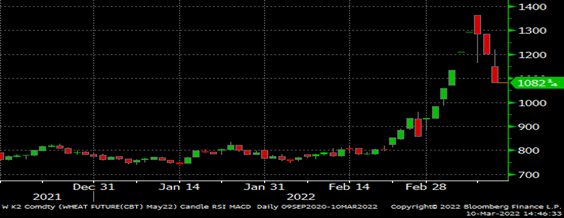
Wheat futures also turned lower since peaking on Tuesday…
May CME Wheat Future
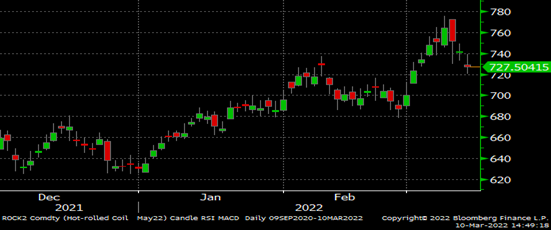
As has the Turkish scrap future…
Rolling 2nd Month LME Turkish Scrap Future
Same with the Chinese HRC future…
May Chinese HRC Future $/st
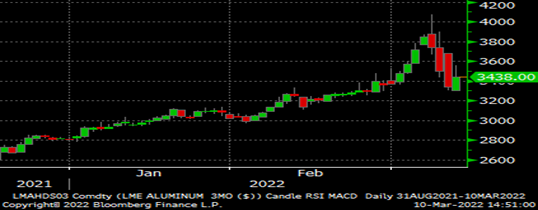
And aluminum.
3-Month LME Aluminum
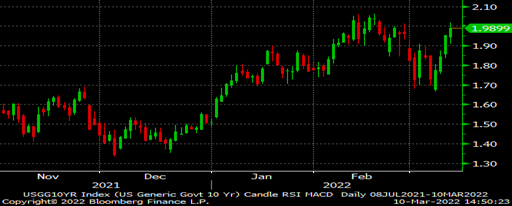
Meanwhile, the U.S. Treasury rate has rebounded from a low of 1.66% on Monday to 1.99% today.
U.S. 10-Year Treasury Rate
Has the Russian-induced commodity fever broken or is it simply taking a pause? If so, will the unrelenting rally in Midwest HRC and busheling futures follow these other commodity markets’ lead?
I’m always looking for historical parallels to better understand what is and what will happen moving forward. For those in the steel and manufacturing industries, the knee-jerk response to the COVID outbreak was to raise cash, cancel orders, destock, etc. For investors, it was aggressive risk-off selling equities and buying Treasuries. This caused dislocations in physical and financial markets with the Federal Reserve and other central banks flooding their economies with liquidity. What followed was massive long-lasting rallies across asset classes, especially commodities.
I wonder if we might see a similar outcome on the commodities front as we did post-COVID, but in reverse. In the weeks following the COVID outbreak, markets dumped commodities with HRC trading into the high $400s, busheling to $220 and oil at one point trading -$40/bbl! Since then, HRC traded above $1,800, busheling $800 and oil as high as $130.50/bbl. In the weeks prior to and since the Russian invasion of Ukraine, the knee-jerk reaction has been epic rallies across commodities with many hitting new all-time highs, while liquidity has been drained out of Russia over the past two weeks. Will history repeat along the same path and will the knee-jerk reaction higher be followed by two years of declines to new lows?
Disclaimer: The content of this article is for informational purposes only. The views in this article do not represent financial services or advice. Any opinion expressed by Feldstein should not be treated as a specific inducement to make a particular investment or follow a particular strategy, but only as an expression of his opinion. Views and forecasts expressed are as of date indicated, are subject to change without notice, may not come to be and do not represent a recommendation or offer of any particular security, strategy or investment. Strategies mentioned may not be suitable for you. You must make an independent decision regarding investments or strategies mentioned in this article. It is recommended you consider your own particular circumstances and seek the advice from a financial professional before taking action in financial markets.


