

Market Data

May 12, 2022
Energy Market: High Prices, Moderate Drilling, Lower Stocks
Written by Brett Linton
The Energy Information Administration’s May Short-Term Energy Outlook (STEO) remains subject to a high level of uncertainty due to Russia’s invasion of Ukraine. Regarding price forecasts, the EIA continues to warn that “actual price outcomes will largely depend on the degree to which existing sanctions imposed on Russia, any potential future sanctions, and independent corporate actions affect Russia’s oil production or the sale of Russia’s oil in the global market.”
Spot Prices
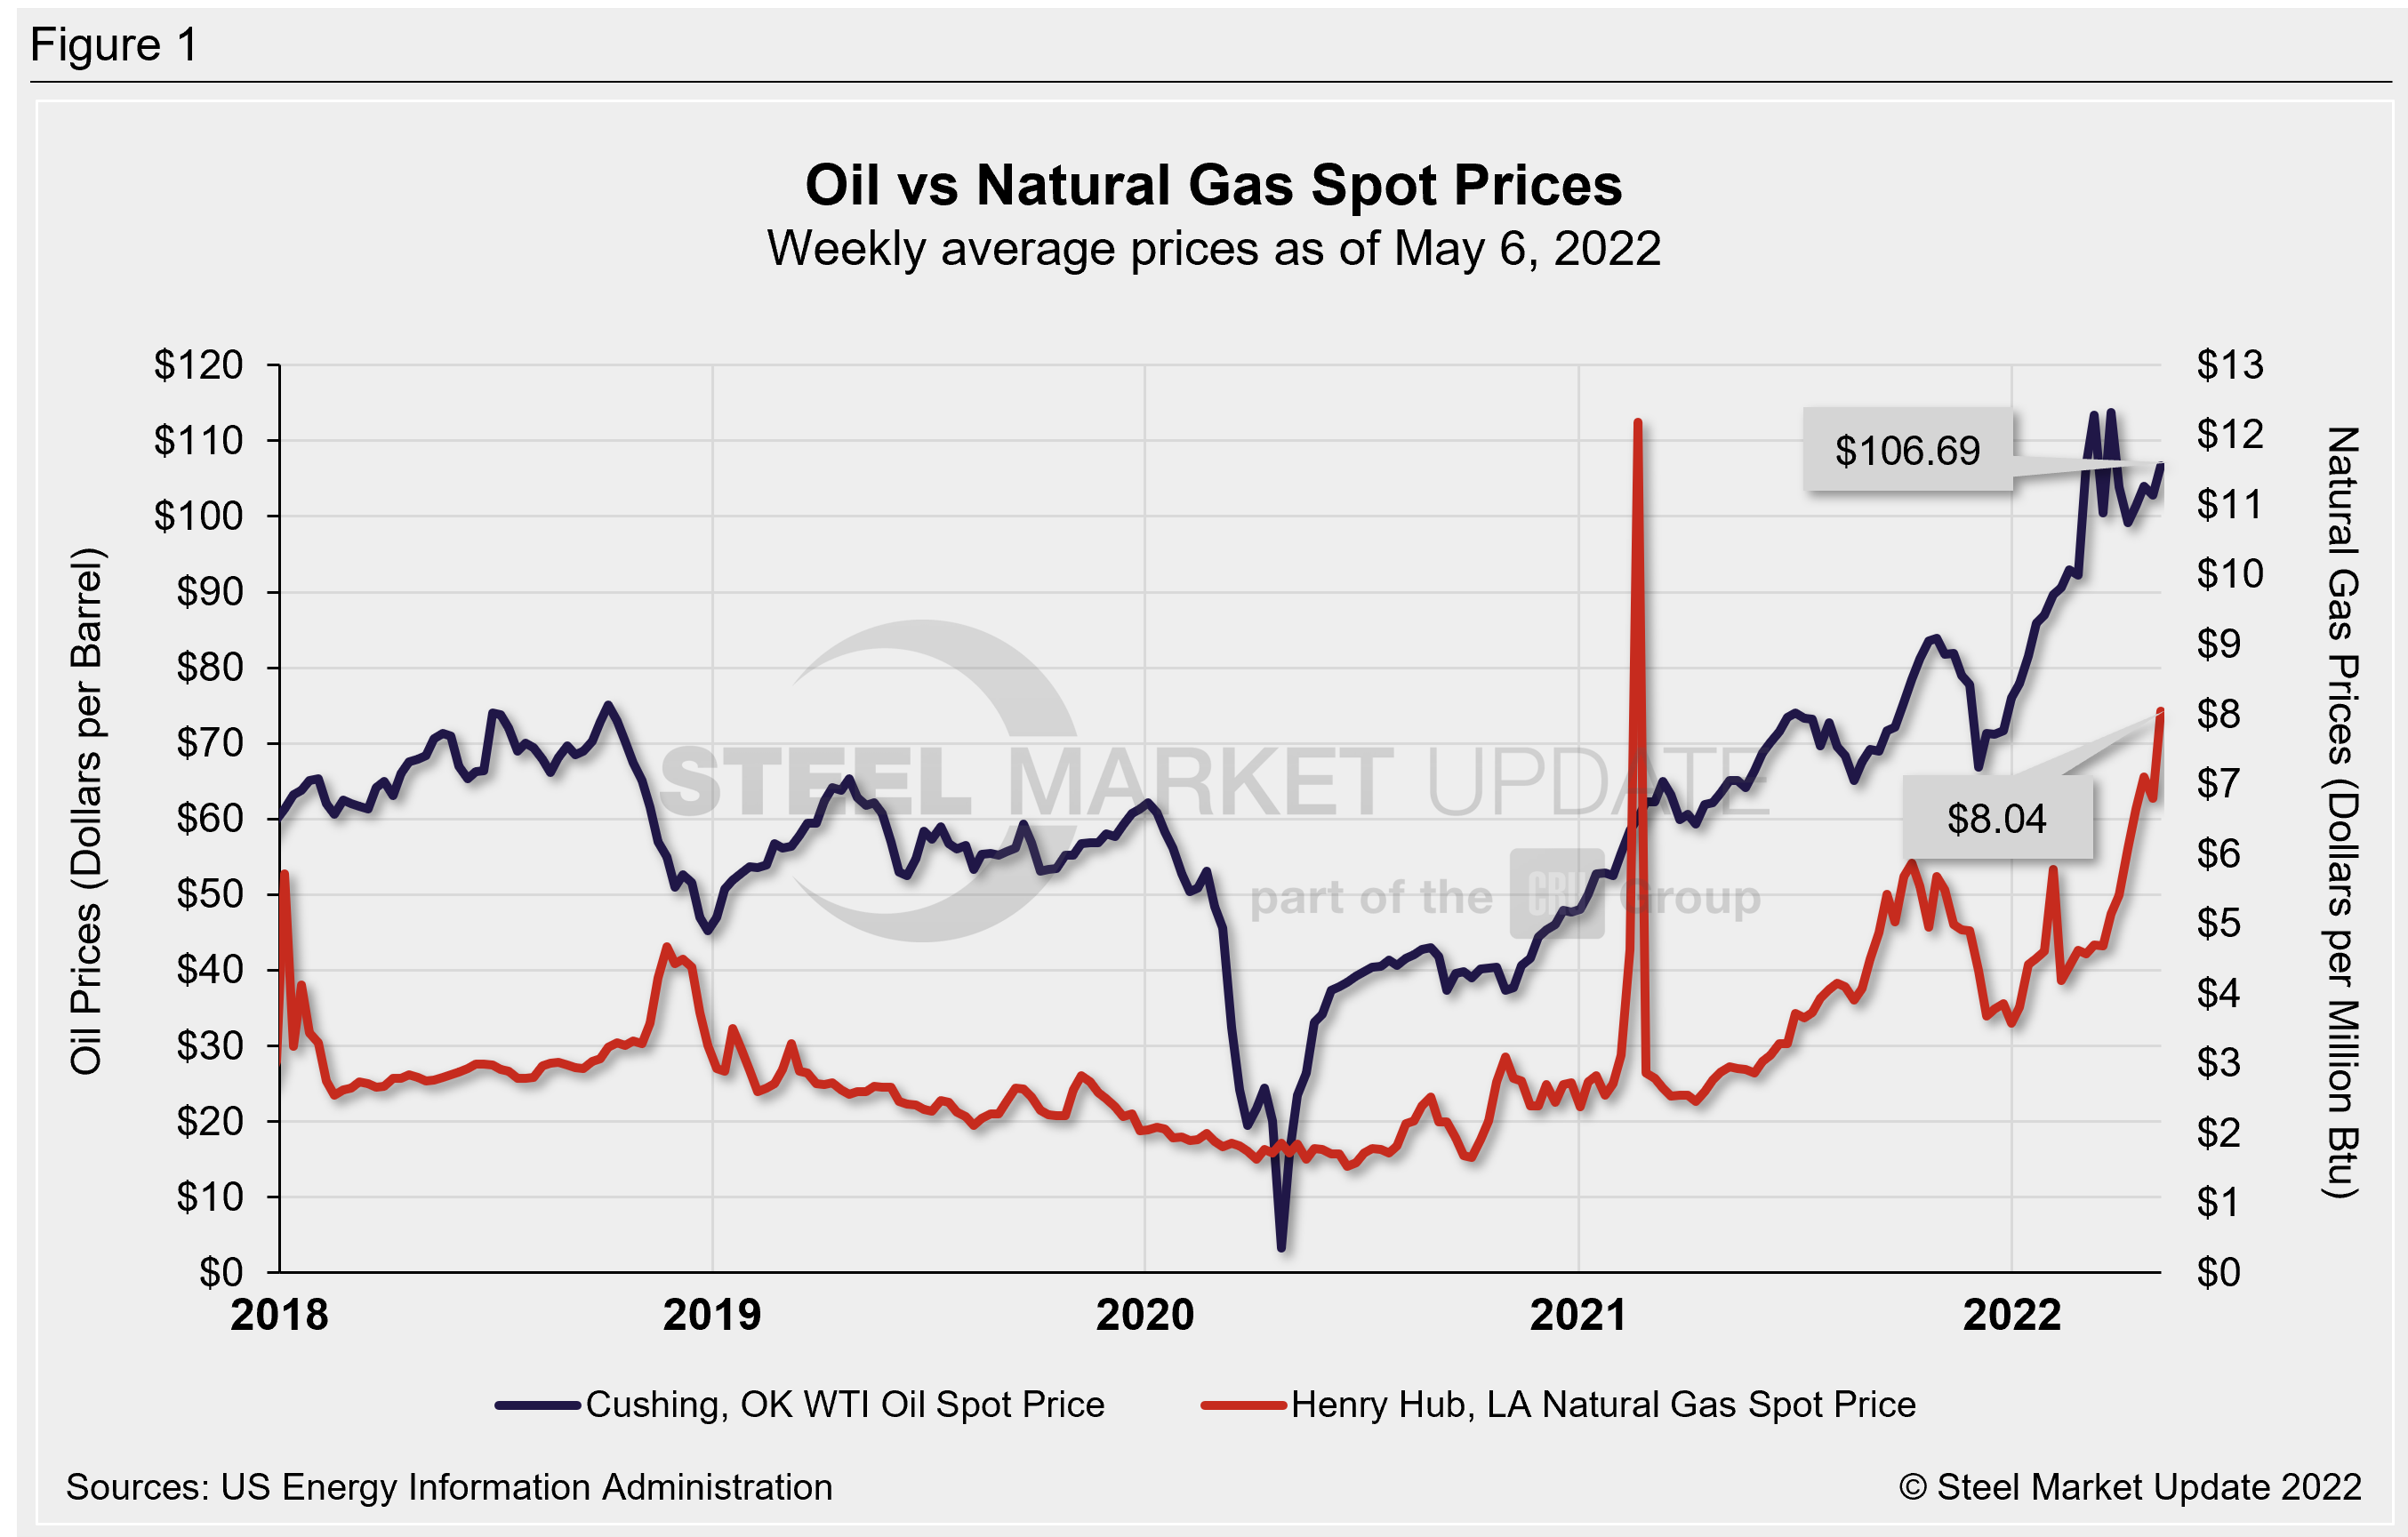
The spot market price for West Texas Intermediate (WTI) was at $106.69 per barrel as of May 6 (Figure 1), a six-week high. Recall that spot prices reached a high of $113.69/b on March 25, the highest weekly level since Aug. 2008. The EIA now expects spot prices to average $107/b in the second quarter of 2022, $103/b in the second half of this year, and $97/b in 2023. (Again, the agency emphasized that these forecasts were highly uncertain).
Natural gas prices eased through mid-March but are now surging upward again. The spot price as of May 6 was $8.04 per MMBTU (Million British Thermal Units), the highest level since Aug. 2008. (We are excluding high spot prices in Feb. 2021 resulting from winter storms and supply scarcity). EIA expects natural gas prices to average $7.83/MMBTU in the second quarter and $8.59/MMBTU for the full year in 2022.
Rig Counts
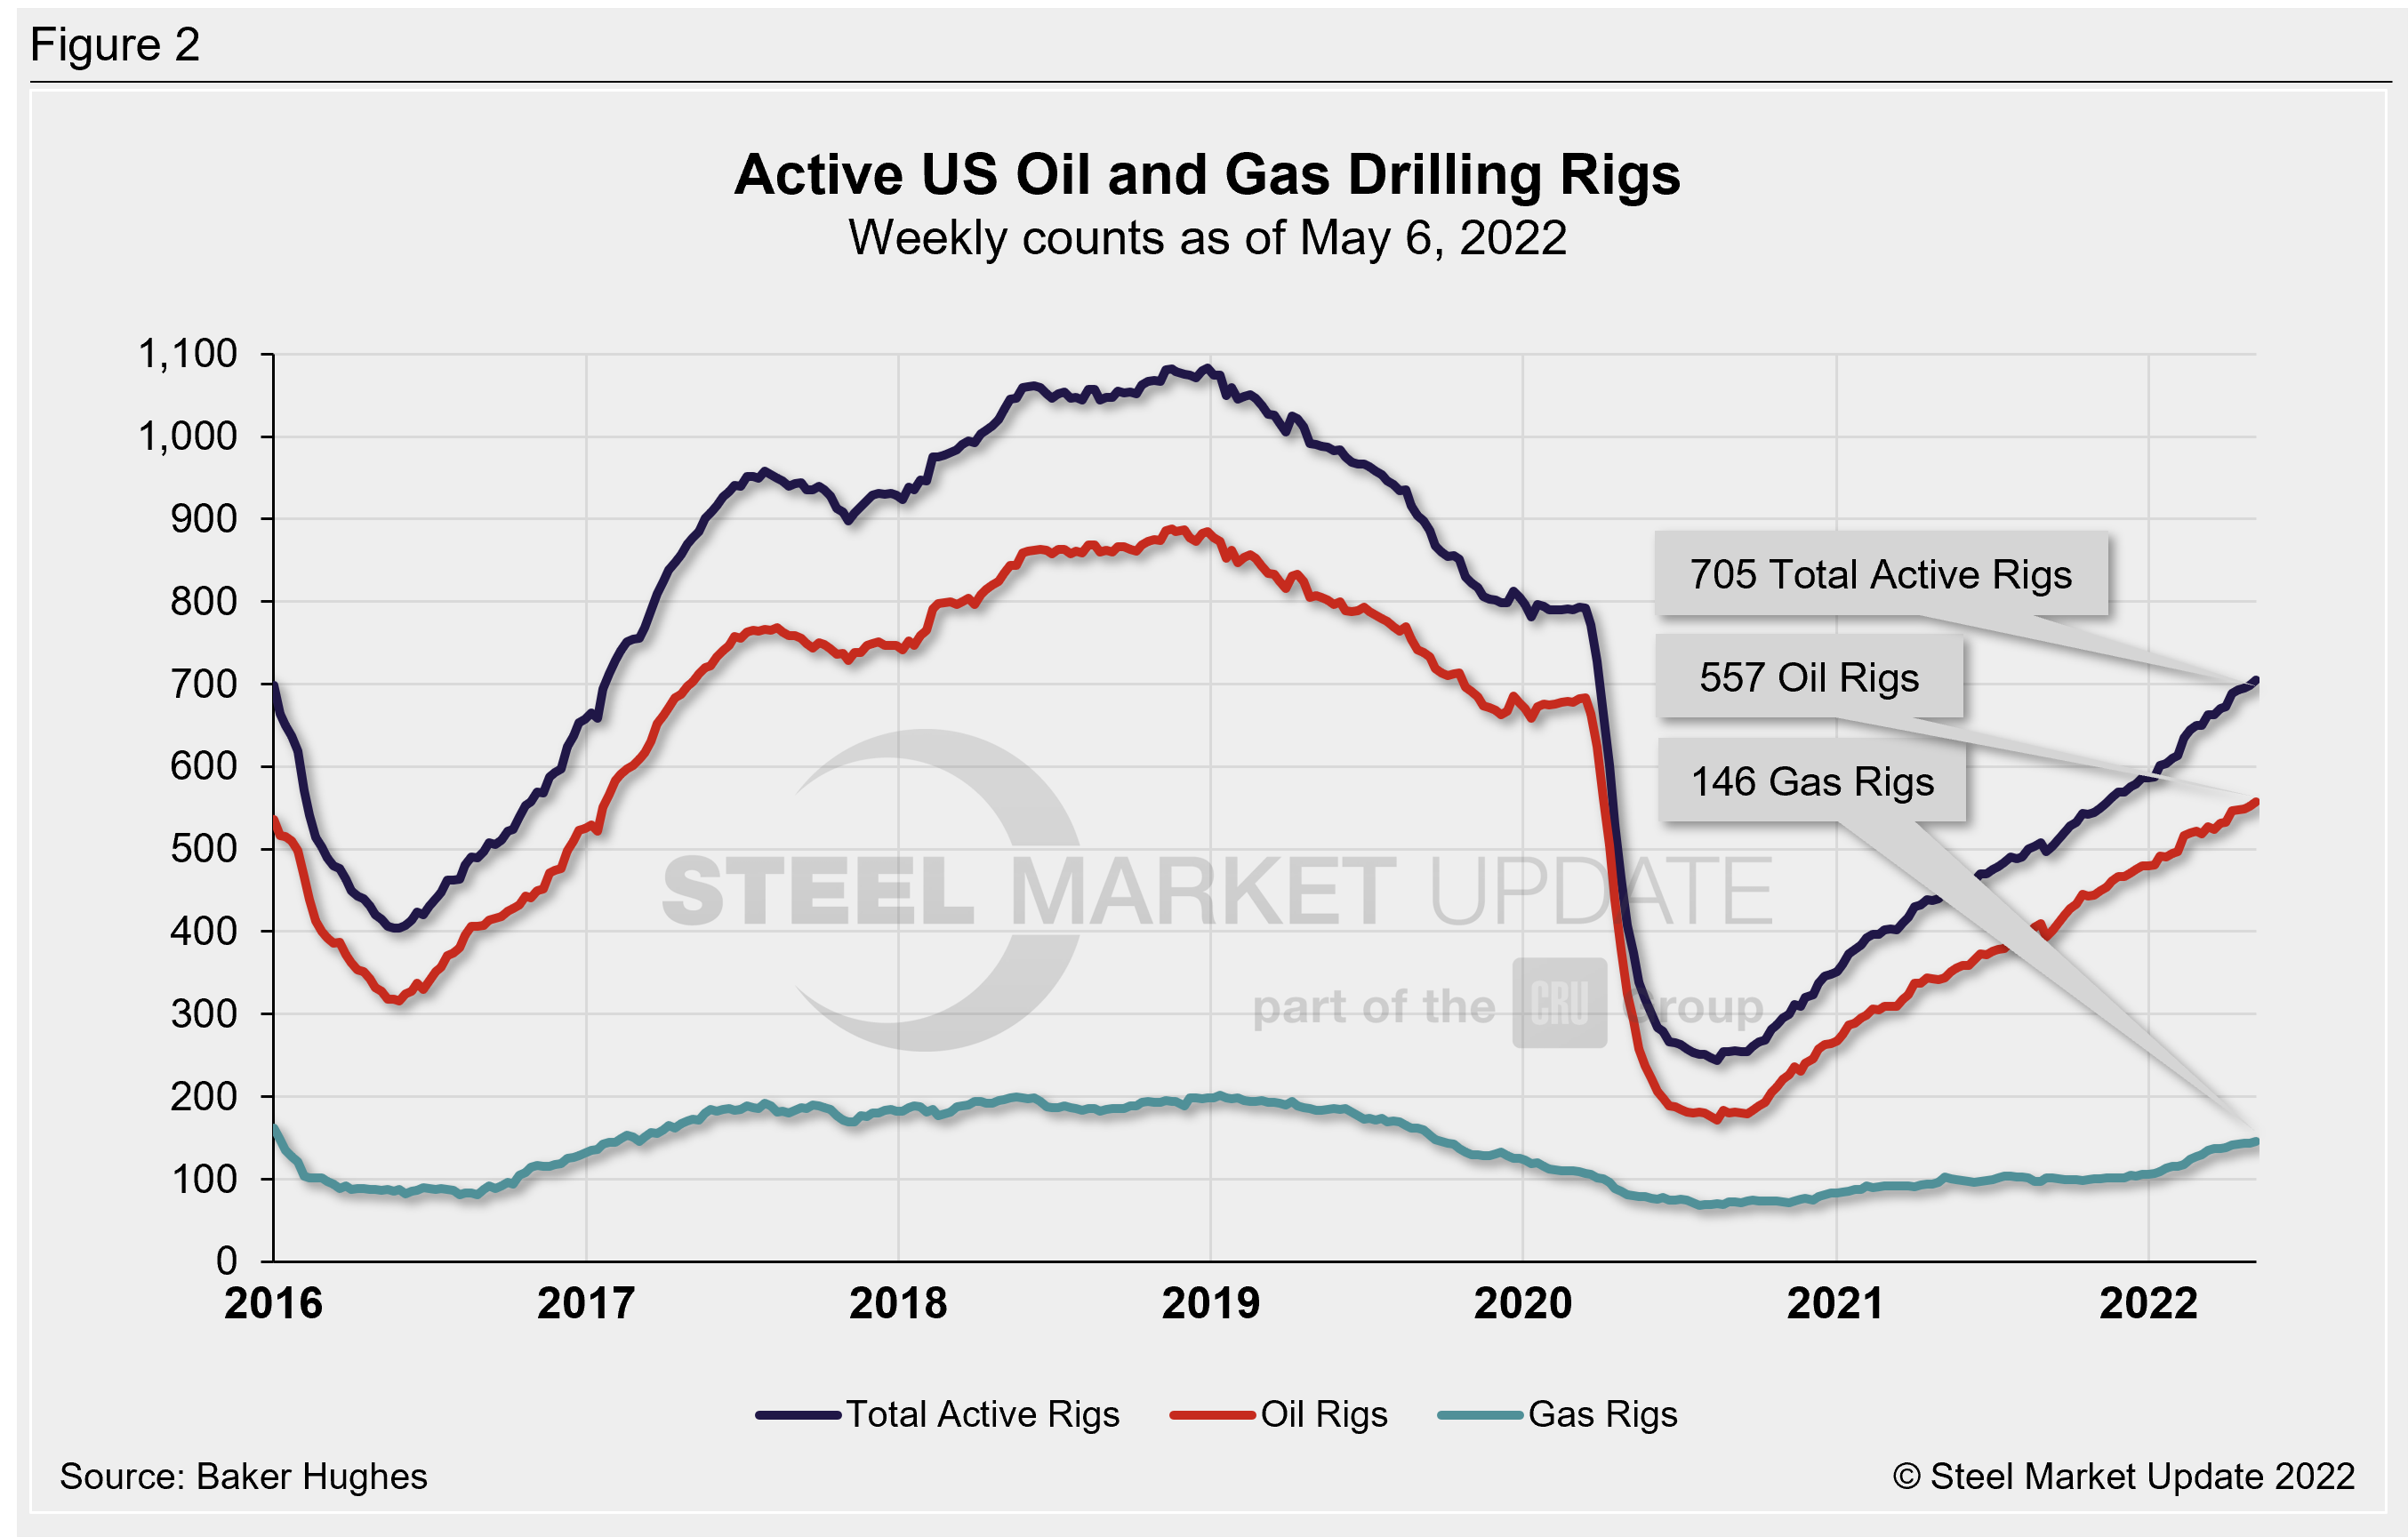
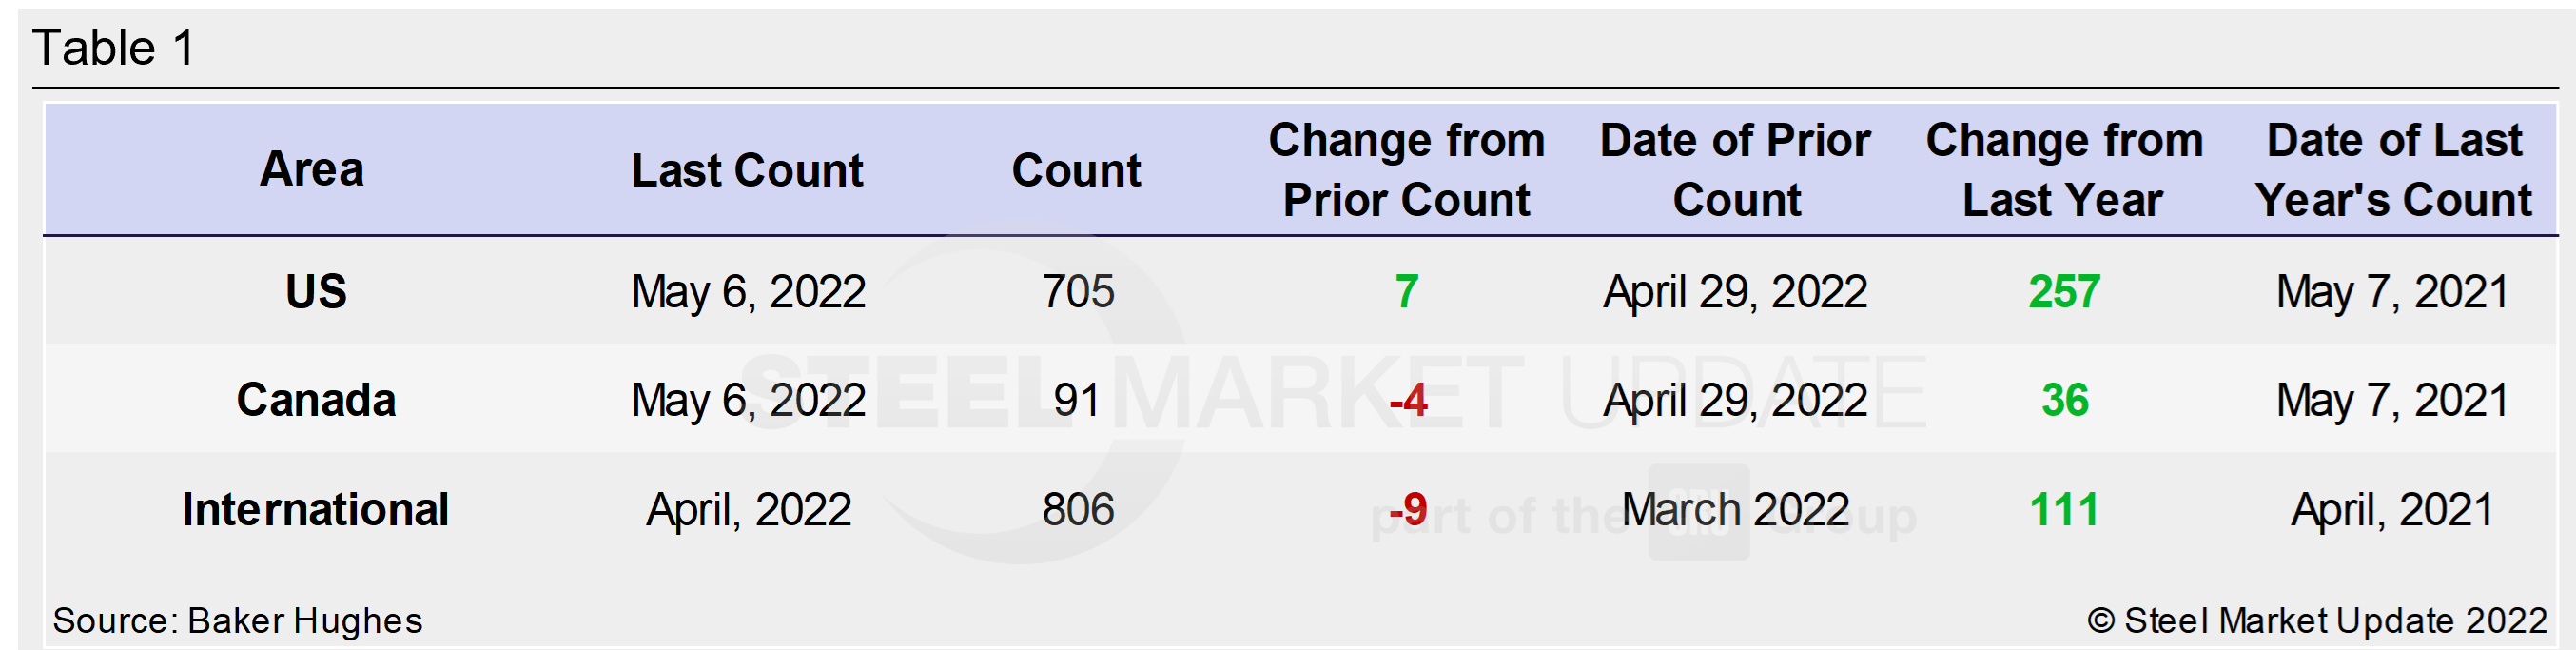
The number of active US oil and gas drill rigs continues to slowly recover from mid-2020 lows. The latest count was 705 active drill rigs as of the end of last week, comprised of 557 oil rigs, 146 gas rigs, and 2 miscellaneous rigs, according to Baker Hughes (Figure 2). Active drill rigs are 11% below March 2020, which was just prior to widespread coronavirus shutdowns. The table below compares the current US, Canadian and international rig counts to historical levels.
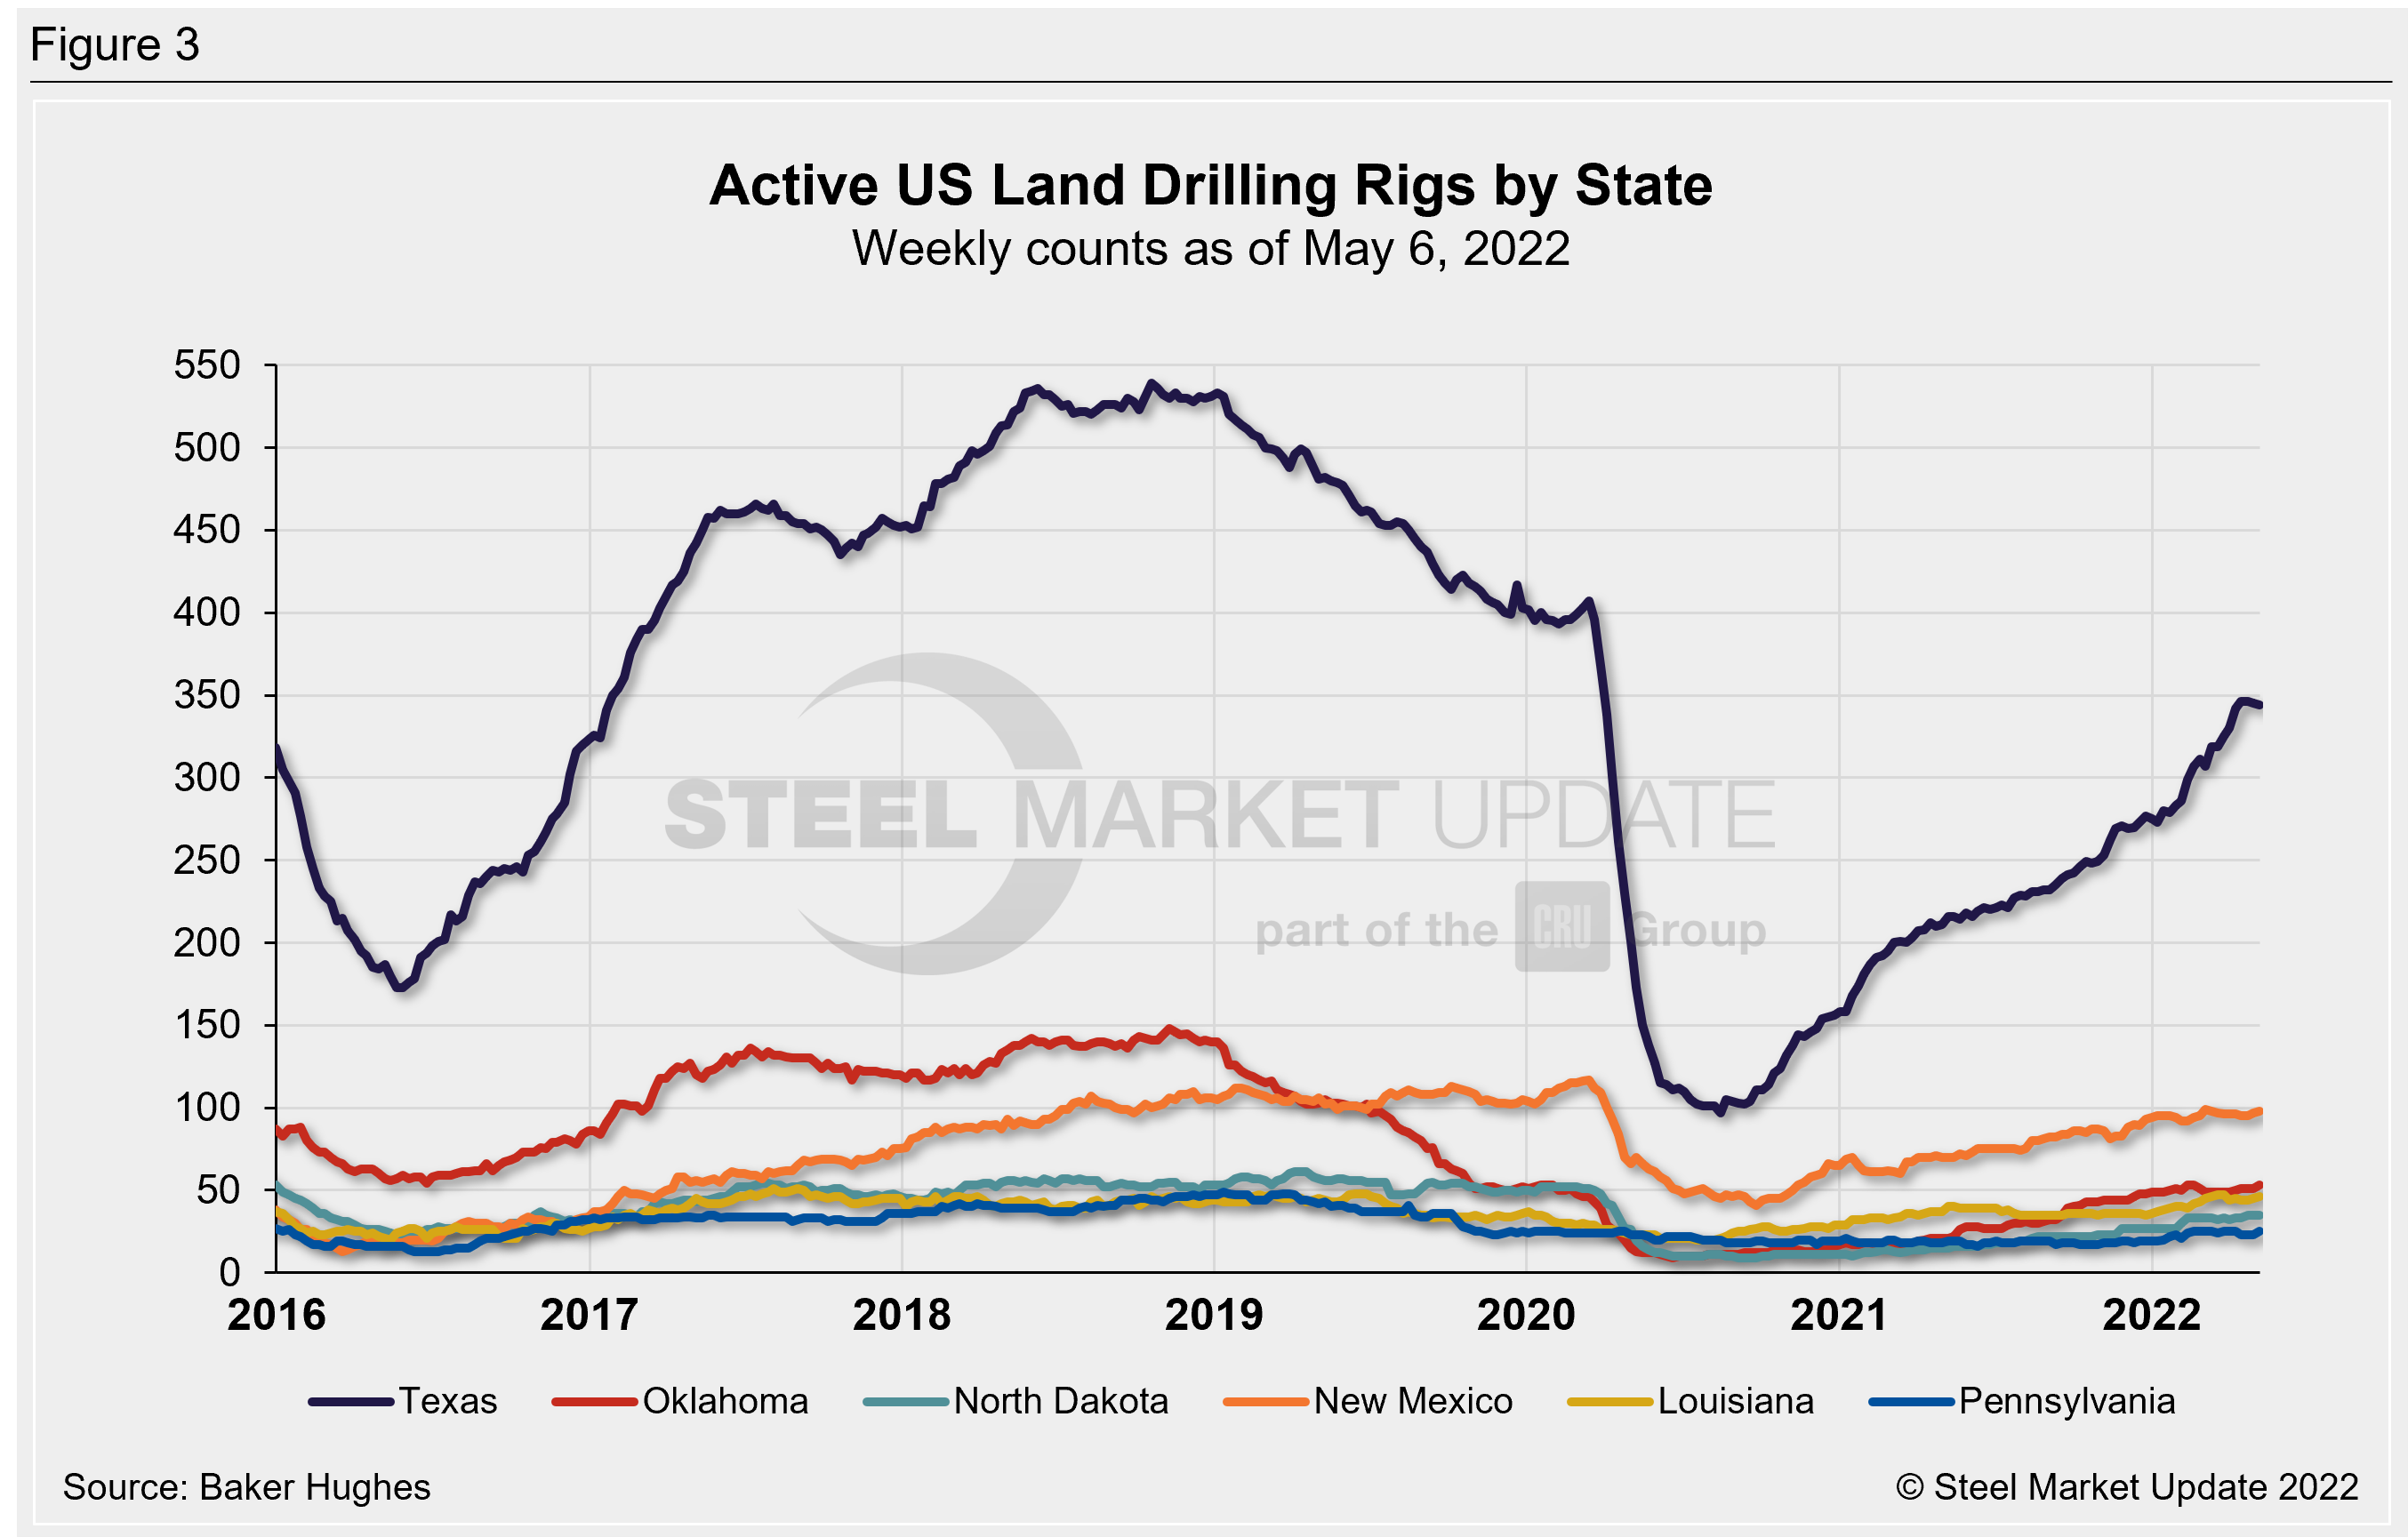
US oil and gas production are heavily concentrated in Texas, Oklahoma, North Dakota and New Mexico. As of May 6, production was steadily increasing but was still down as much as 35% compared to pre-Covid levels (Figure 3). Texas is the most active state with 344 rigs in operation, and New Mexico is the second highest with 98 rigs. Recall that Texas rigs had plummeted 76% back in 2020, falling from 407 in April to 97 rigs in August.
Stock Levels
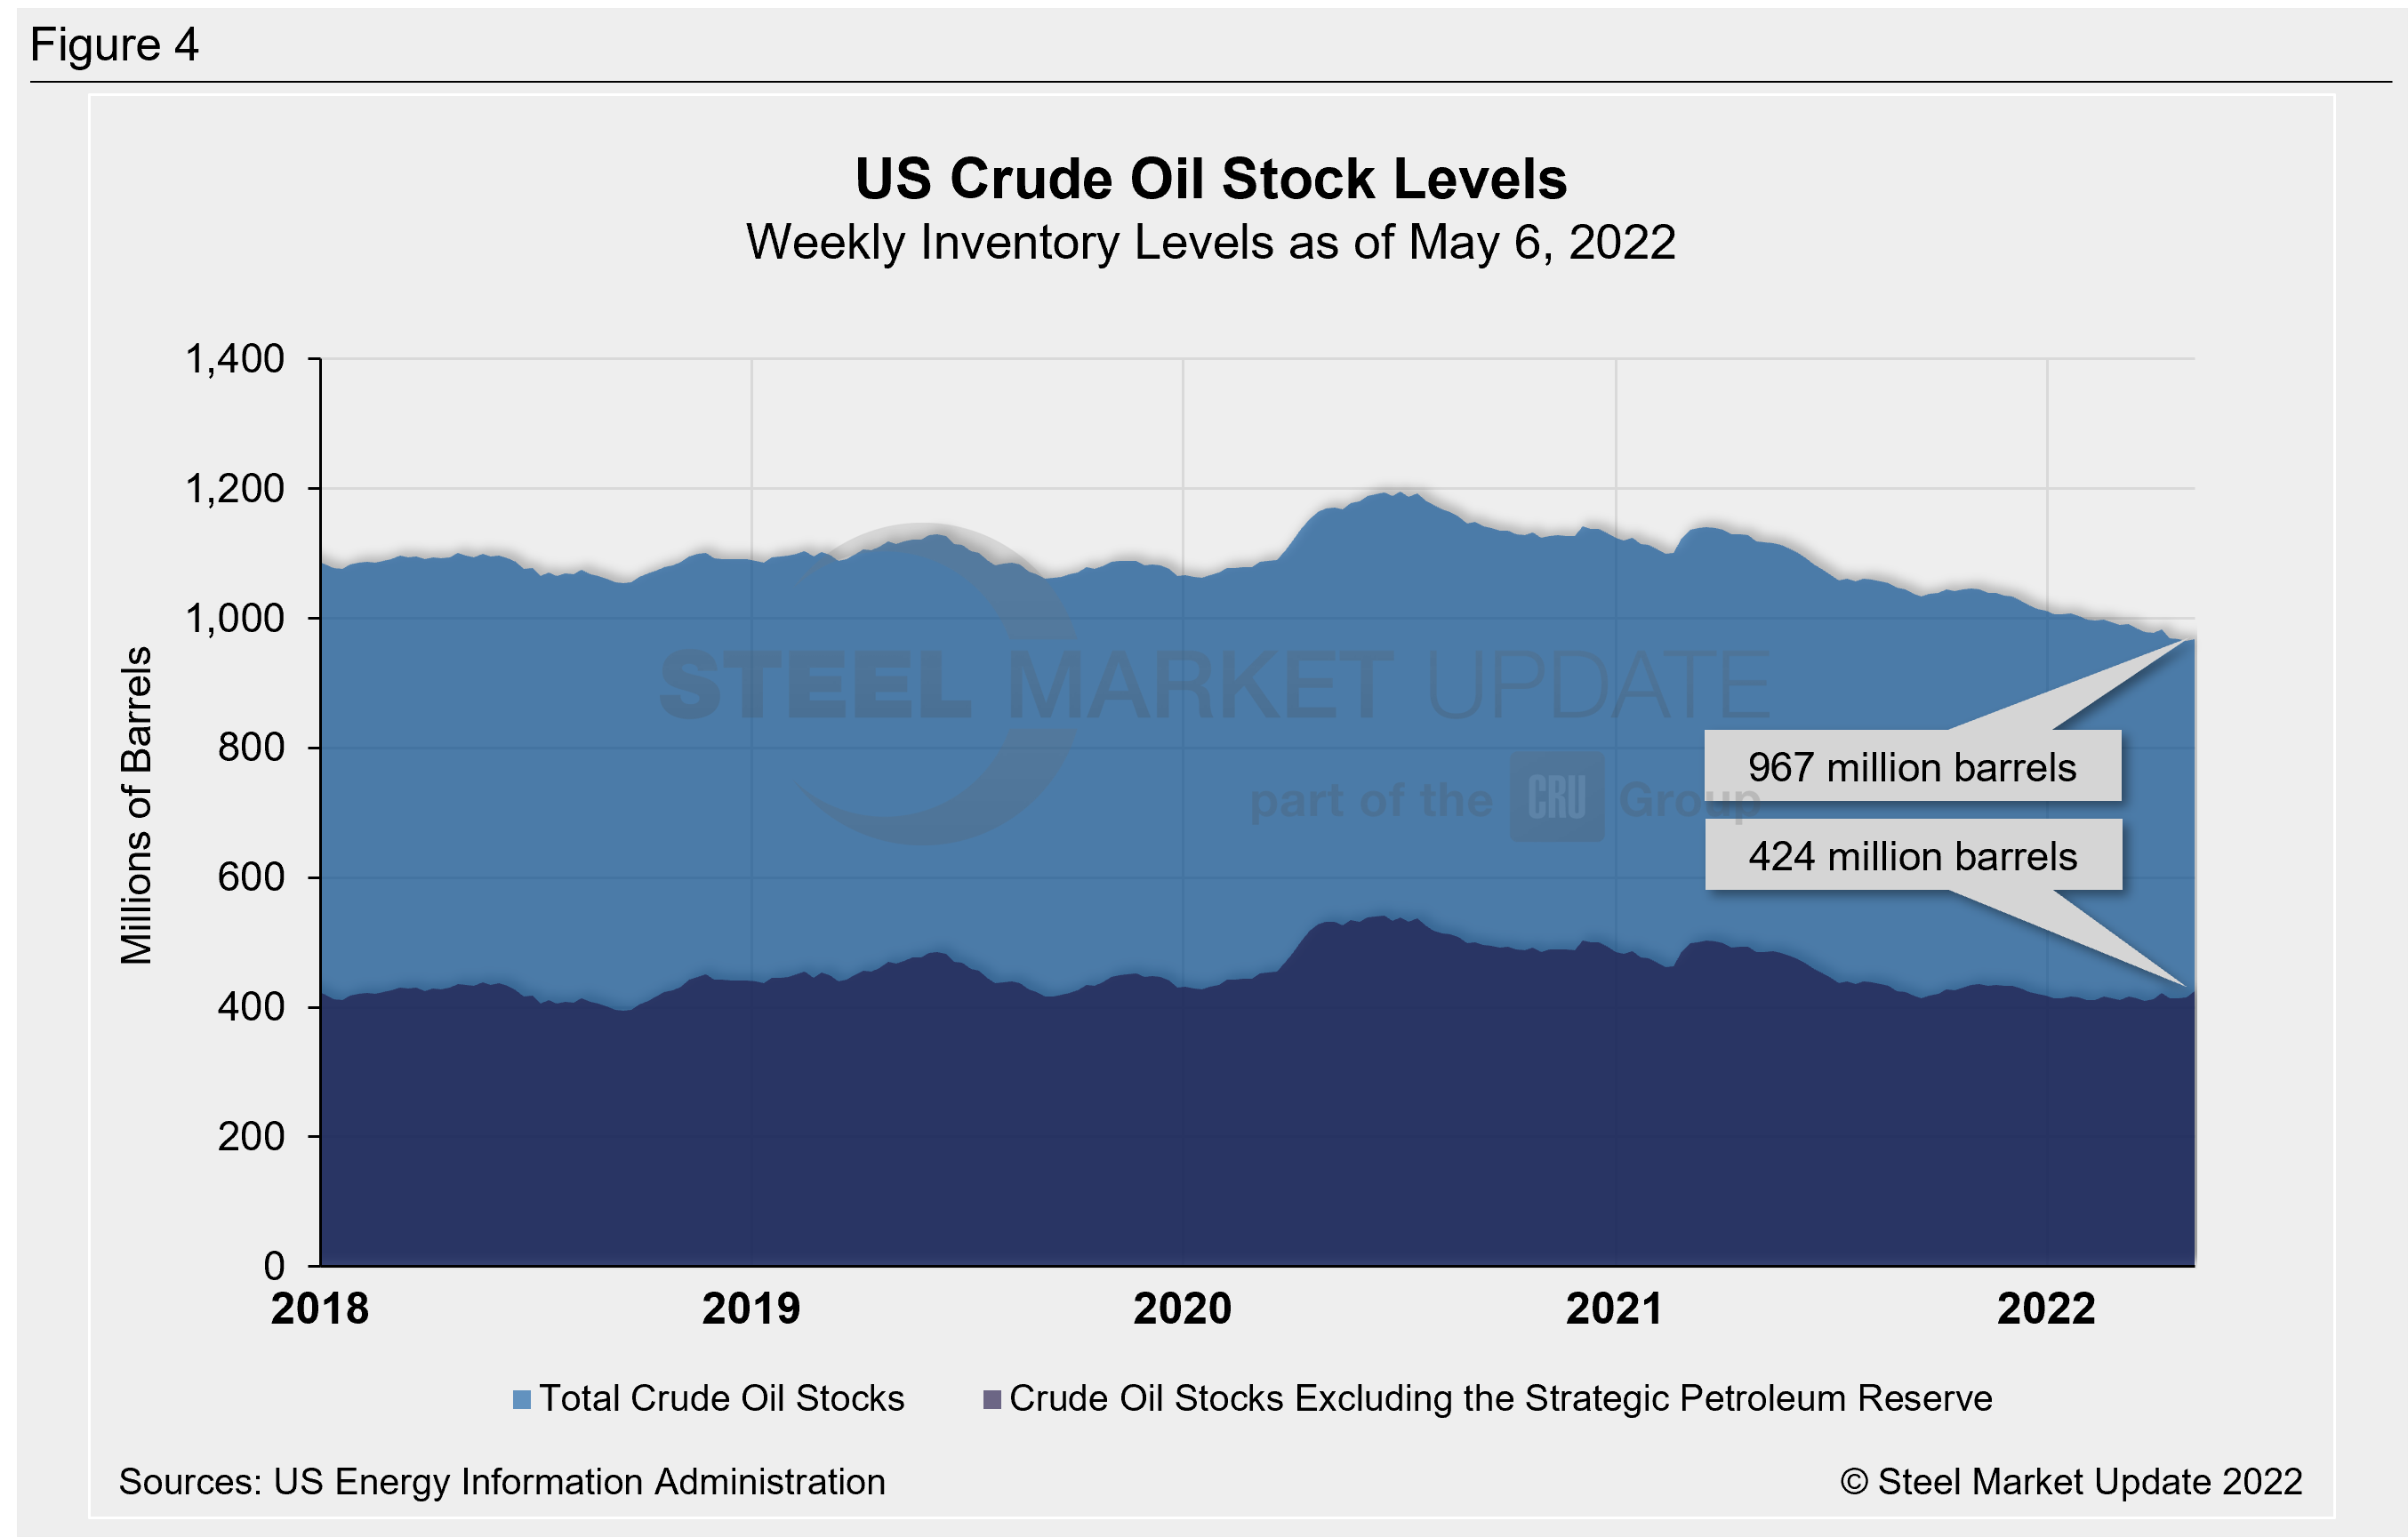
US total crude oil stocks continue to decline from mid-2020 highs, falling to a 14-year low of 966 million barrels on April 29. Since then, stock levels have increased slightly to 967 million barrels as of May 6. (That is still the second lowest level in the past 14 years.) That figure is down from 1.117 billion barrels from one year ago (Figure 4).
Trends in energy prices and rig counts are a predictor of demand for oil country tubular goods (OCTG), line pipe and other steel products.
By Brett Linton, Brett@SteelMarketUpdate.com


