

Market Data

June 9, 2022
SMU Survey: Respondents Beat Forecasts in May, Concerned About June
Written by Michael Cowden
May was a good month for market participants surveyed by SMU, most of whom reported meeting or beating expectations then.
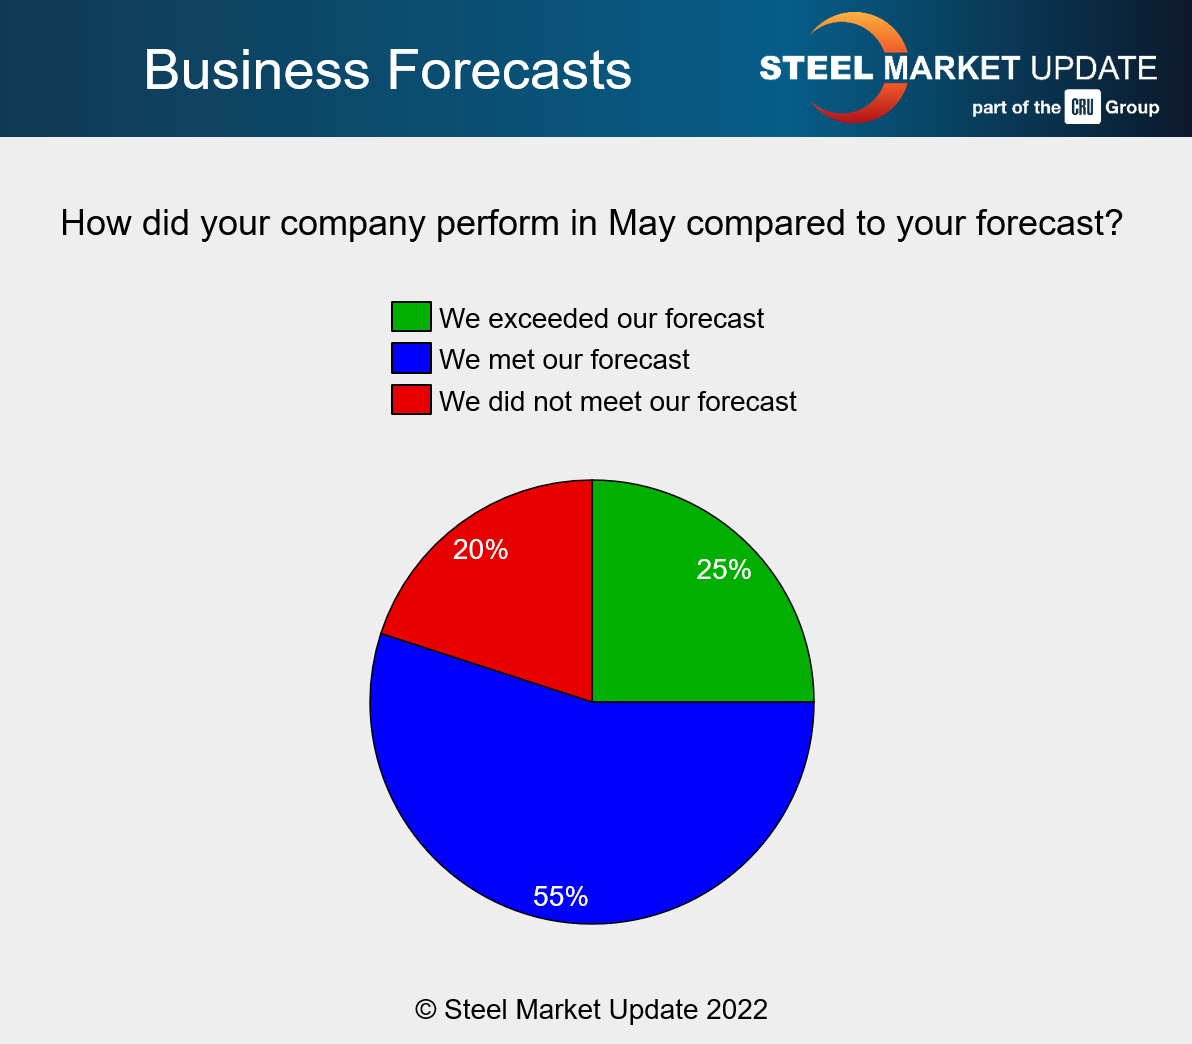
Approximately 55% of survey respondents said they met their business forecasts last month, 25% said they exceeded them, and only 20% said they missed forecast.
The big question will be June, which has seen steel price declines accelerate amid increasing concerns about demand and the broader economy.
The chart below comes from a new question that we’ve introduced to our survey, full results of which will be released on Friday. We’ll update it on a regular basis going forward.
Here is what some survey participants had to say about the issue of beating, meeting or missing forecasts.
“Exceeded volume targets.”
“We were able to pass on the price increases.”
“It was a good month, but as Jamie Dimon might say, the hurricane is here”
“Several large customers pushed back or reduced their forecasts”
“Slowed down end of month.”
“Forecast softened, orders moved out.”
“Logistics problems were our main reason” for not meeting forecast.
“Missed by over 10%.”
Editor’s note: JPMorgan Chase CEO Jamie Dimon said at an investor conference earlier this month that economic conditions might seem “fine” now but that “a hurricane” was coming. “You’d better brace yourself,” he said. “JPMorgan is bracing ourselves, and we’re going to be very conservative with our balance sheet.”
By Michael Cowden, Michael@SteelMarketUpdate.com


