

Market Data

June 17, 2022
Energy Market Analysis through June
Written by Brett Linton
The Energy Information Administration’s June Short-Term Energy Outlook (STEO) remains subject to a high level of uncertainty due to factors such as sanctions affecting Russia’s oil production, the production decisions of OPEC (Organization of the Petroleum Exporting Countries), and the rate at which US producers increase drilling. Due to these uncertainties, the EIA continues to warn that actual price outcomes could vary substantially from their forecasts.
In this Premium analysis we cover oil and natural gas prices, North American drilling rig activity, active drill rigs by state, and US crude oil stock levels.
Spot Prices
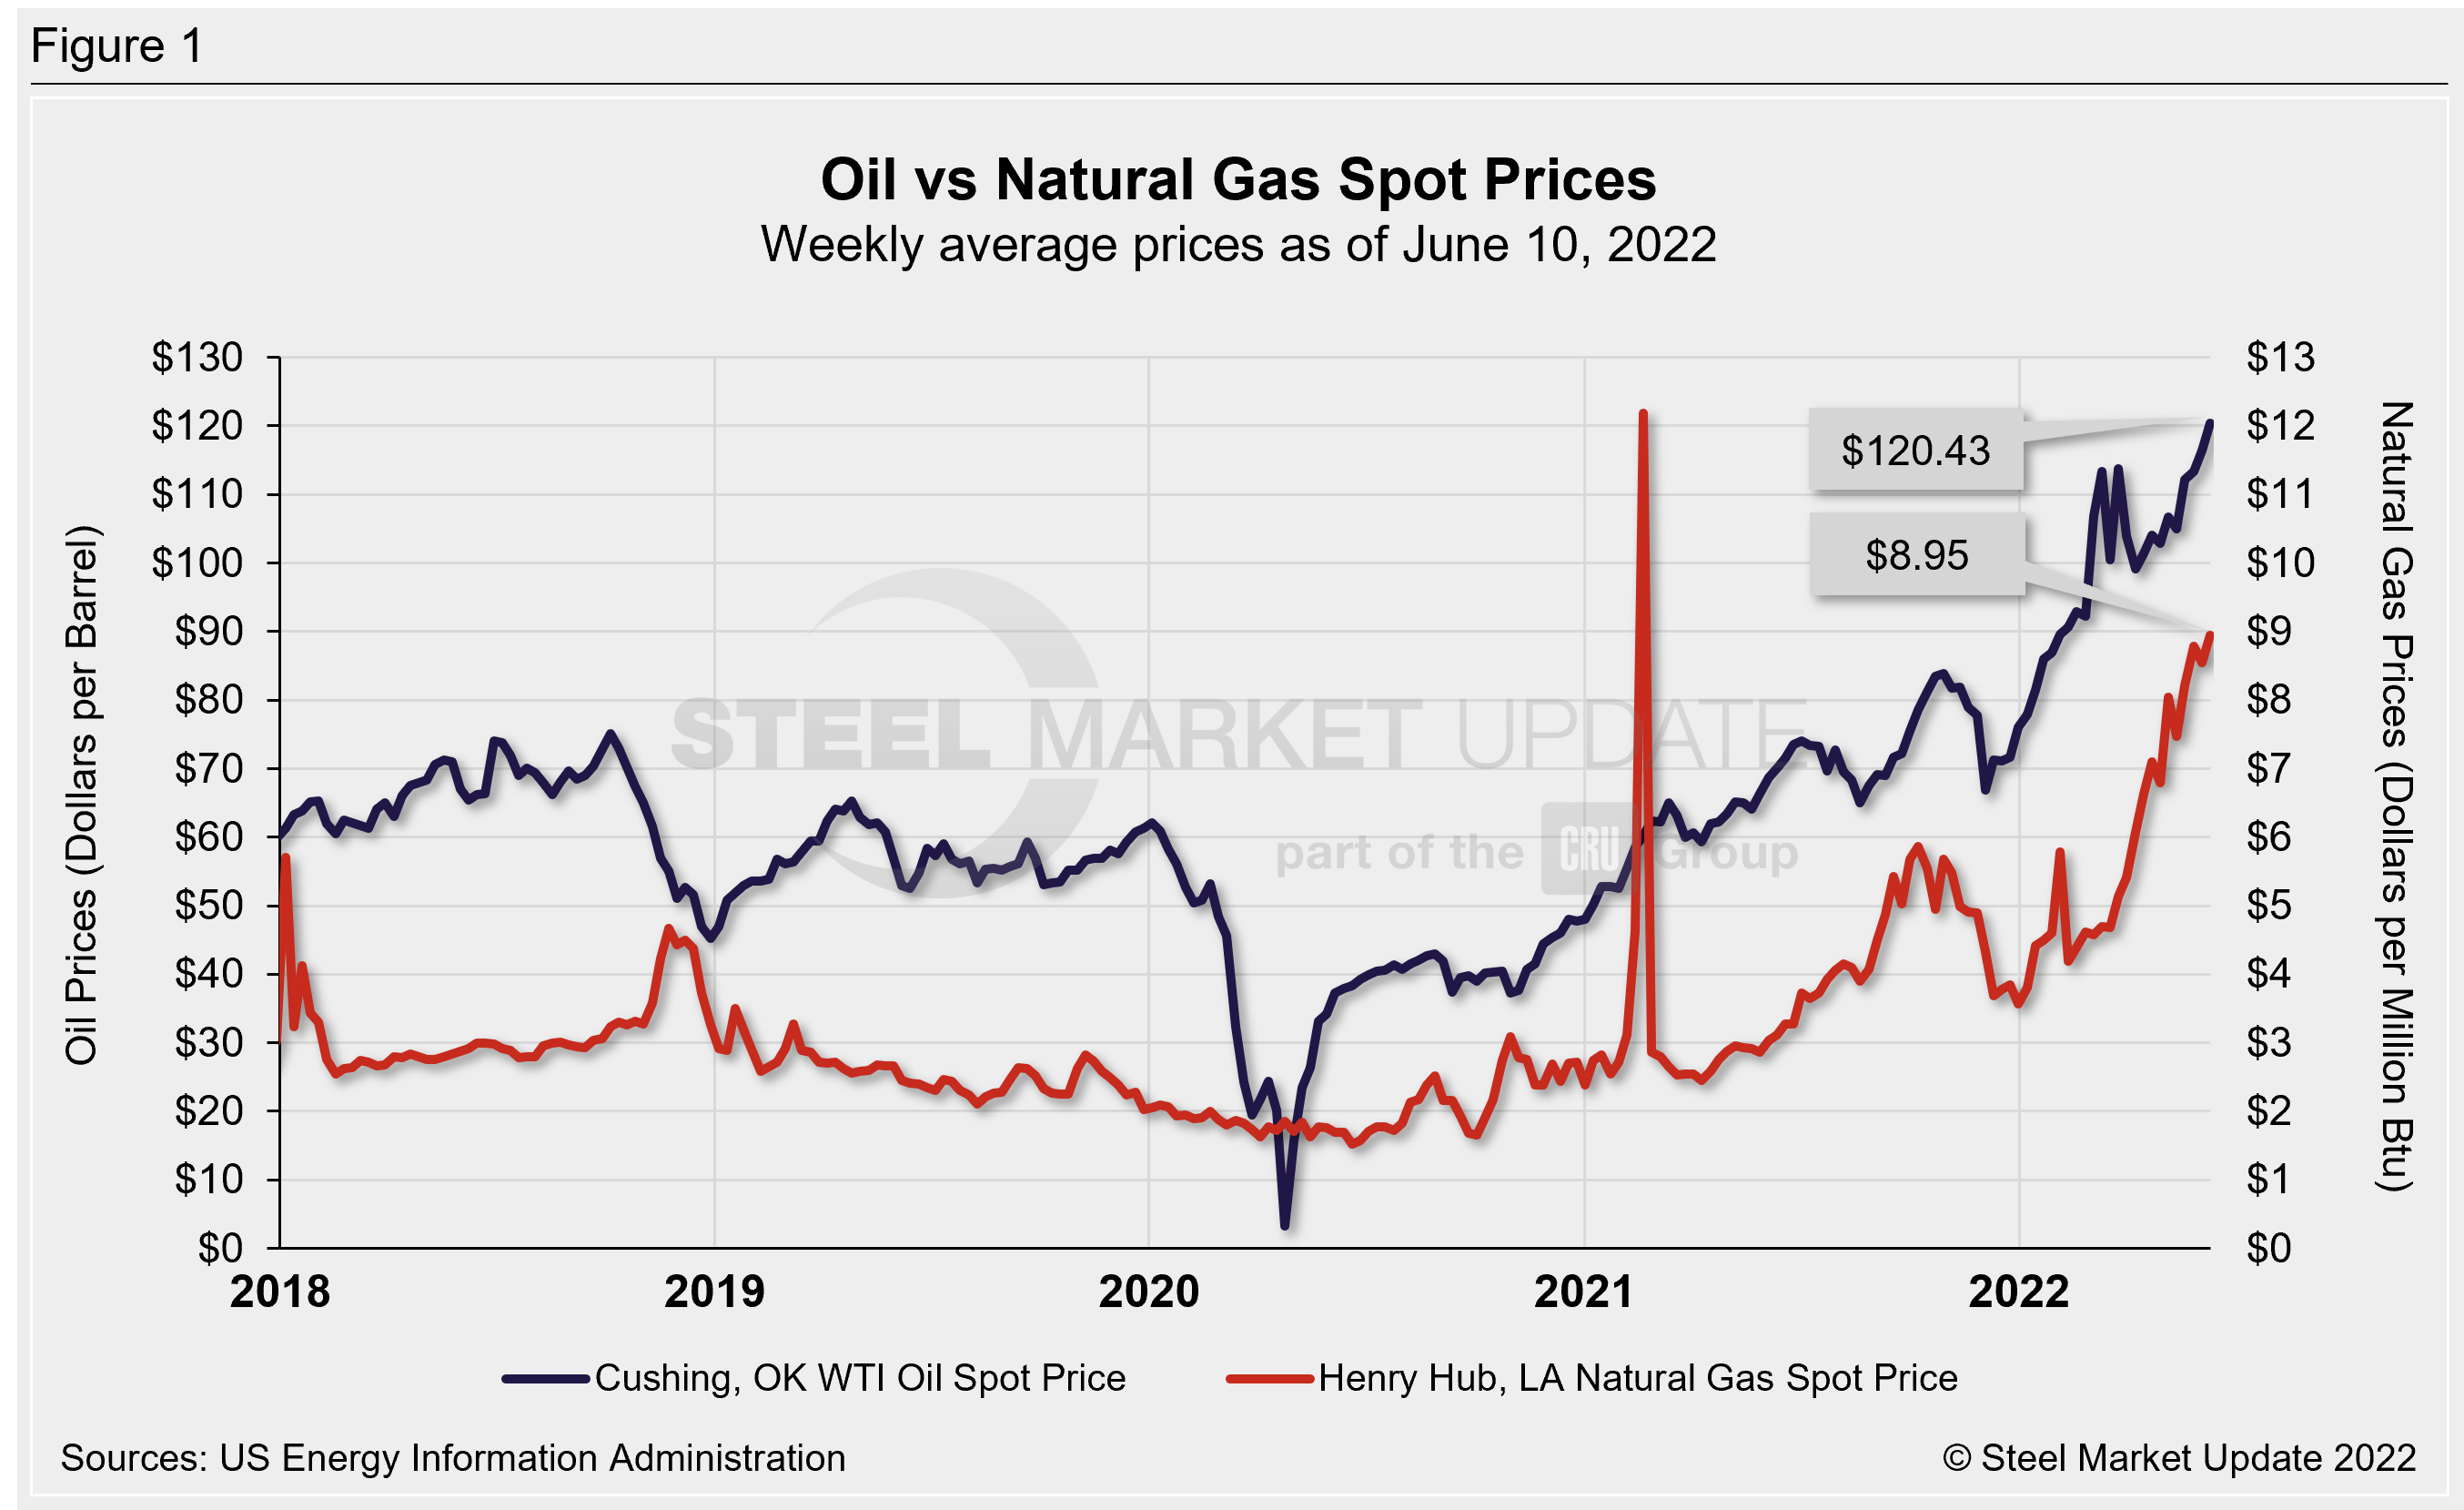
The spot market price for West Texas Intermediate (WTI) climbed to $120.43 per barrel as of June 10 (Figure 1), the highest weekly average price seen since Aug. 2008, when it was $124.57/b. The record high in the EIA’s 36-year data history occurred the week of July 4, 2008, at $142.52/b. As of last week, the EIA expects spot prices to average $108/b in the second half of 2022 (up from last month’s estimate of $103/b) and forecasts an average price of $97/b across 2023.
Regarding increasing fuel prices for consumers, EIA forecasts the average retail price for regular grade gasoline to decline from $4.44 per gallon in May to an average of $4.27 in the third quarter. Diesel is forecasted to fall from $5.57 per gallon in May to an average of $4.78 in the third quarter. “Rising prices for gasoline and diesel reflect refining margins for those products that are at or near record highs amid low inventory levels. We expect the gasoline wholesale margins (the difference between the wholesale gasoline price and Brent crude oil price) to fall,” the STEO notes.
Natural gas prices eased through mid-March but surged thereafter, climbing to multi-year high rates. The spot price as of June 10 was $8.95 per MMBTU (Million British Thermal Units), the highest level since Aug. 2008, when it was $9.15/MMBTU. (We are excluding high spot prices in Feb. 2021 resulting from winter storms and supply scarcity.) For comparison, the record high in the EIA’s 36-year history was $14.49/MMBTU the week of Dec. 16, 2005. EIA expects natural gas prices to average $8.69/MMBTU in the third quarter (up from May’s estimate of $8.13/MMBTU) and forecasts 2023 to average $4.74/MMBTU amid rising natural gas production.
Rig Counts
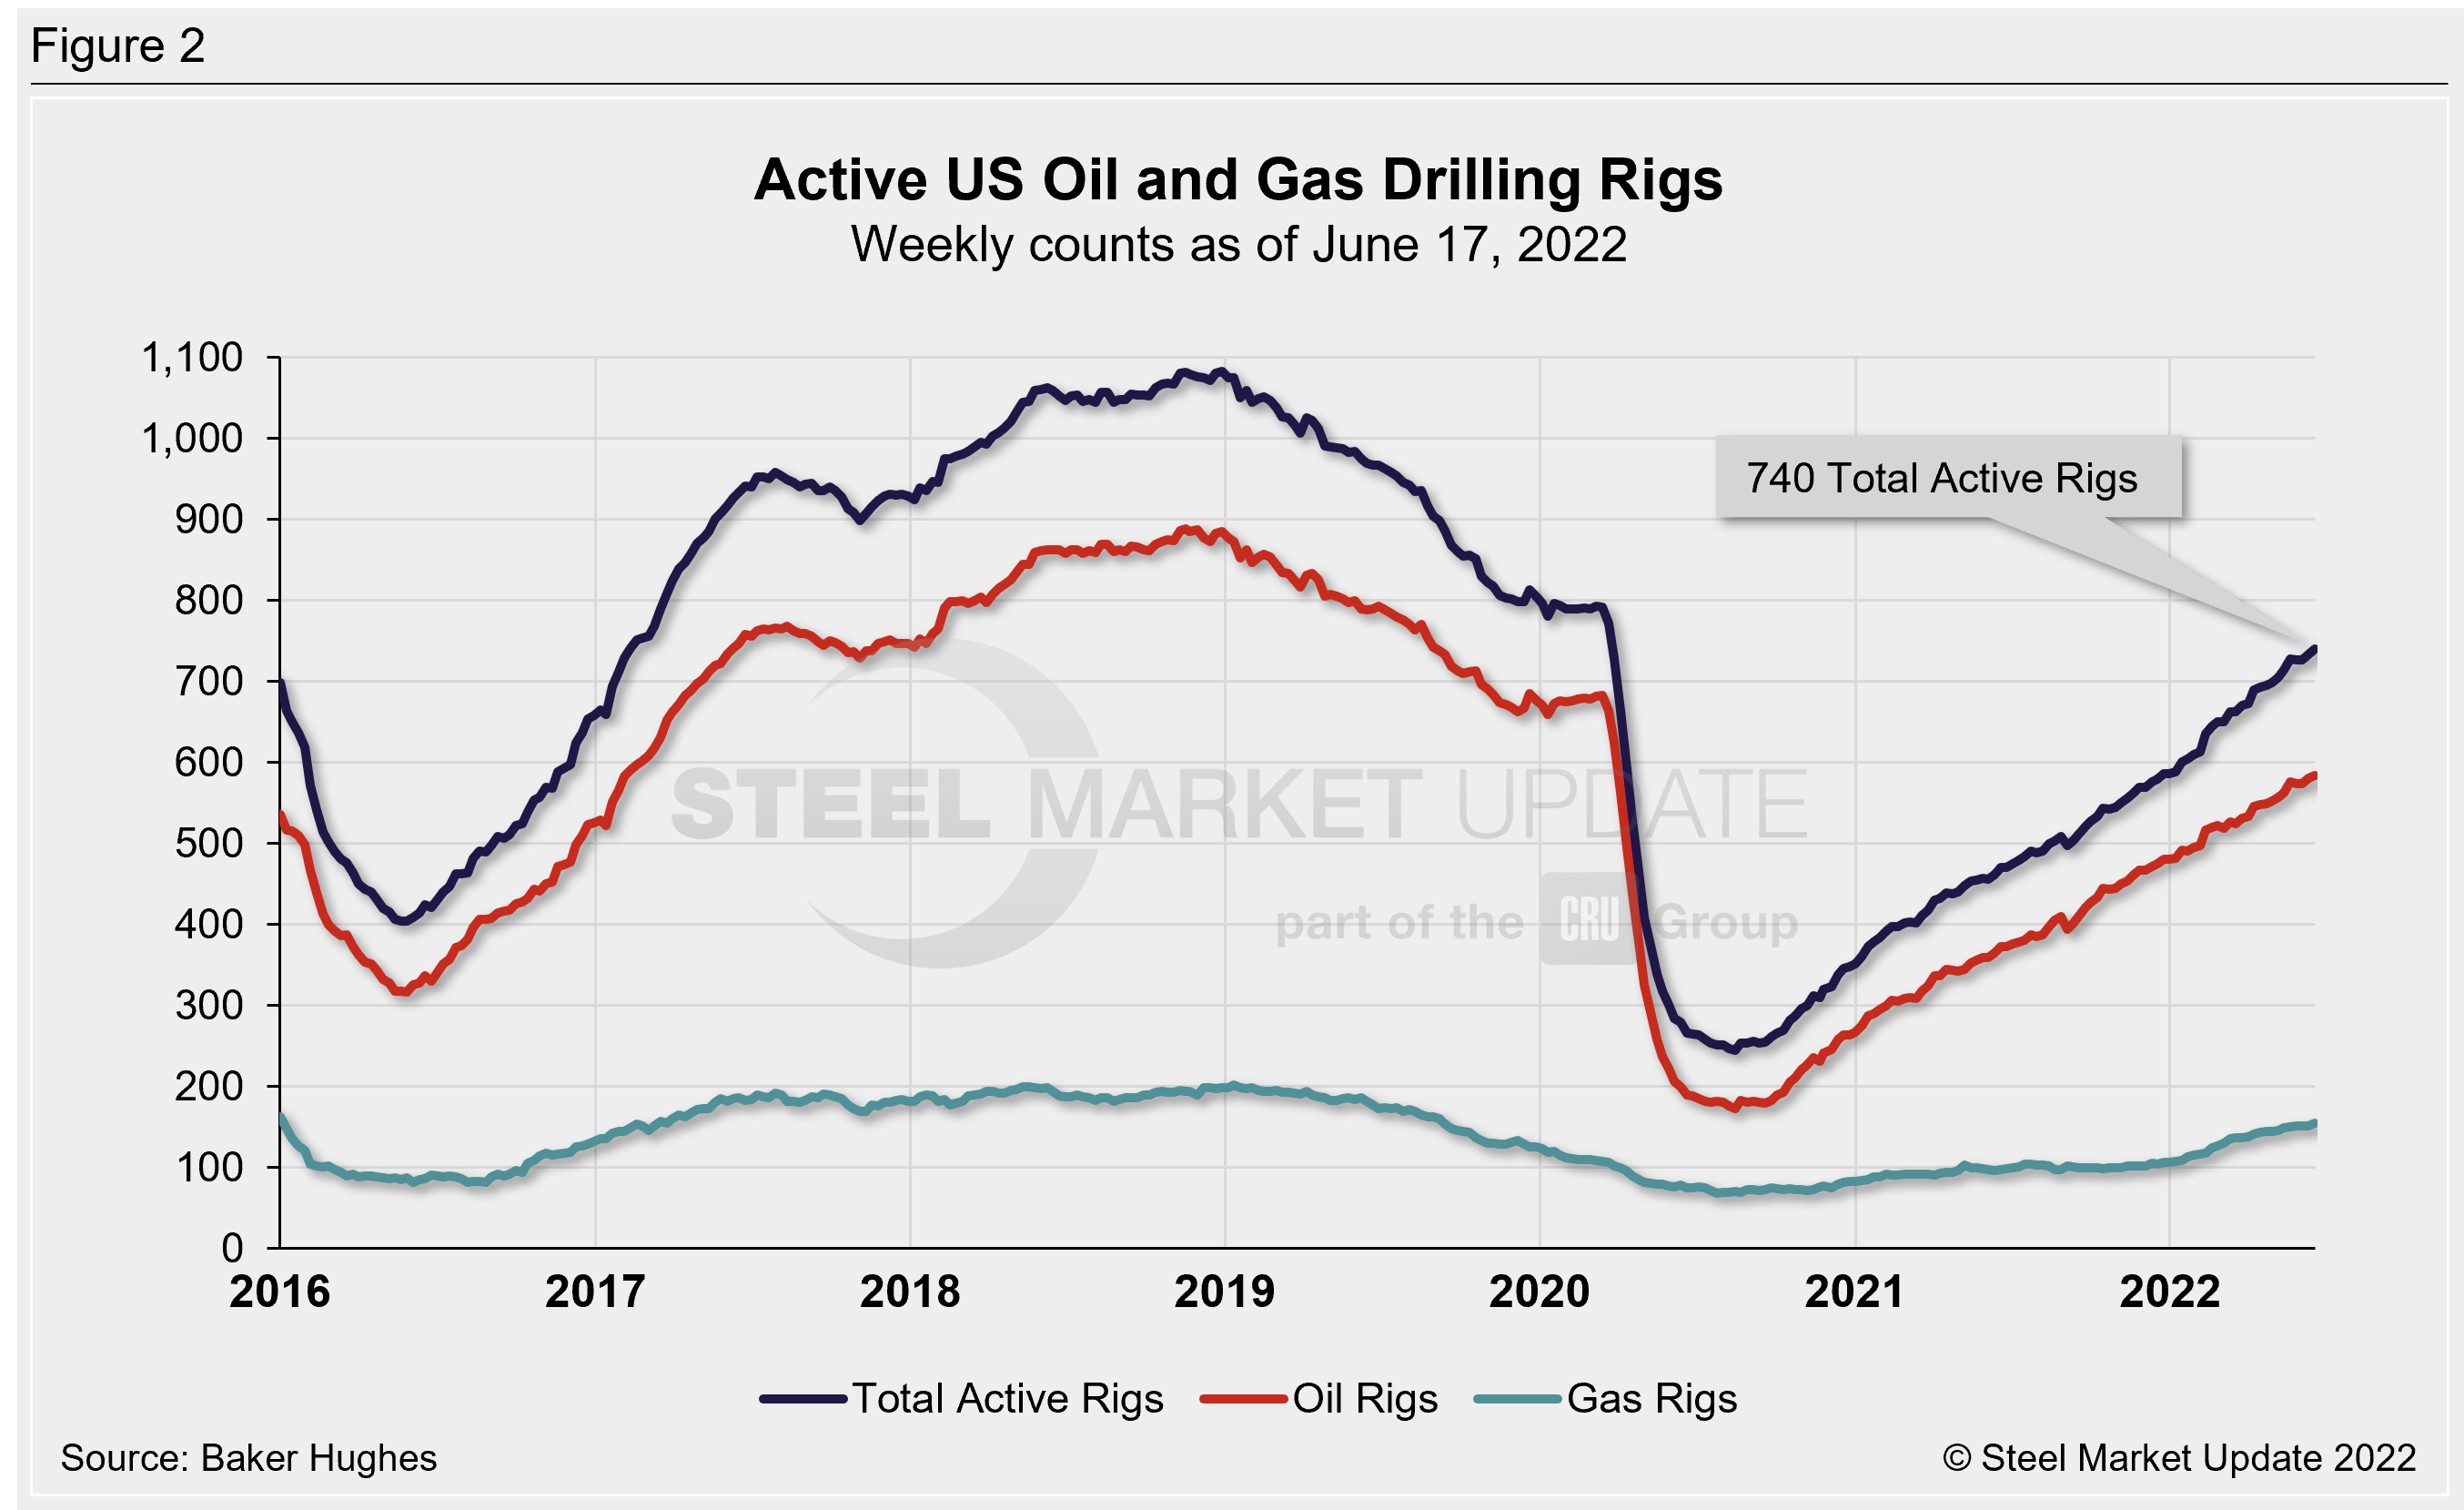
The number of active US oil and gas drill rigs continues to recover from mid-2020 lows. The latest US count was 740 active drill rigs as of the end of this week, comprised of 584 oil rigs, 154 gas rigs, and 2 miscellaneous rigs, according to Baker Hughes (Figure 2). Active drill rigs are down 7% compared to pre-Covid shutdowns in March 2020.
The latest Canadian rig count climbed to 156 rigs, comprised of 104 oil rigs and 52 gas rigs, down 23% from pre-Covid levels (Figure 3).
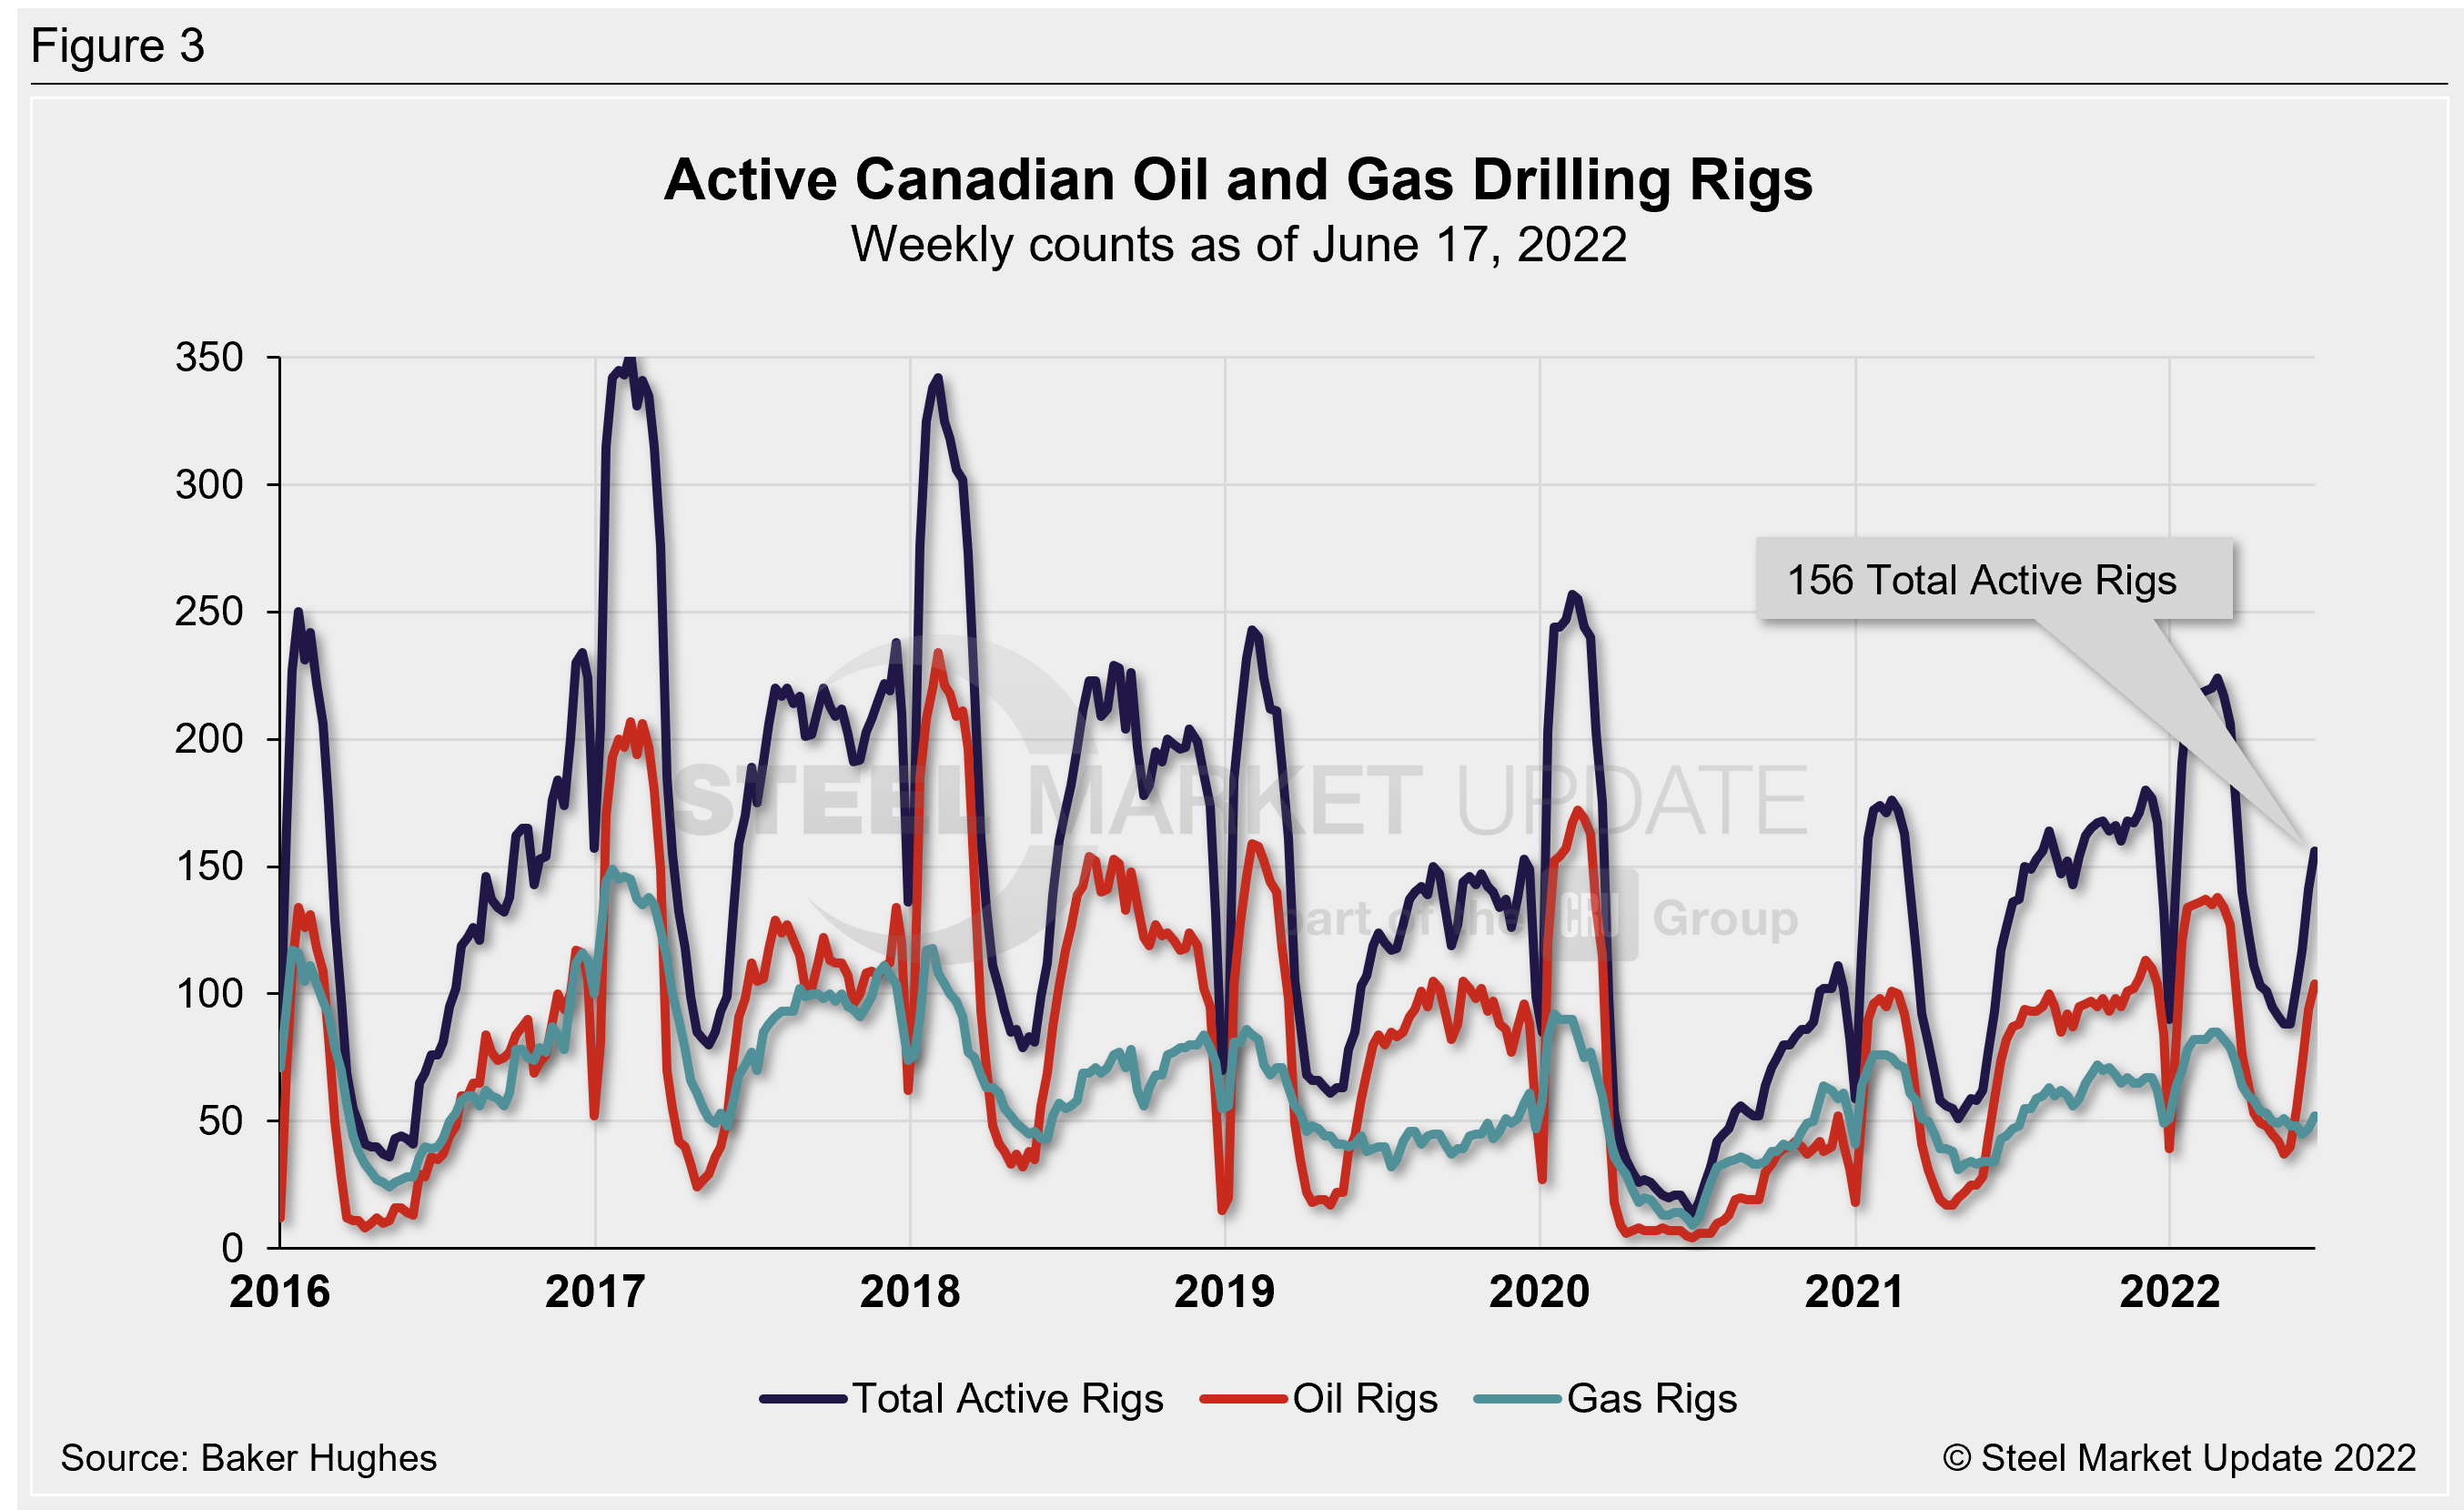
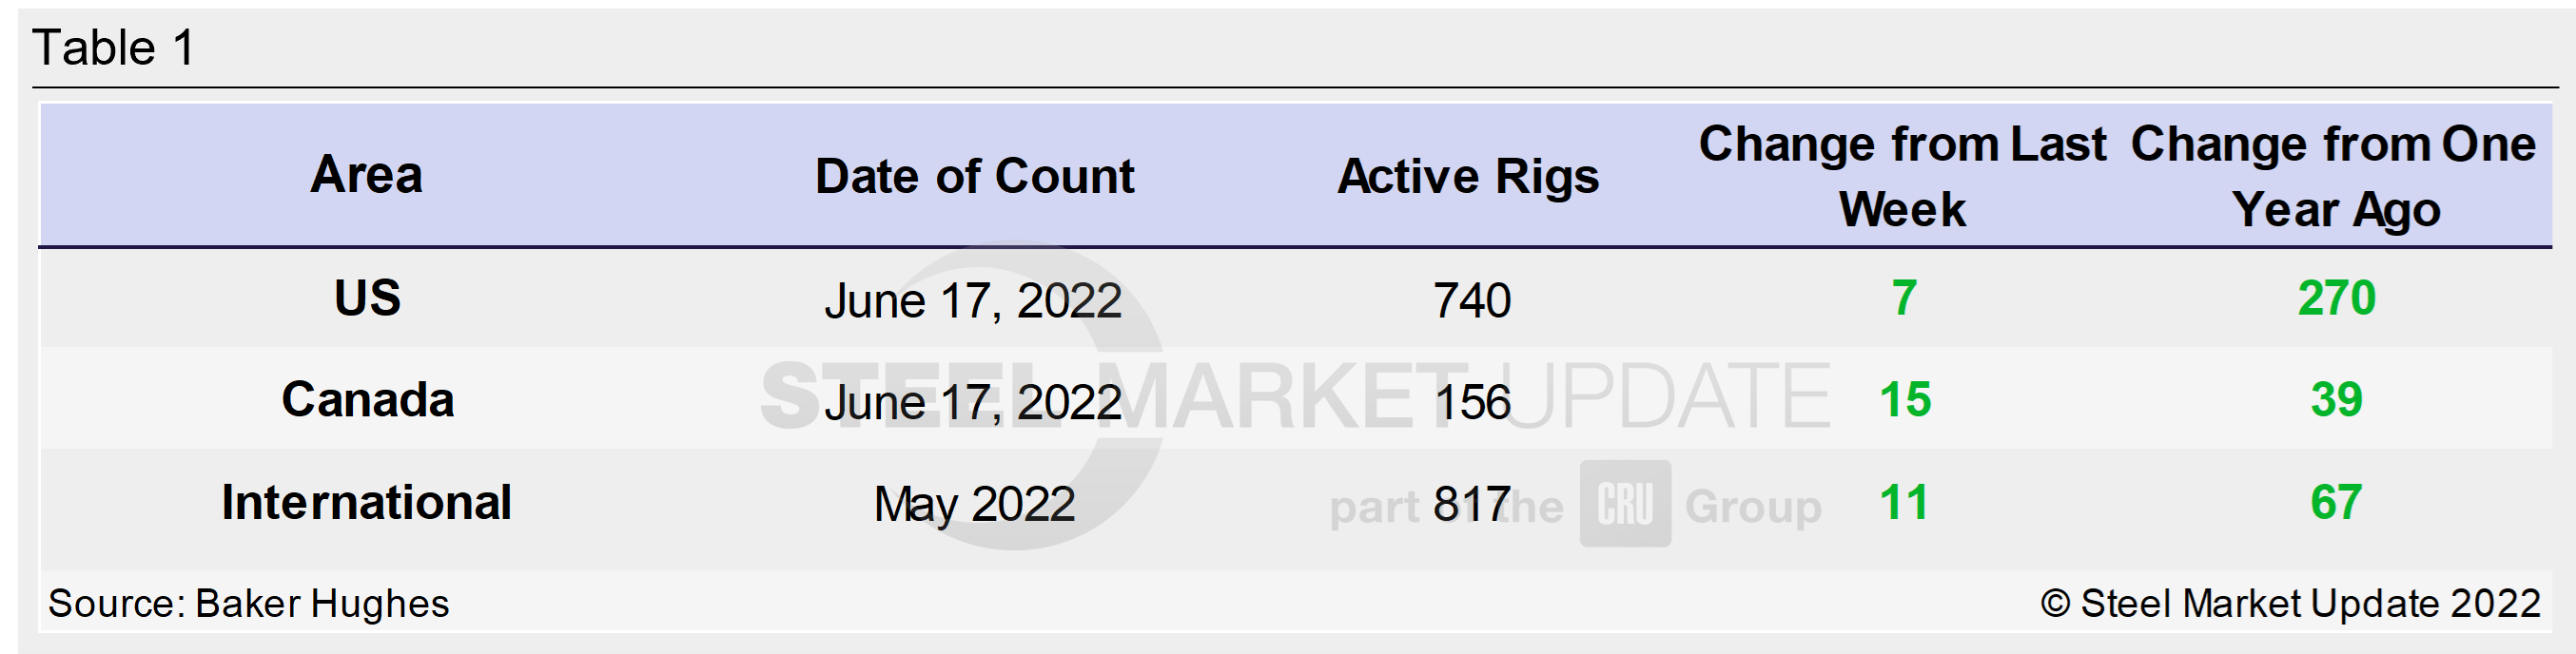
Table 1 below compares the current US, Canadian and international rig counts to historical levels.
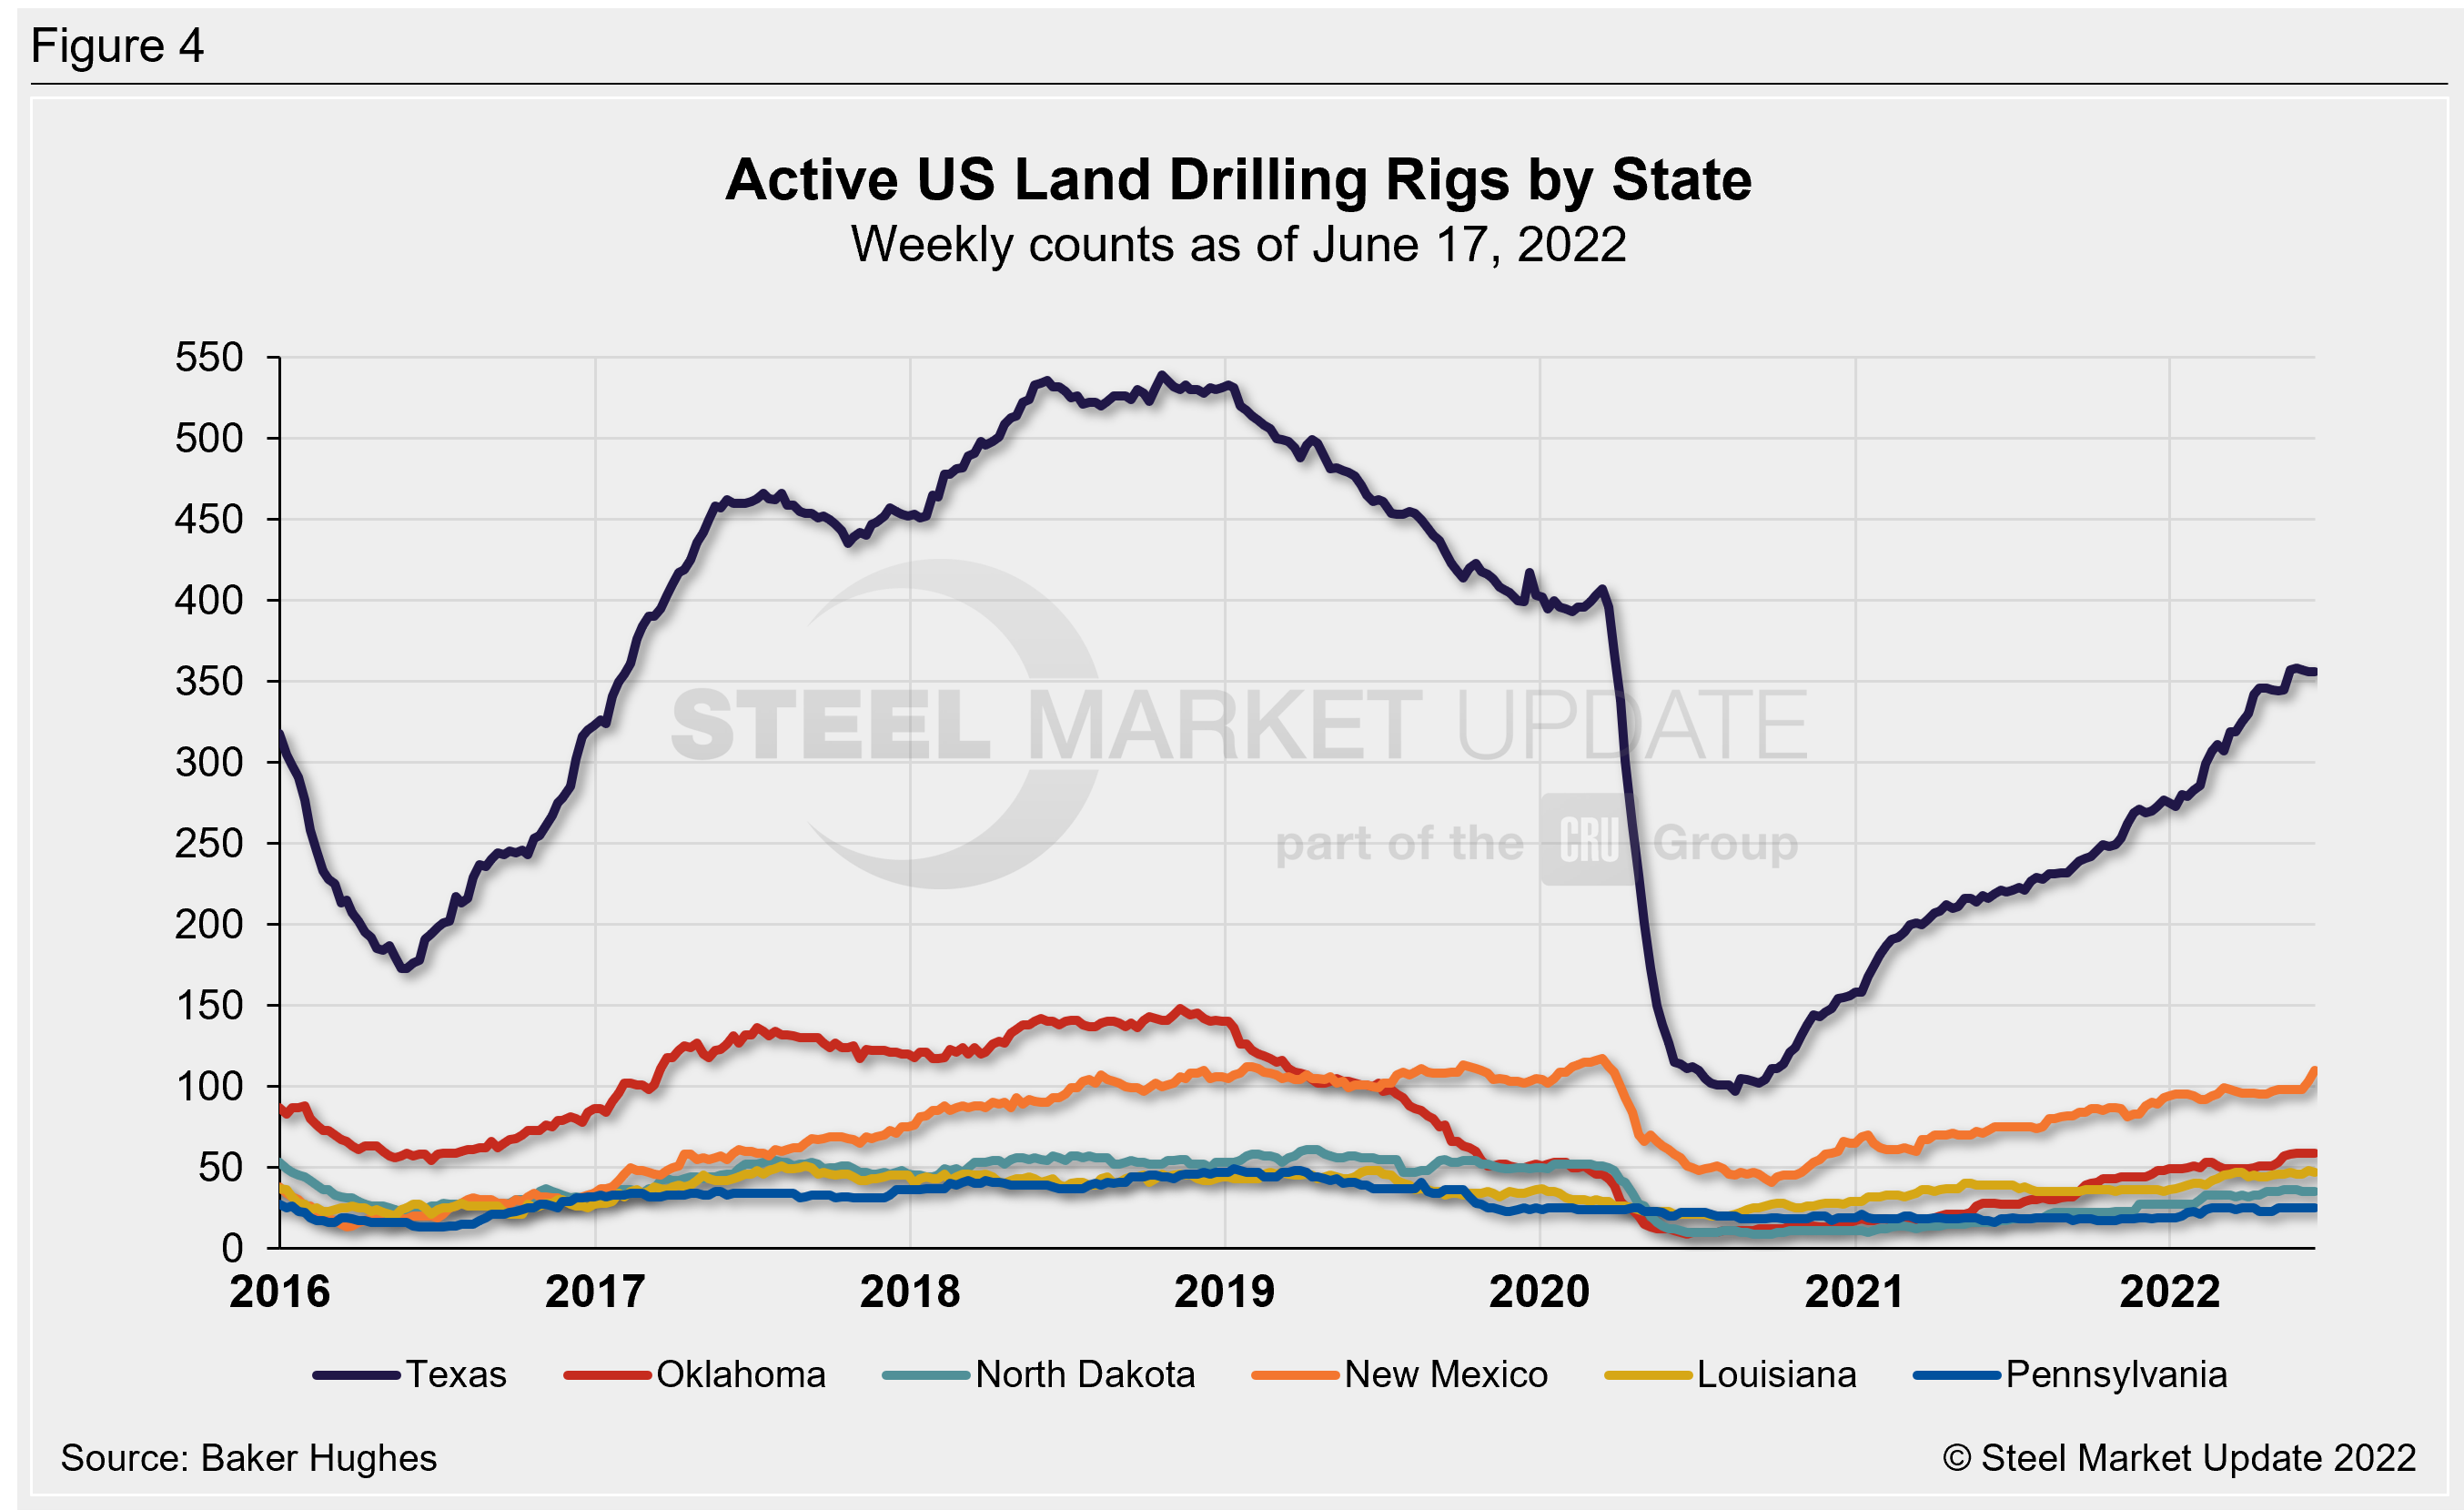
US oil and gas production are heavily concentrated in Texas, Oklahoma, North Dakota, and New Mexico. As of June 17, production continues to steadily increase for each state (Figure 4). Texas is the most active state with 356 rigs in operation as of June 17, and New Mexico is the second highest with 110 rigs. Recall that the number of active Texas rigs had plummeted 76% in 2020, falling from 407 in April to 97 rigs in August.
Stock Levels
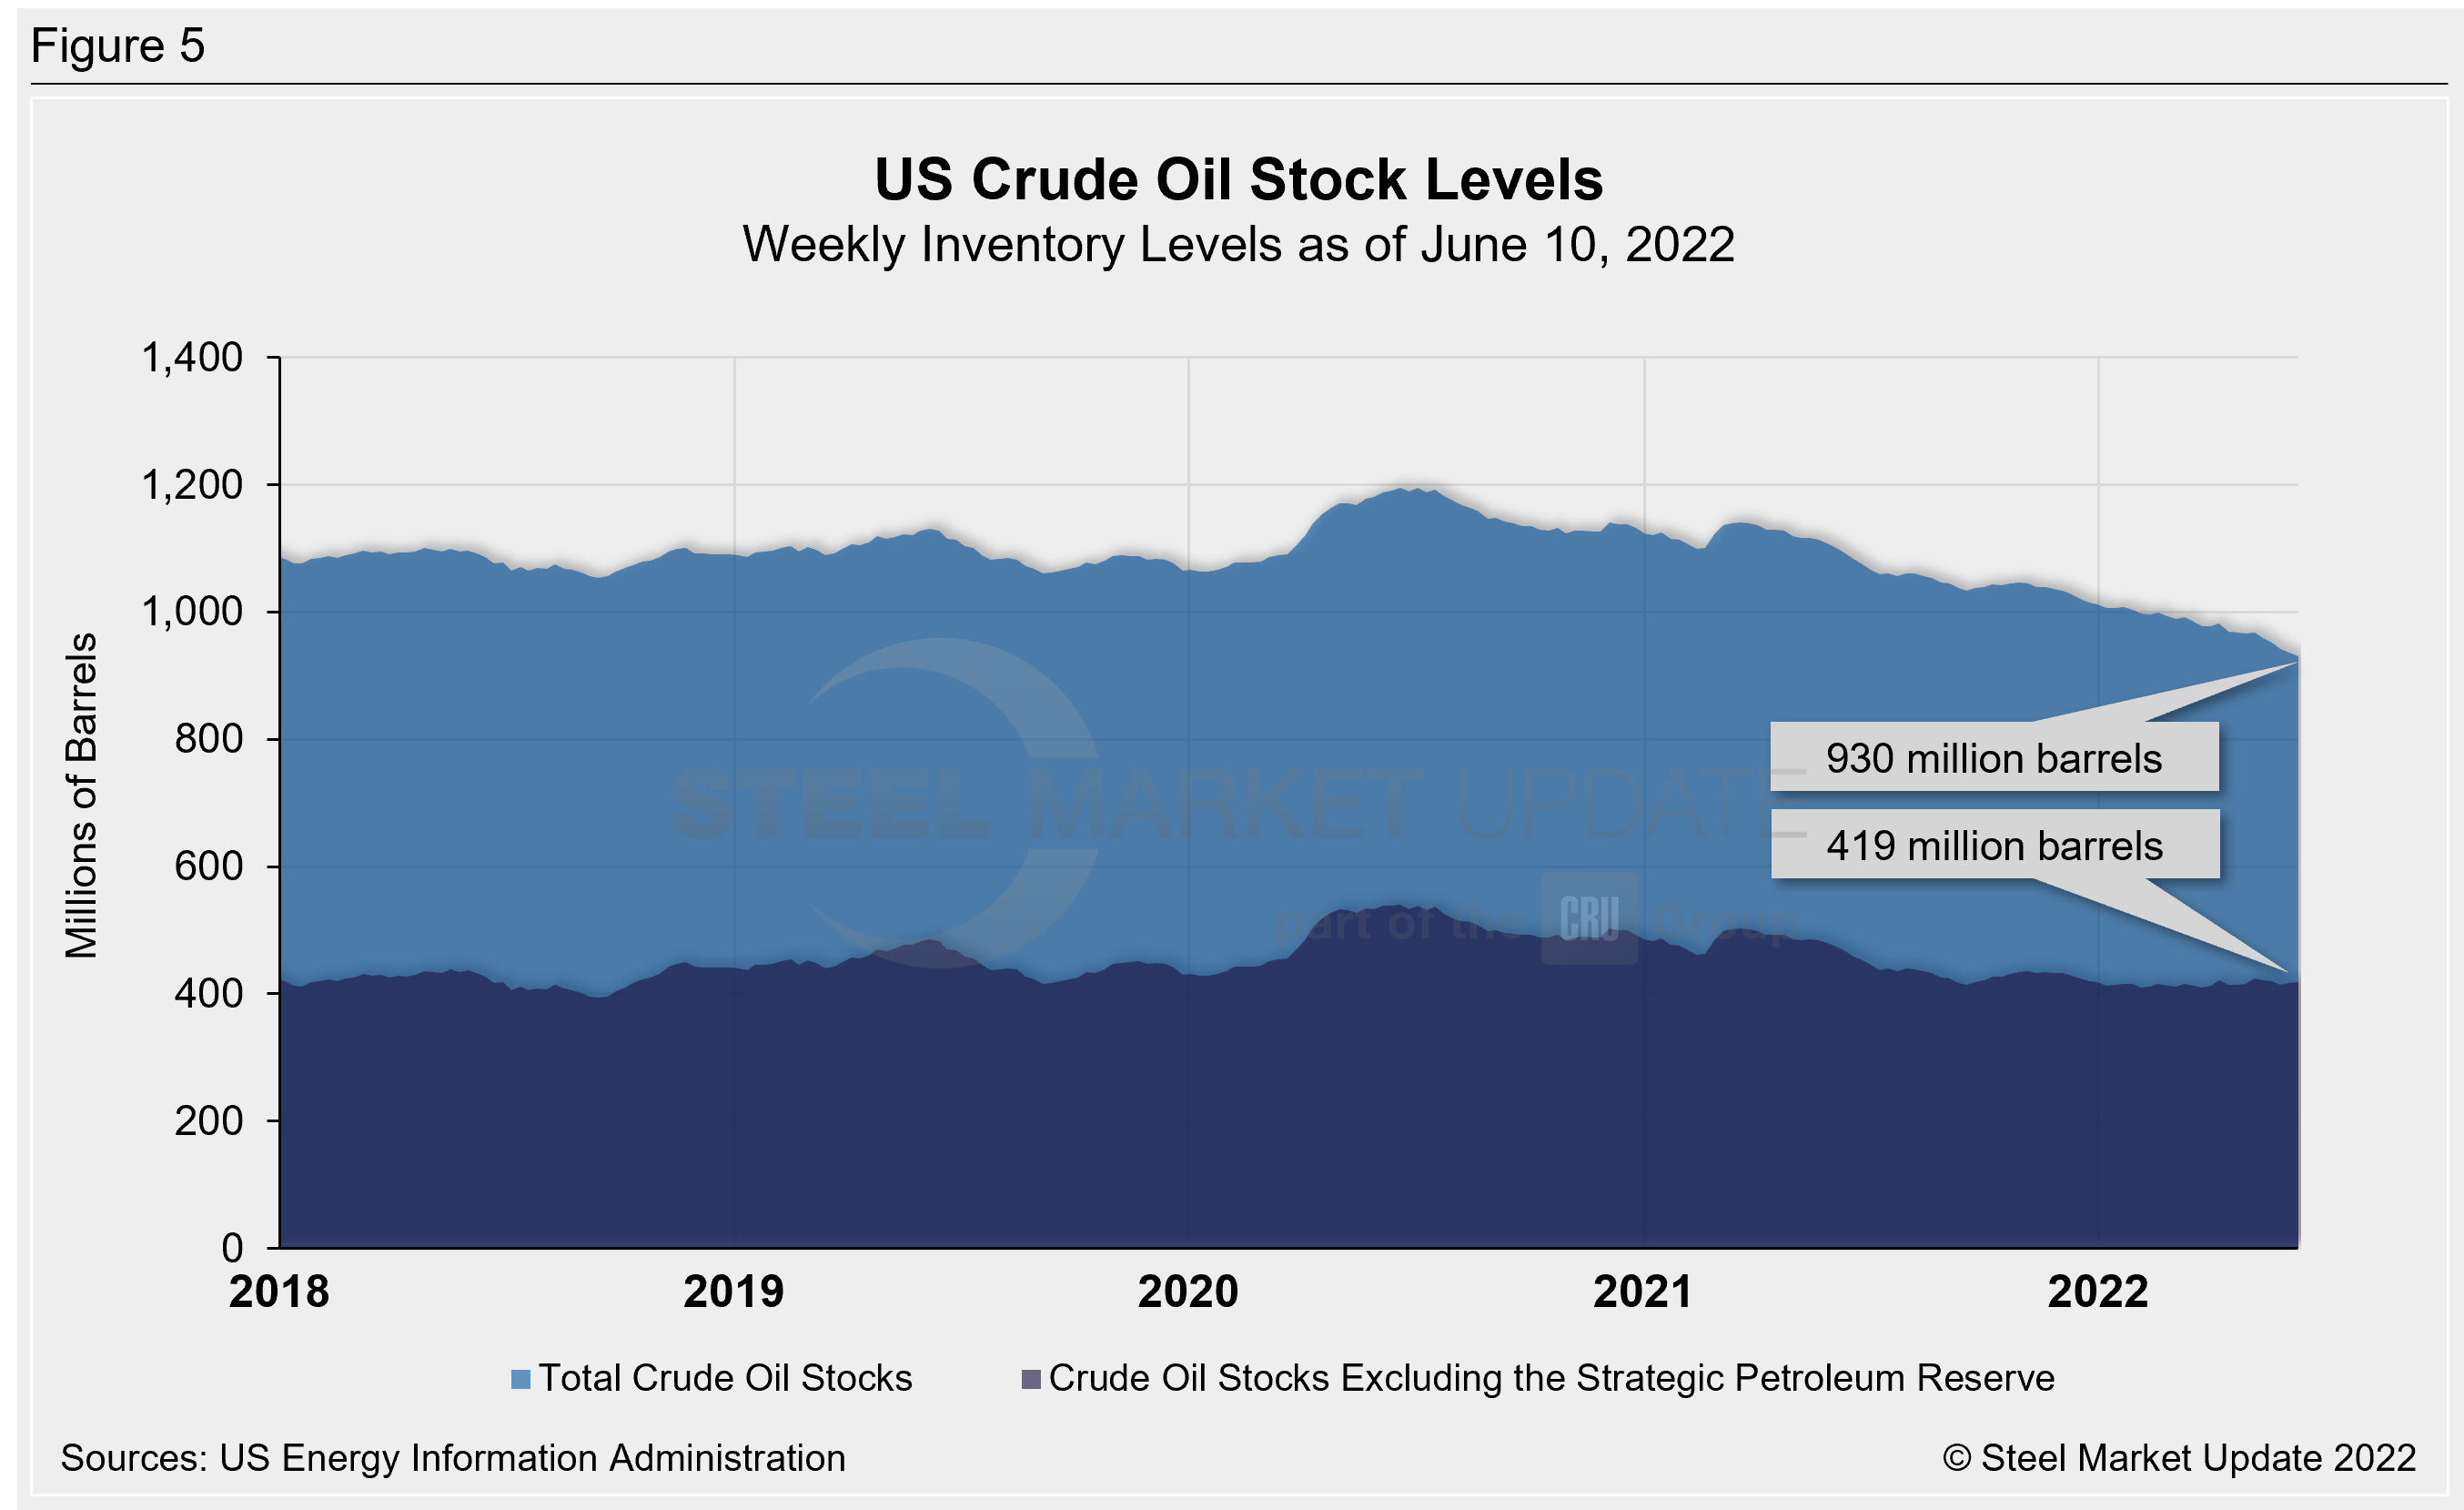
US total crude oil stocks continue to decline from mid-2020 highs, falling to a 17-year low of 930 million barrels on June 10. For comparison, the record low in the EIA’s 40-year history was 608 million barrels in October 1982. The June stock level is down 15% from 1.092 billion barrels one year ago (Figure 5).
Trends in energy prices and rig counts are an advanced indicator of demand for oil country tubular goods (OCTG), line pipe and other steel products.
By Brett Linton, Brett@SteelMarketUpdate.com


