

Market Data

August 15, 2022
Energy Market Analysis through August
Written by Brett Linton
The Energy Information Administration’s August Short-Term Energy Outlook (STEO) remains subject to a high level of uncertainty due to the volitle global energy market. Contributing factors include Russia’s invasion of Ukraine, foreign and domestic oil production levels, and OPEC+ production decisions. Due to these variabilities, the EIA continues to warn that actual price outcomes could vary substantially from its forecasts.
In this Premium analysis we cover oil and natural gas prices, North American drilling rig activity, active drill rigs by state, and US crude oil stock levels.
Updated last week, you can view the latest EIA Short-Term Energy Outlook here.
Oil and Gas Spot Prices
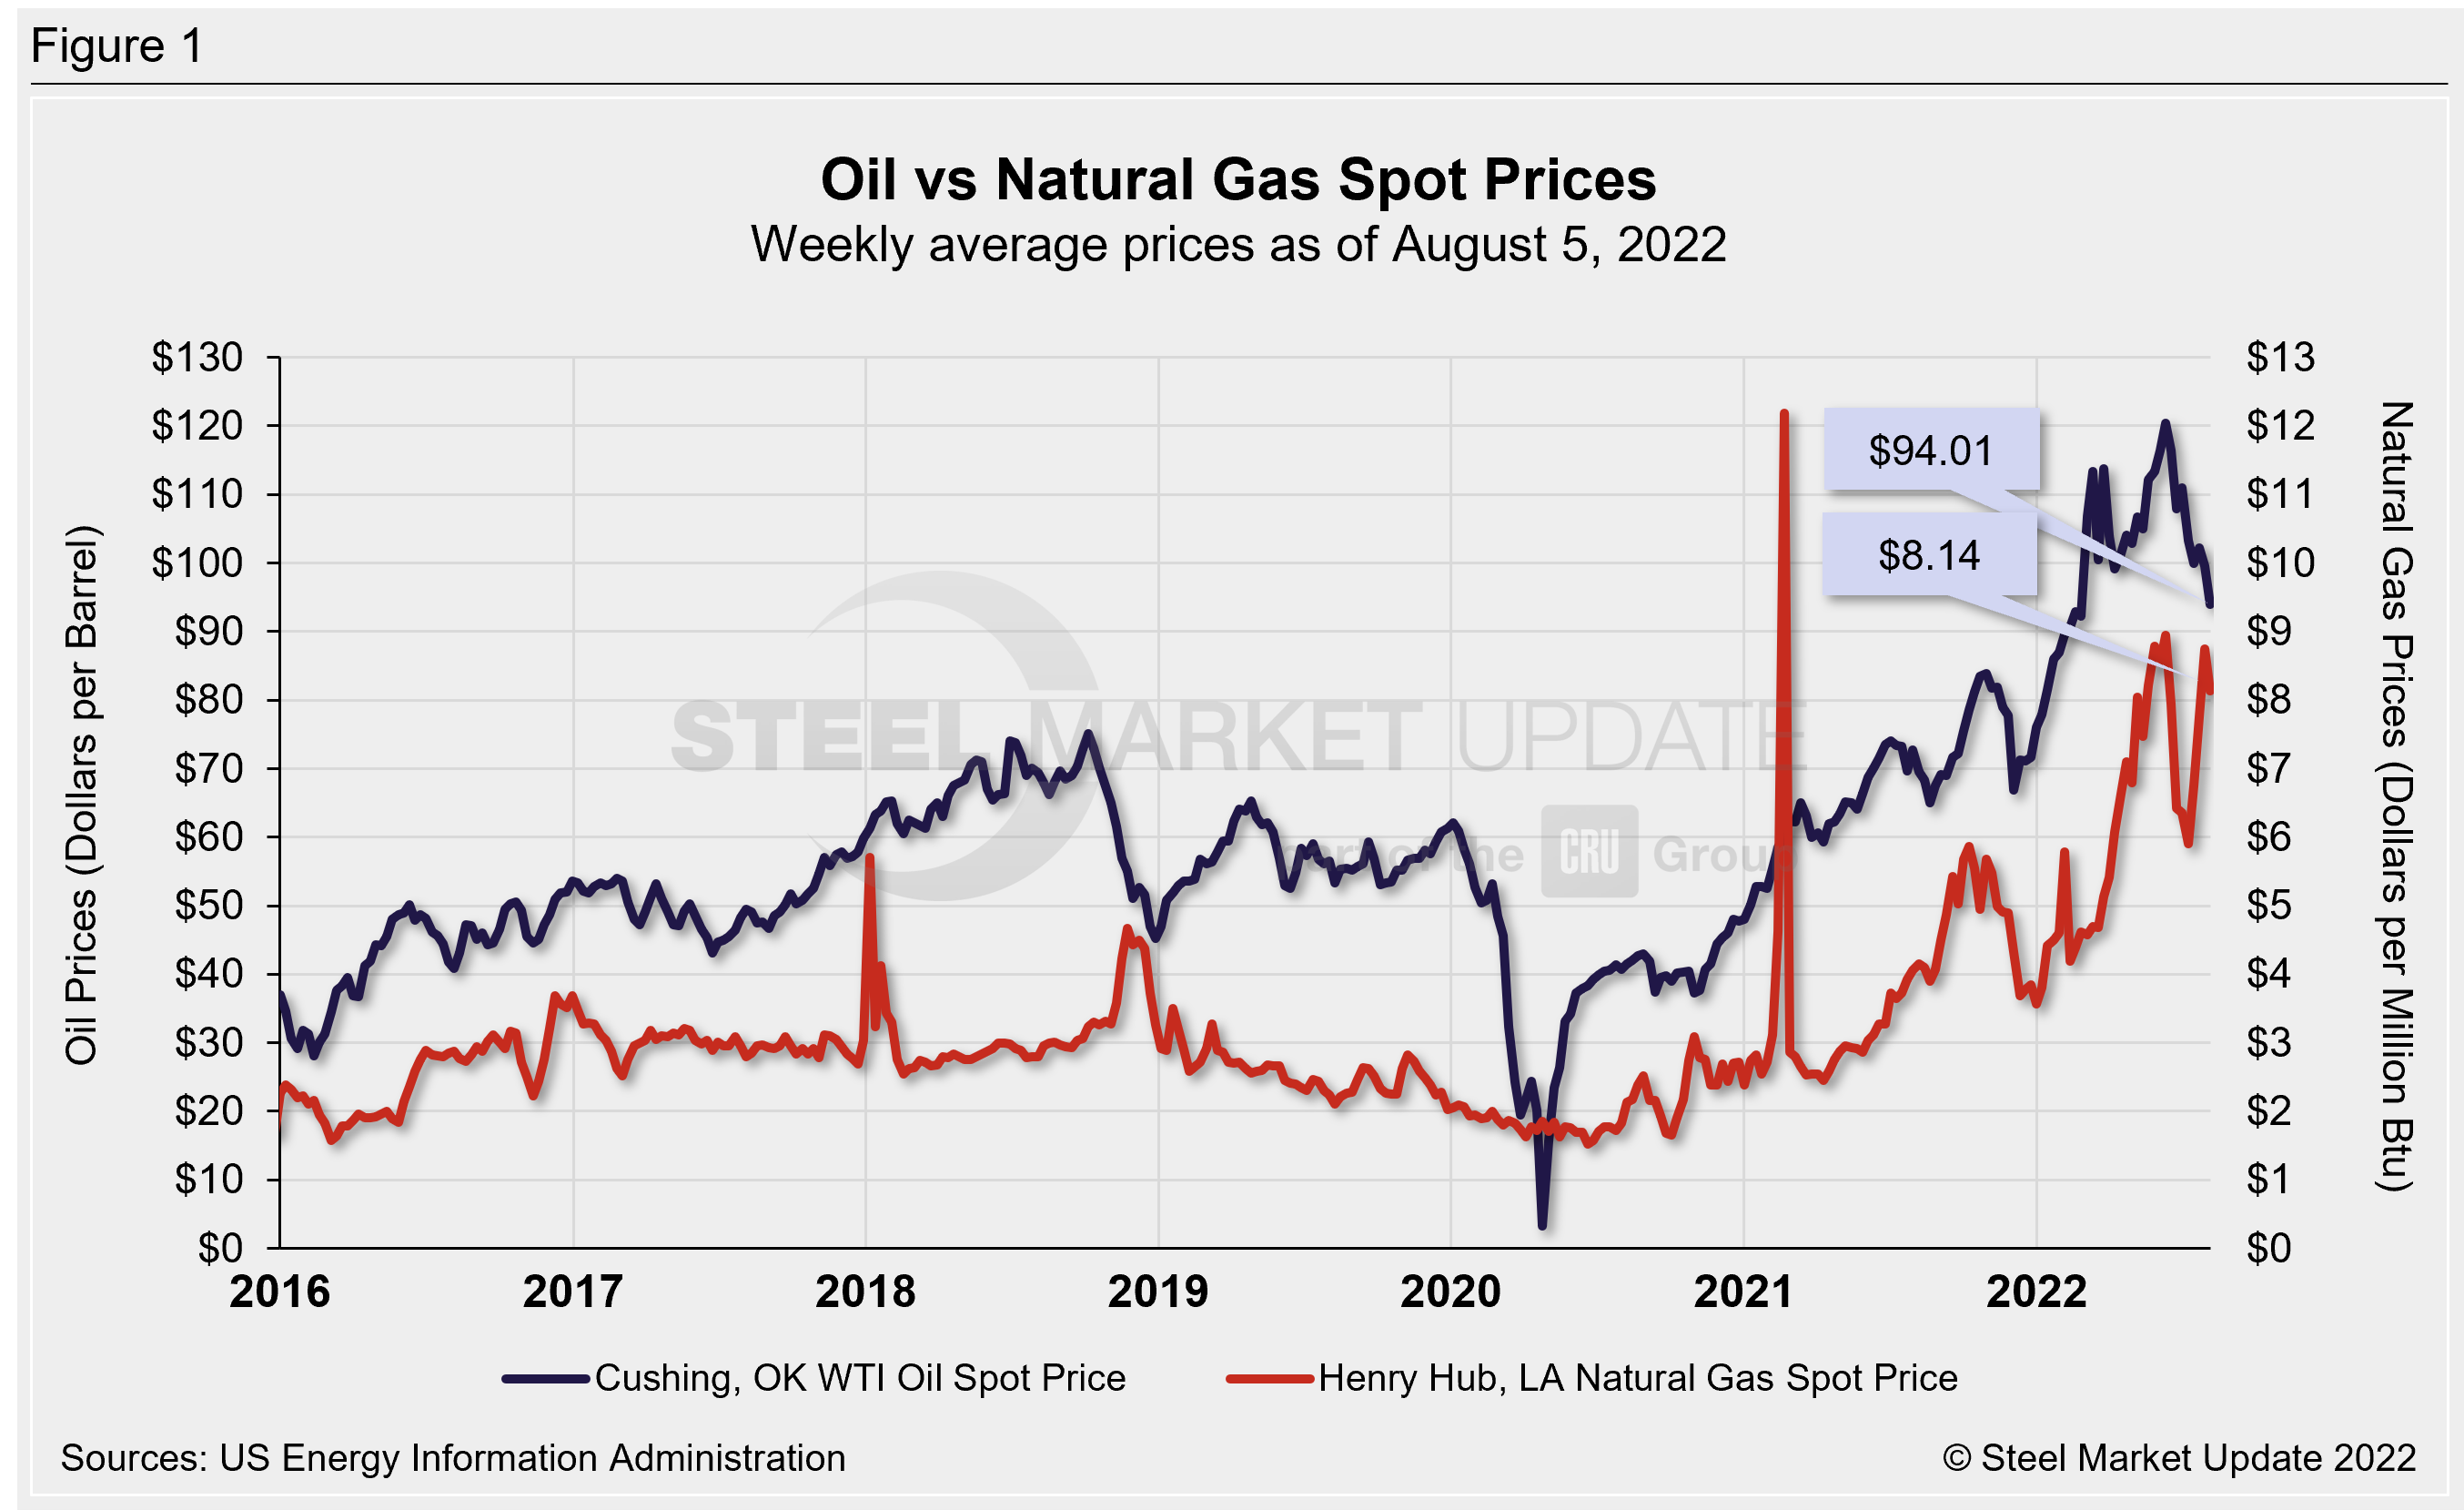
The weekly West Texas Intermediate oil spot market price was $94.01 per barrel as of the week ending Aug. 5 (Figure 1), the lowest figure seen since late February. Oil spot prices have been gradually easing from the 13+ year high of $120.43/b seen in early June. For comparison, the record high in the EIA’s 36-year data history occurred in July 2008 at $142.52/b. As of Aug. 9, the EIA expects oil spot prices to average $105/b in the second half of 2022 (up from last month’s estimate of $104/b) and forecasts an average price of $95/b across 2023 (up from $94 in the previous estimate).
Regarding increasing fuel prices for consumers, EIA forecasts the retail price for regular grade gasoline to average $4.29 per gallon in the third quarter of this year and $3.78/gal in Q4. Diesel is forecast to average $5.02/gal in Q3 and $4.39/gal in Q4.
Natural gas spot prices have moved in the opposite direction, nearing the multi-year records seen in June. The spot price as of Aug. 5 was $8.14 per MMBTU (Metric Million British Thermal Units). Back in early June, spot prices peaked at $8.95/MMBTU, the highest level since Aug. 2008. (We are excluding high spot prices in Feb. 2021 resulting from winter storms and supply scarcity.) The record high in the EIA’s 36-year history was $14.49/MMBTU the week of Dec. 16, 2005. EIA expects natural gas prices to average $7.54/MMBTU in the second half of 2022 (up from July’s estimate of $5.97/MMBTU) and forecasts 2023 to average $5.10/MMBTU.
Rig Counts
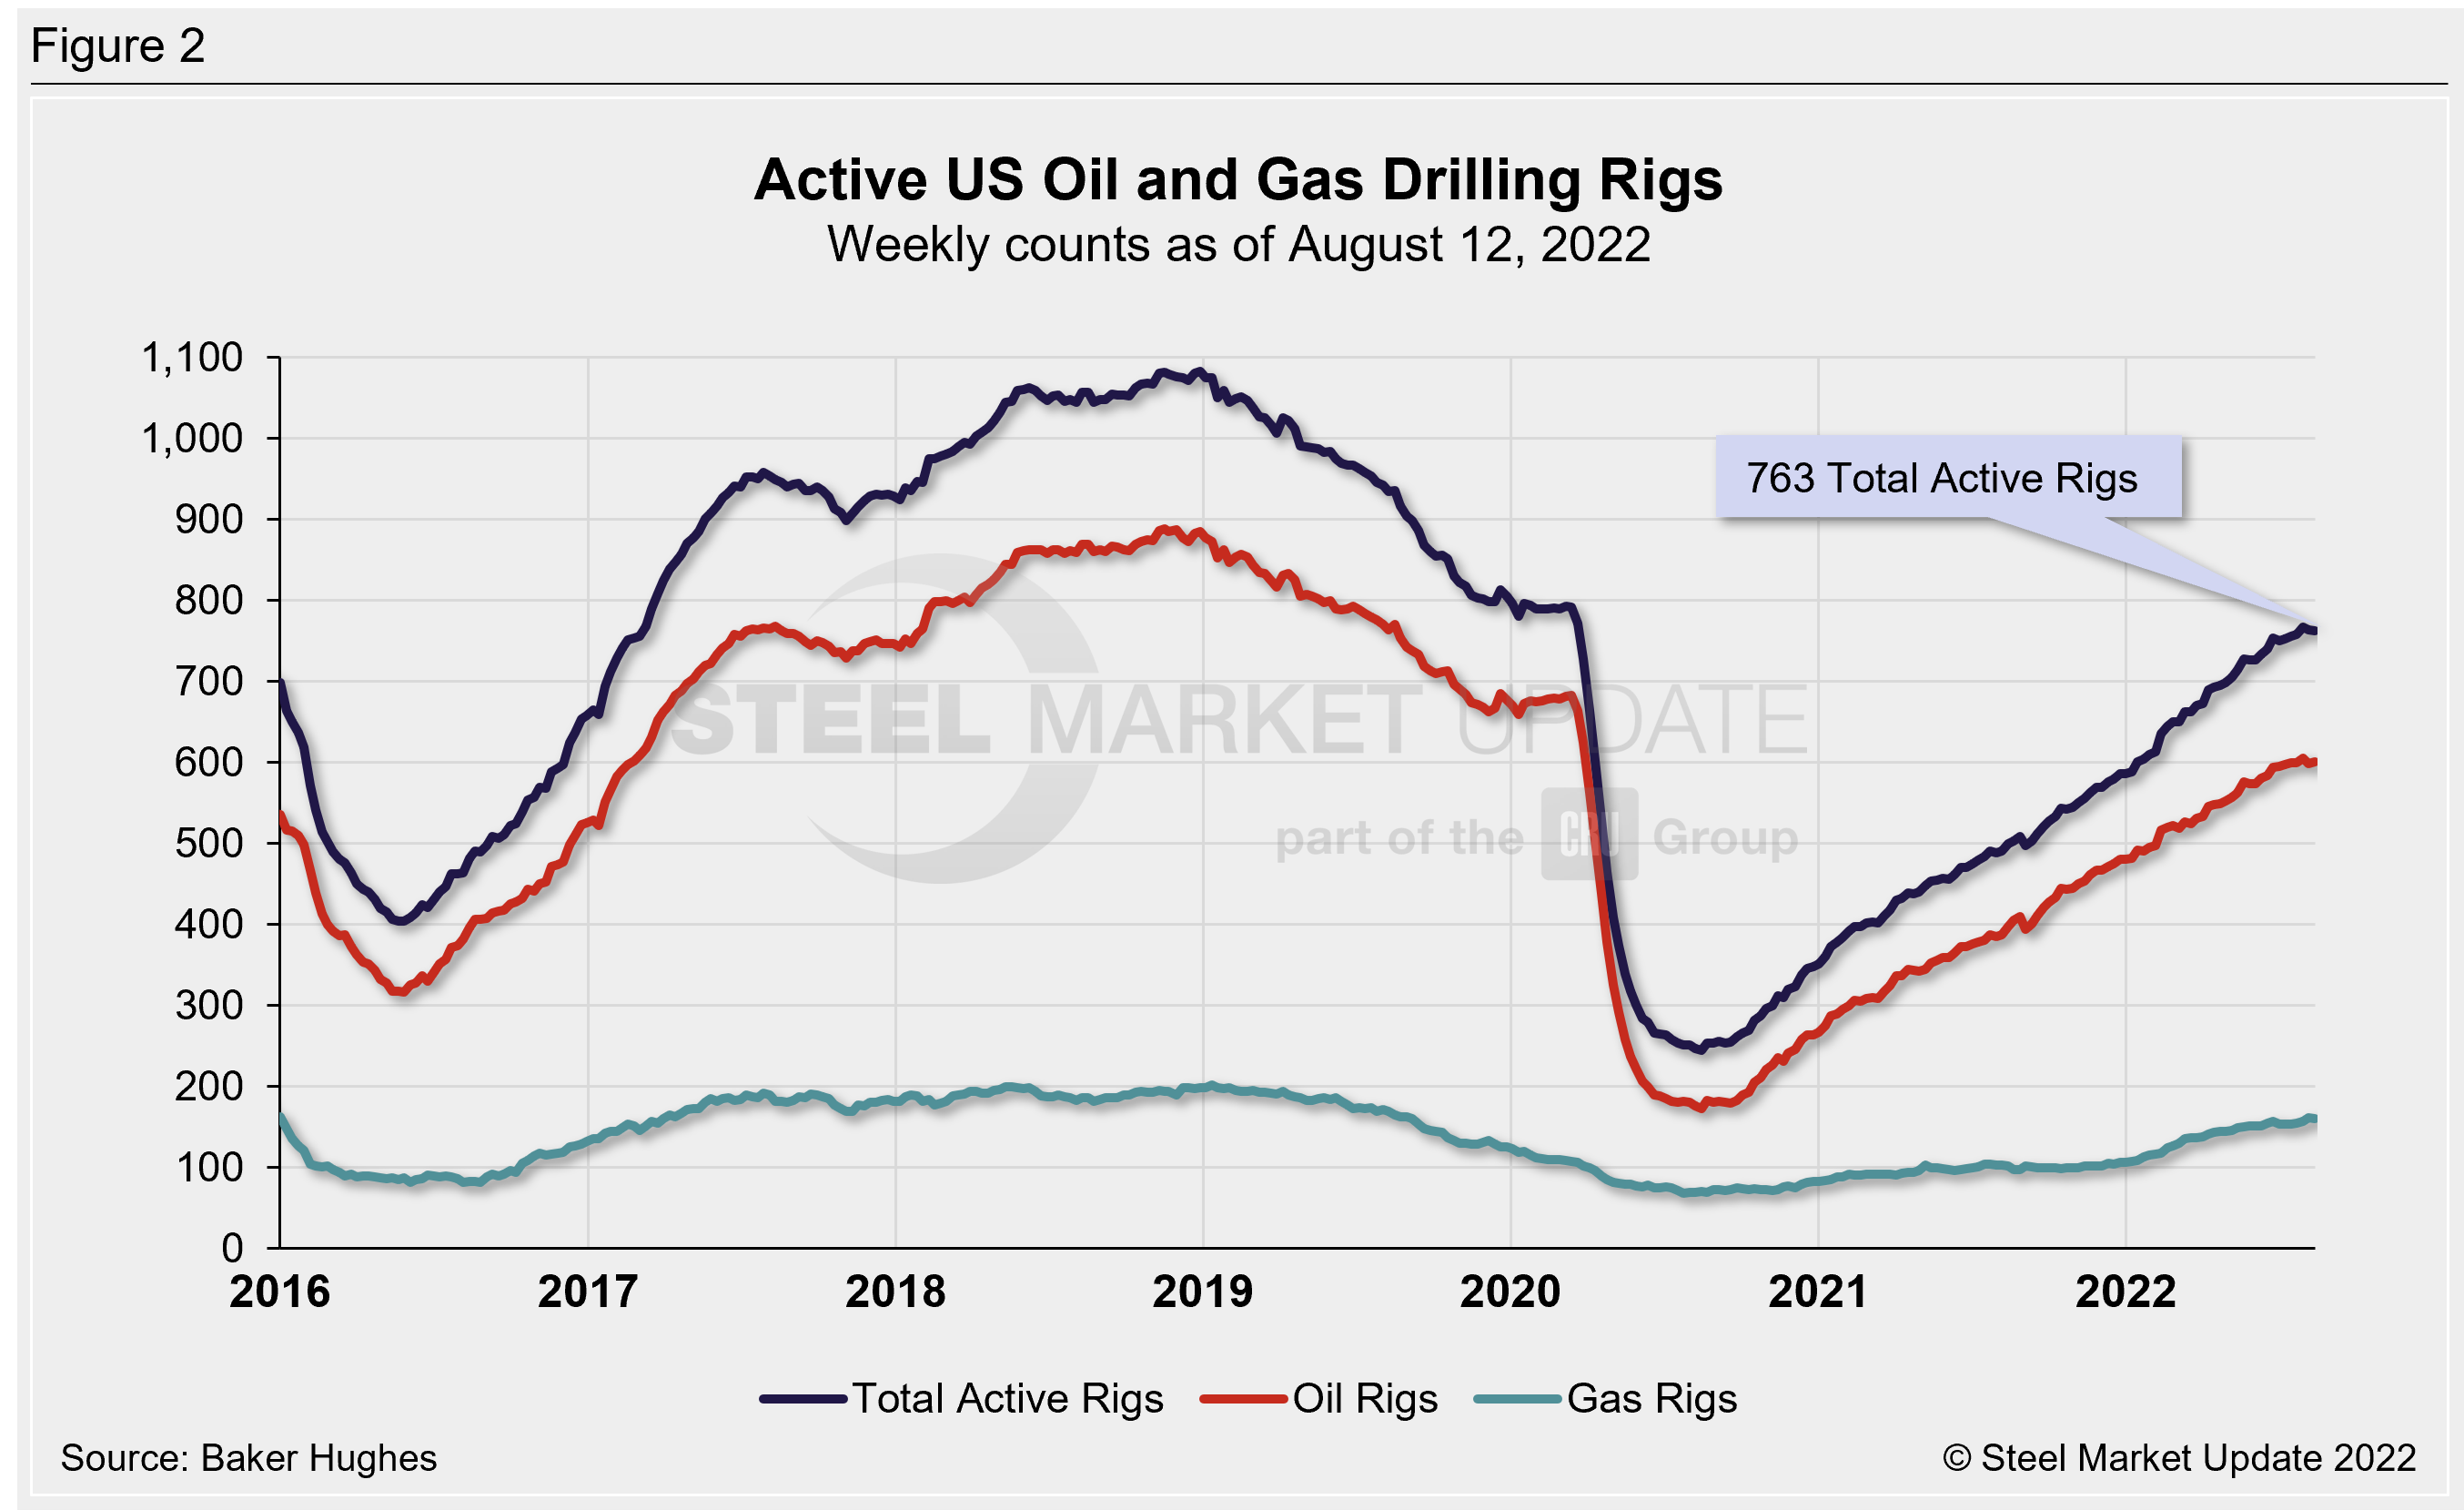
The number of active US oil and gas drill rigs continues to recover from mid-2020 lows. The latest US count was 763 active drill rigs as of the end of last week, comprised of 601 oil rigs, 160 gas rigs, and two miscellaneous rigs, according to Baker Hughes (Figure 2). Active rig counts are up 53% versus this time last year, and down just 4% compared to pre-Covid shutdowns in March 2020.
The latest Canadian rig count climbed to 201 rigs, comprised of 137 oil rigs and 64 gas rigs. Candian rig counts are up 23% compared to one year prior, but down 21% from pre-Covid levels (Figure 3).
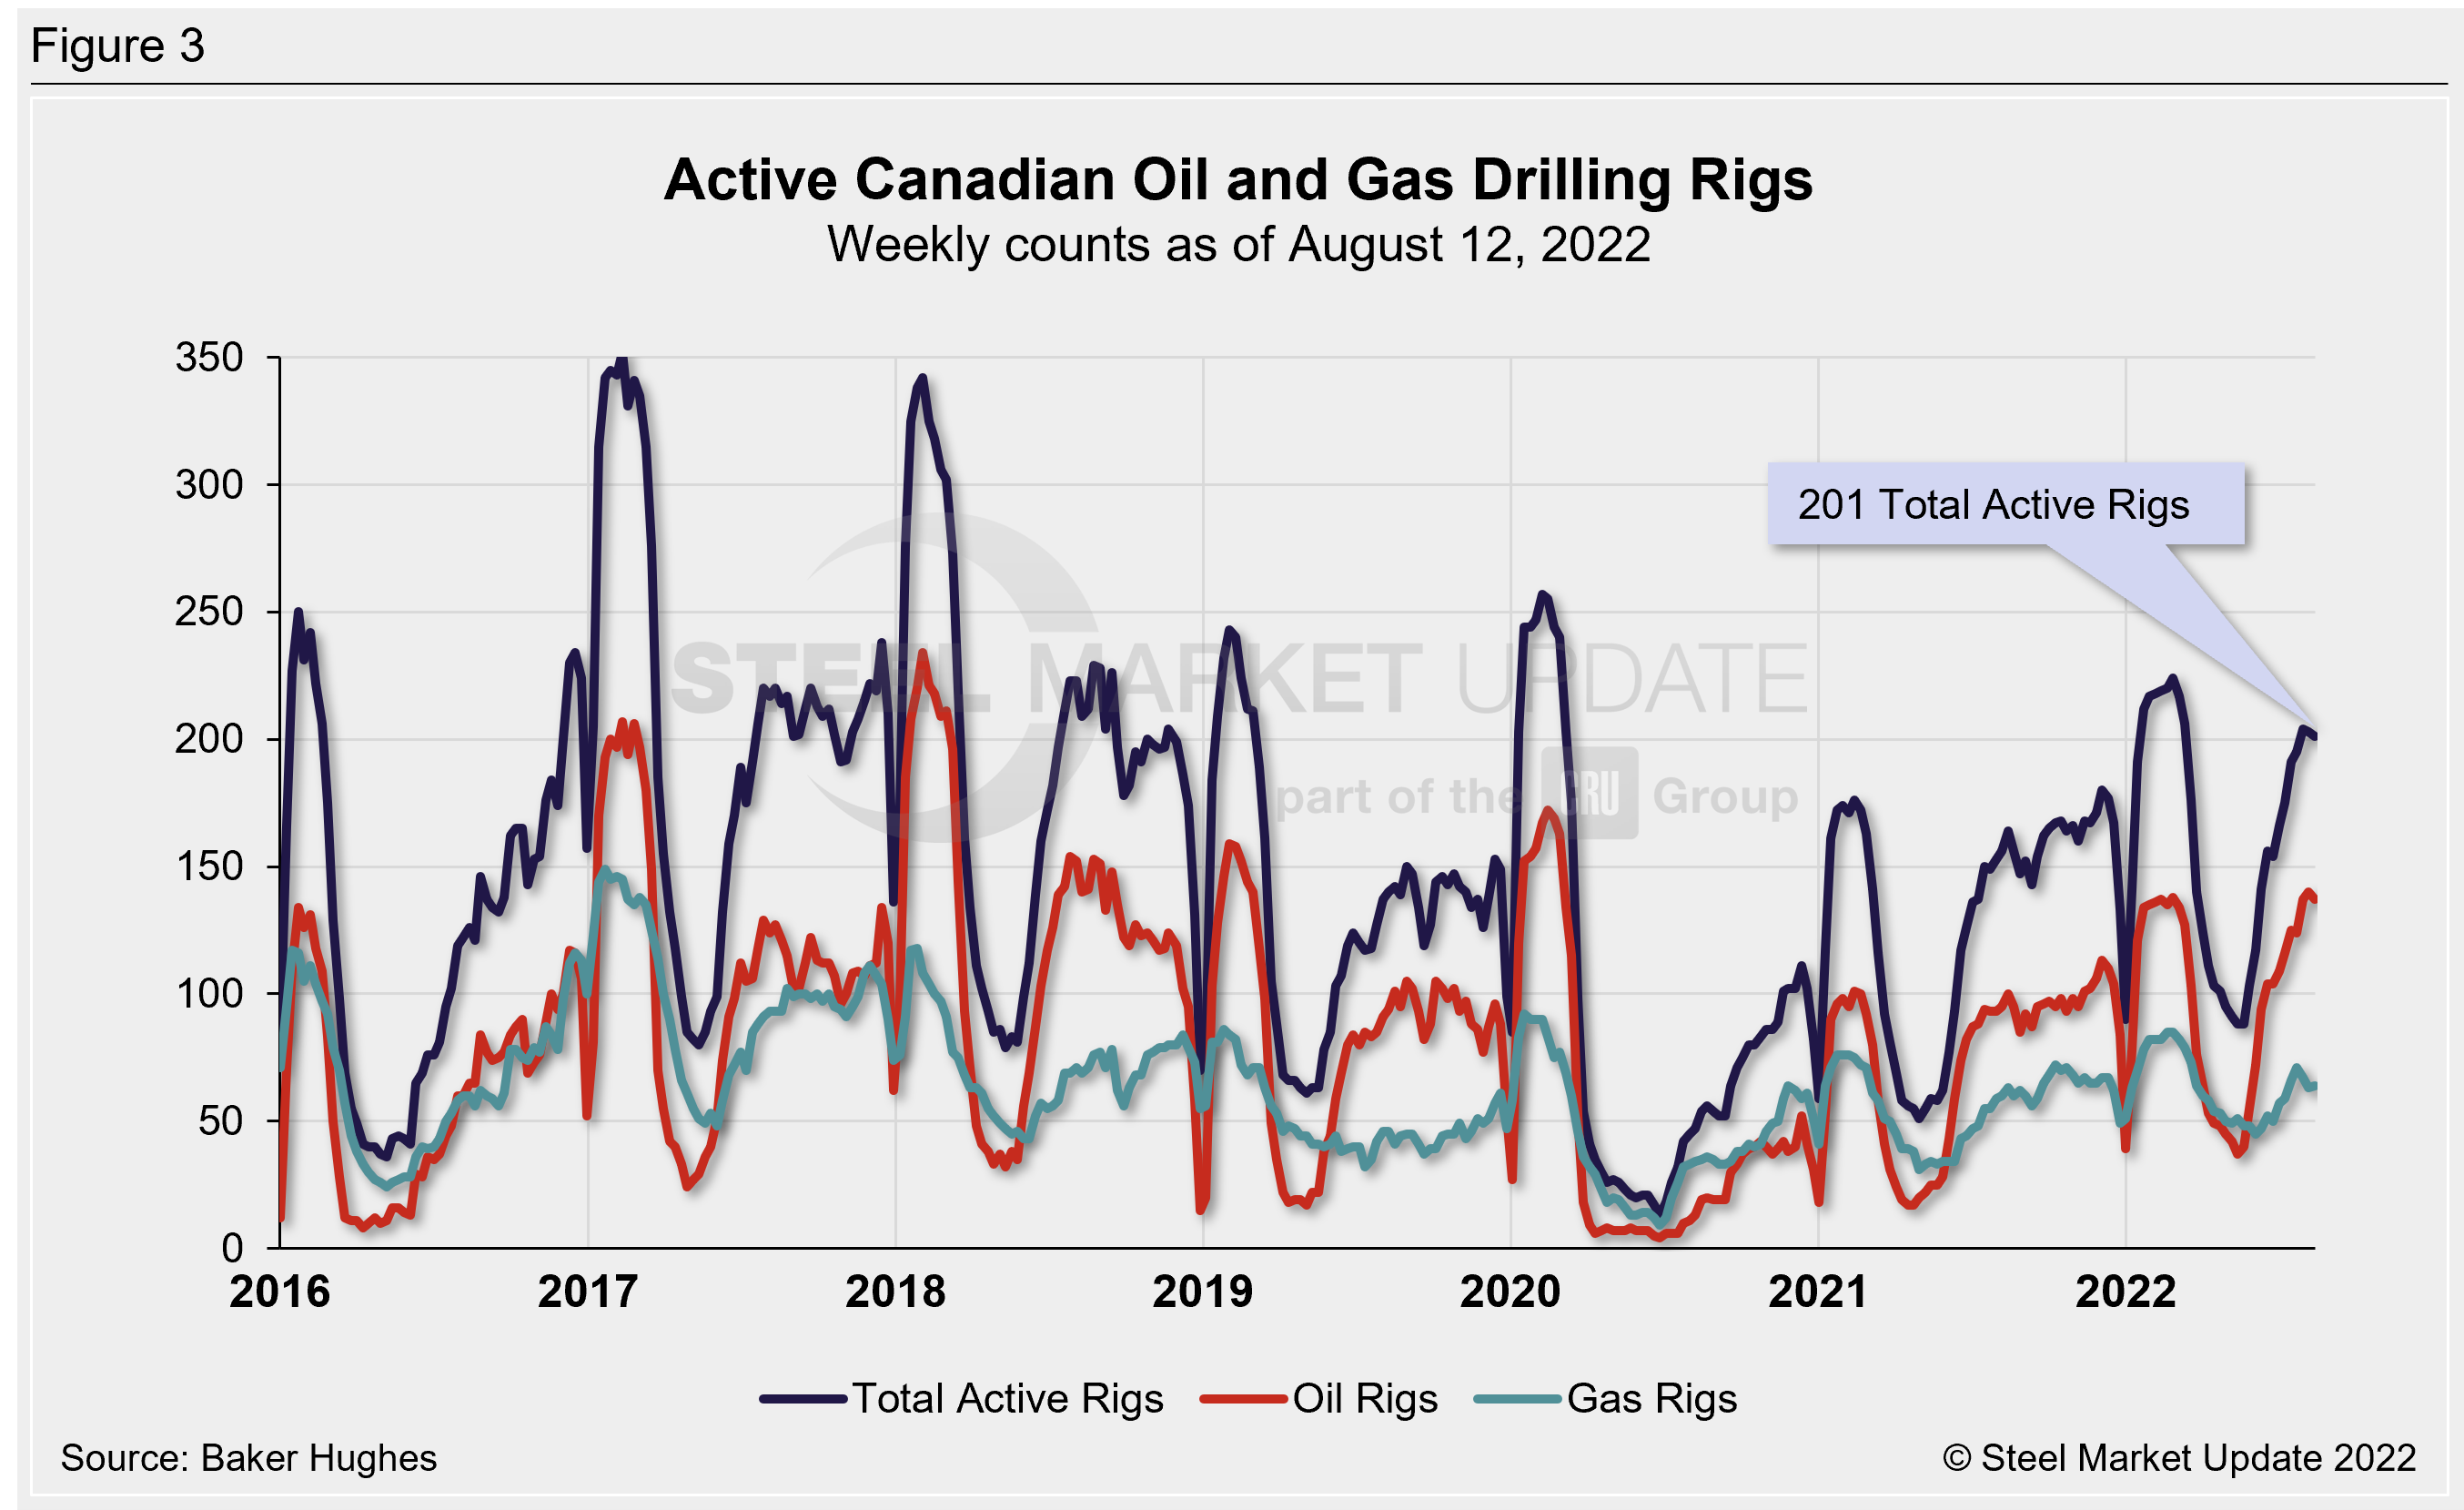
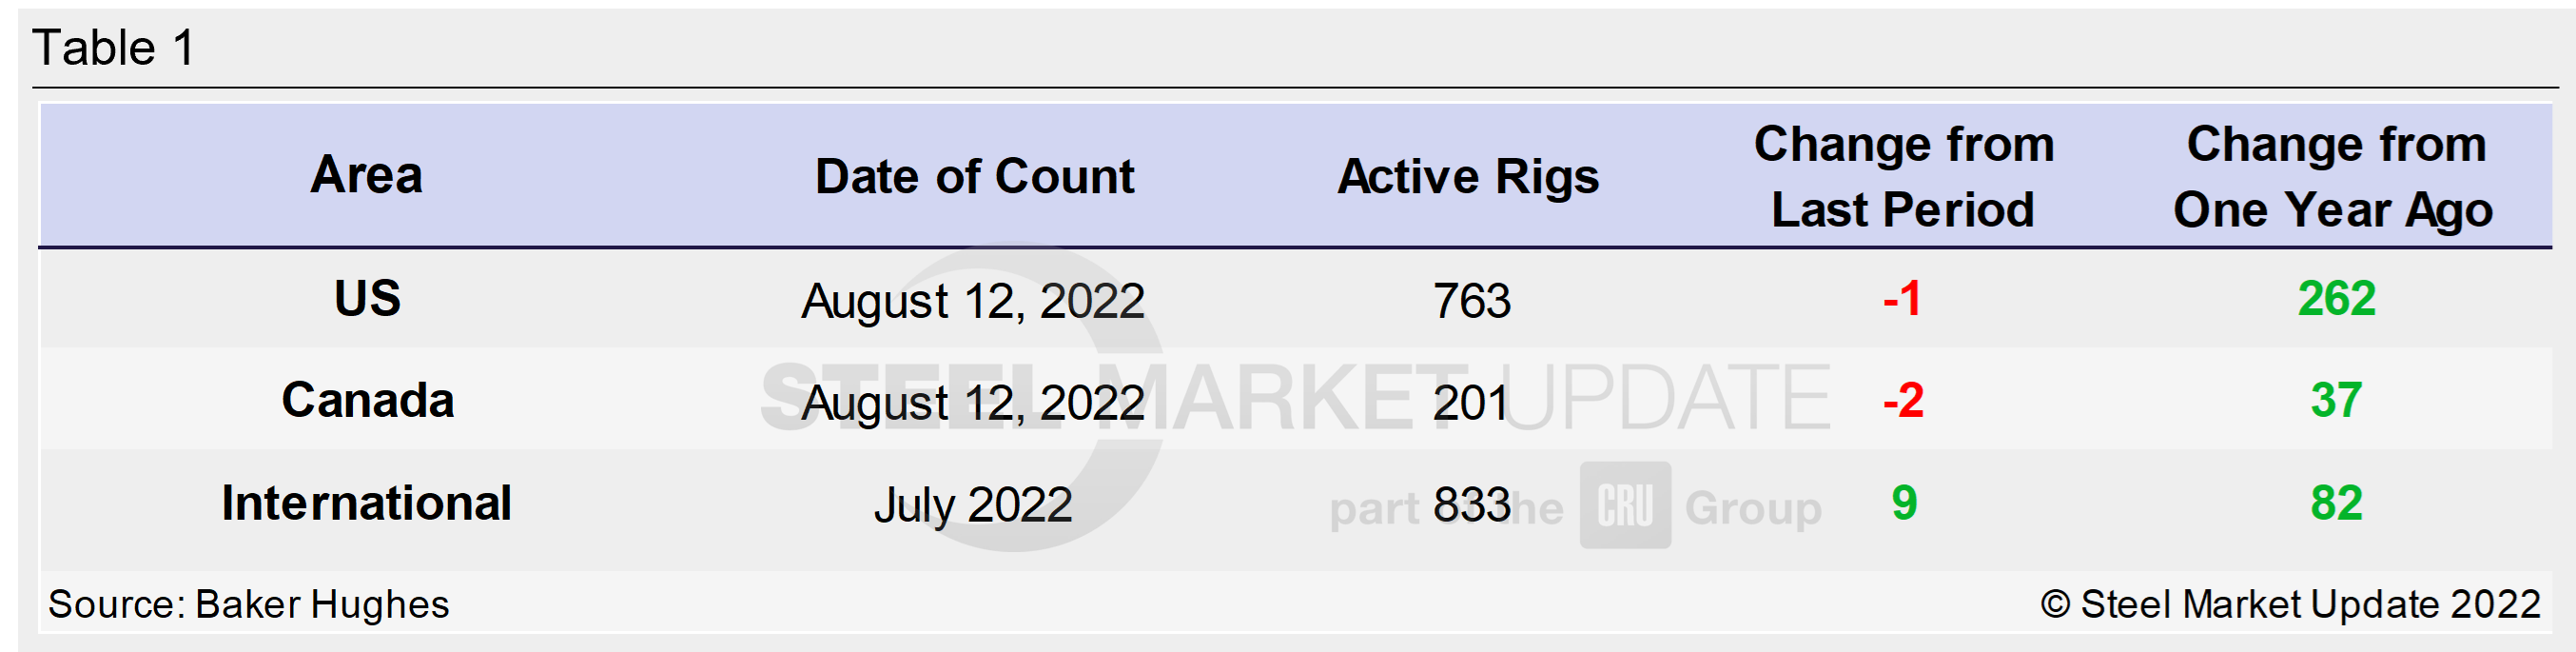
Table 1 below compares the current US, Canadian and international rig counts to historical levels.
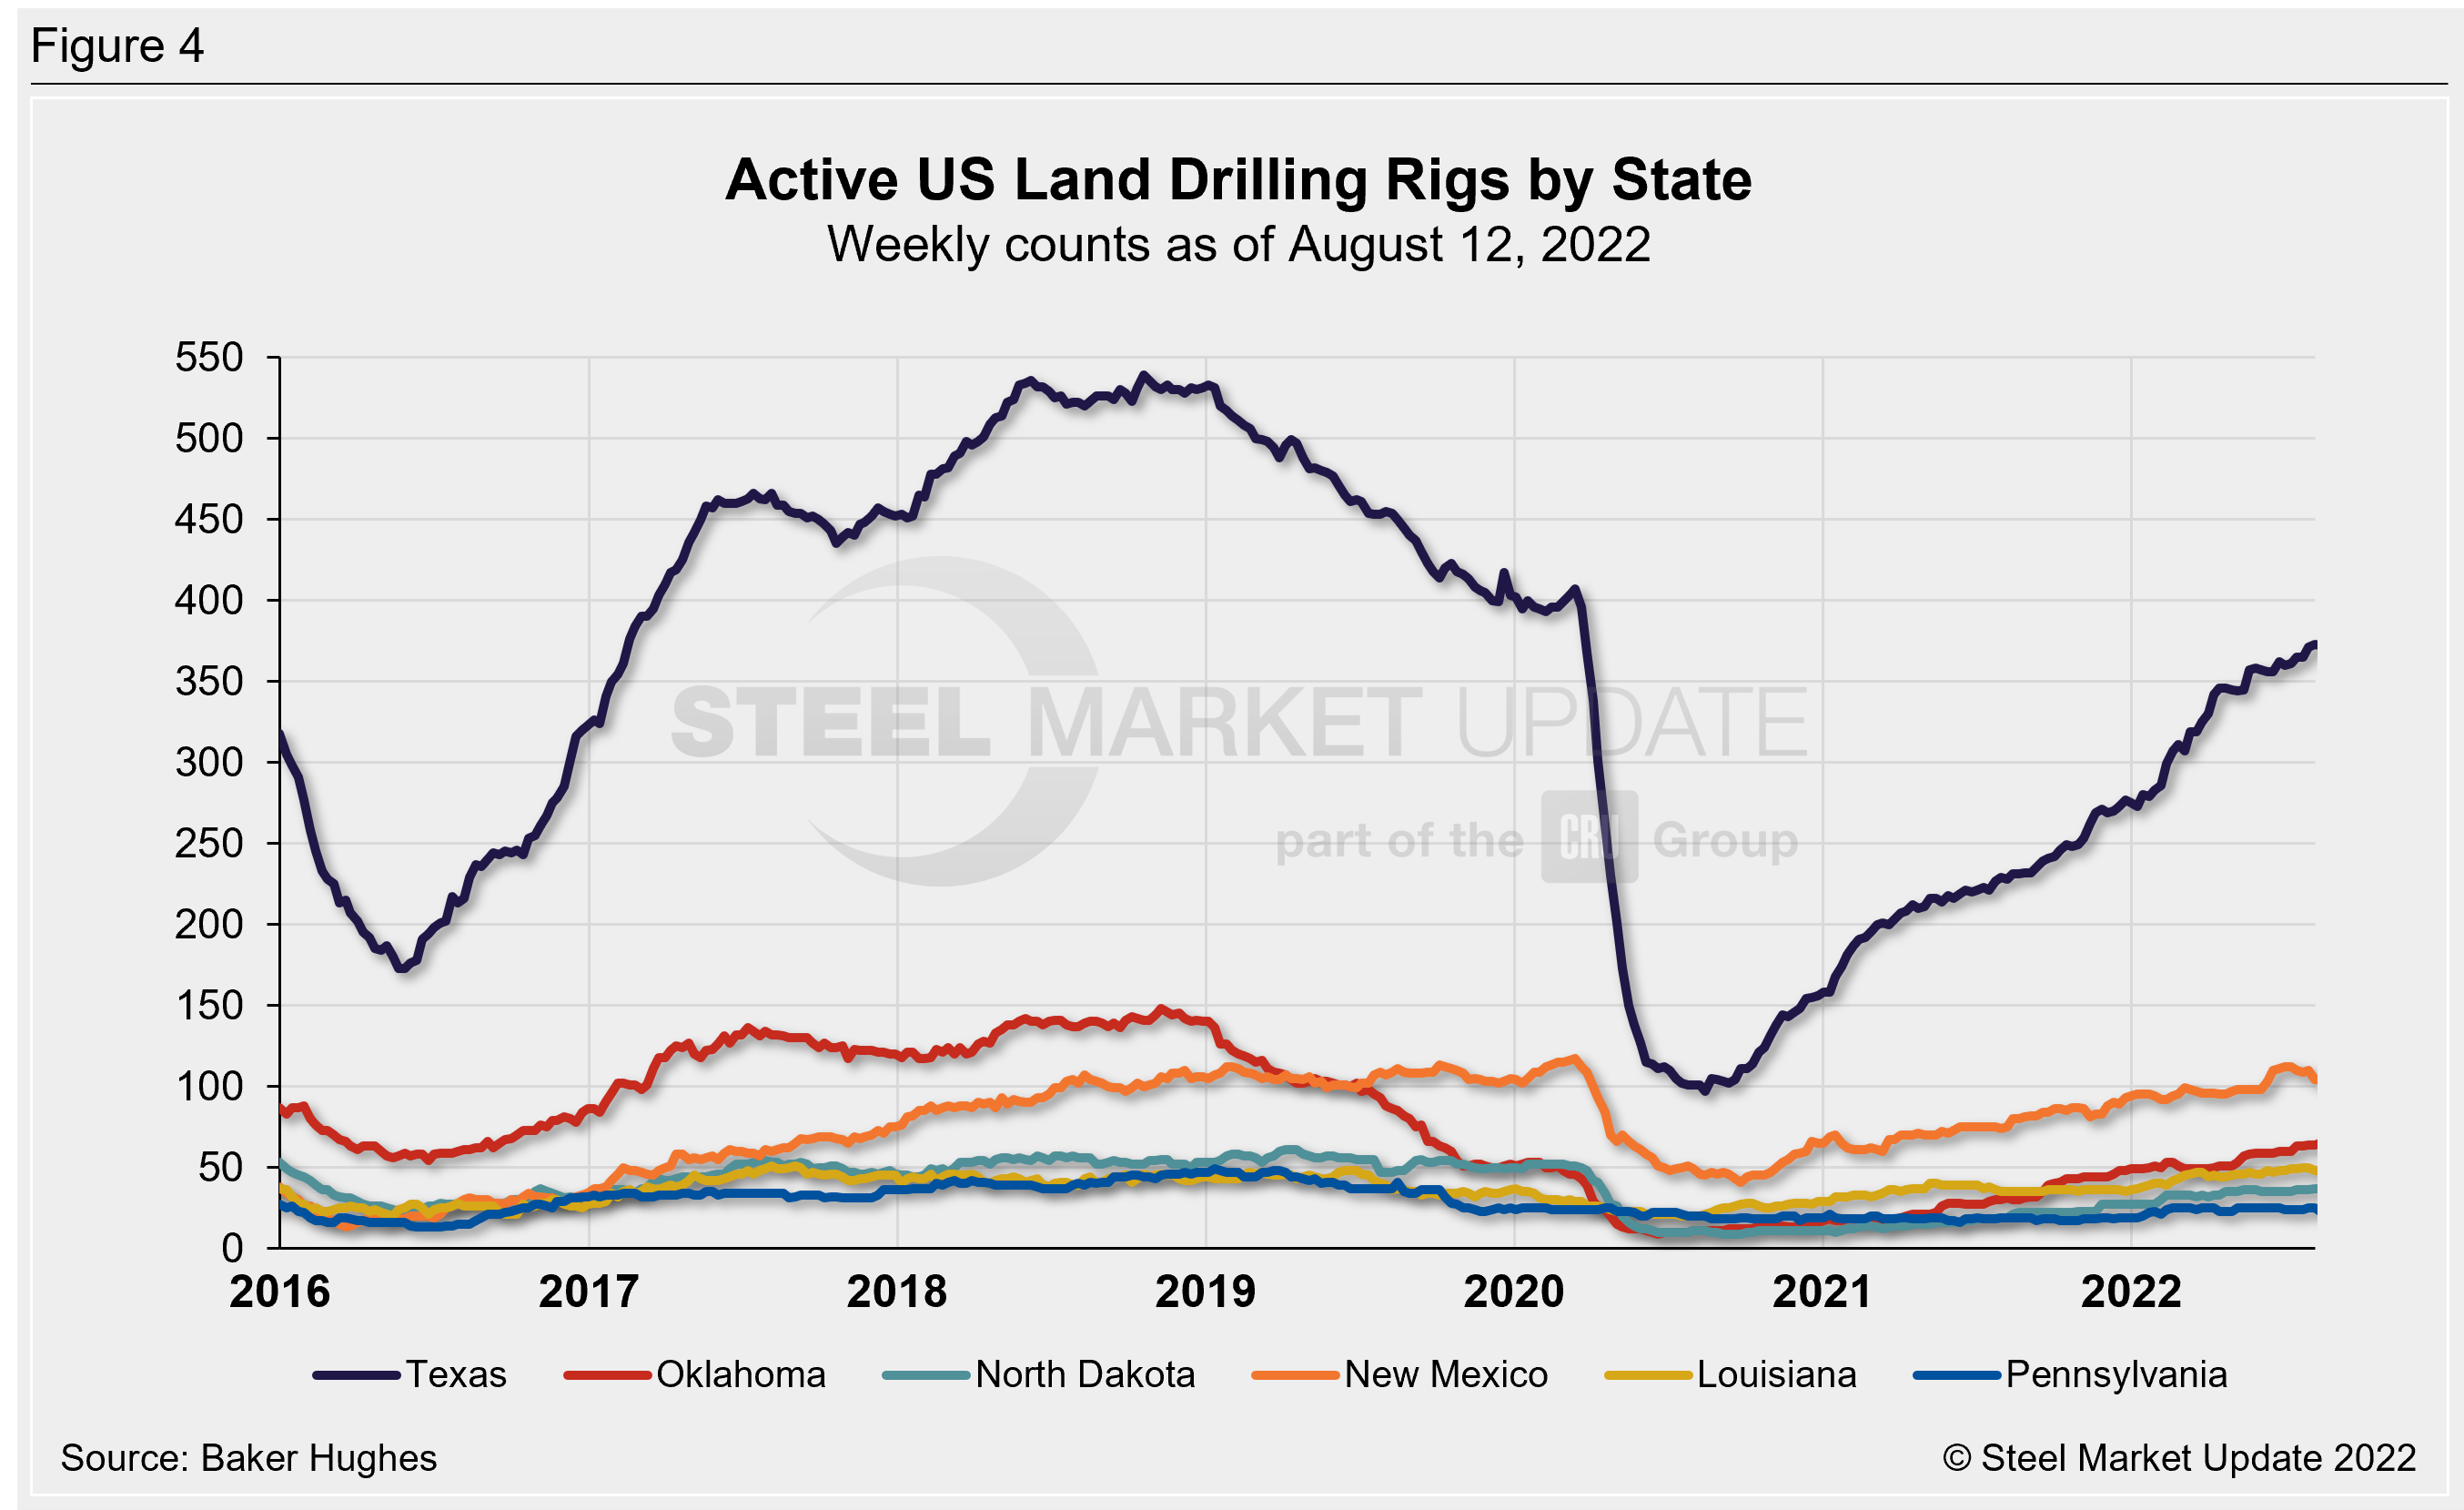
US oil and gas production are heavily concentrated in Texas, Oklahoma, North Dakota, and New Mexico. As of Aug. 12, production continues to steadily increase for each state (Figure 4). Texas is the most active state with 372 rigs in operation and New Mexico is the second highest with 104 rigs. Recall that the number of active Texas rigs had plummeted 76% in 2020, falling from 407 in April to 97 rigs in August.
Stock Levels
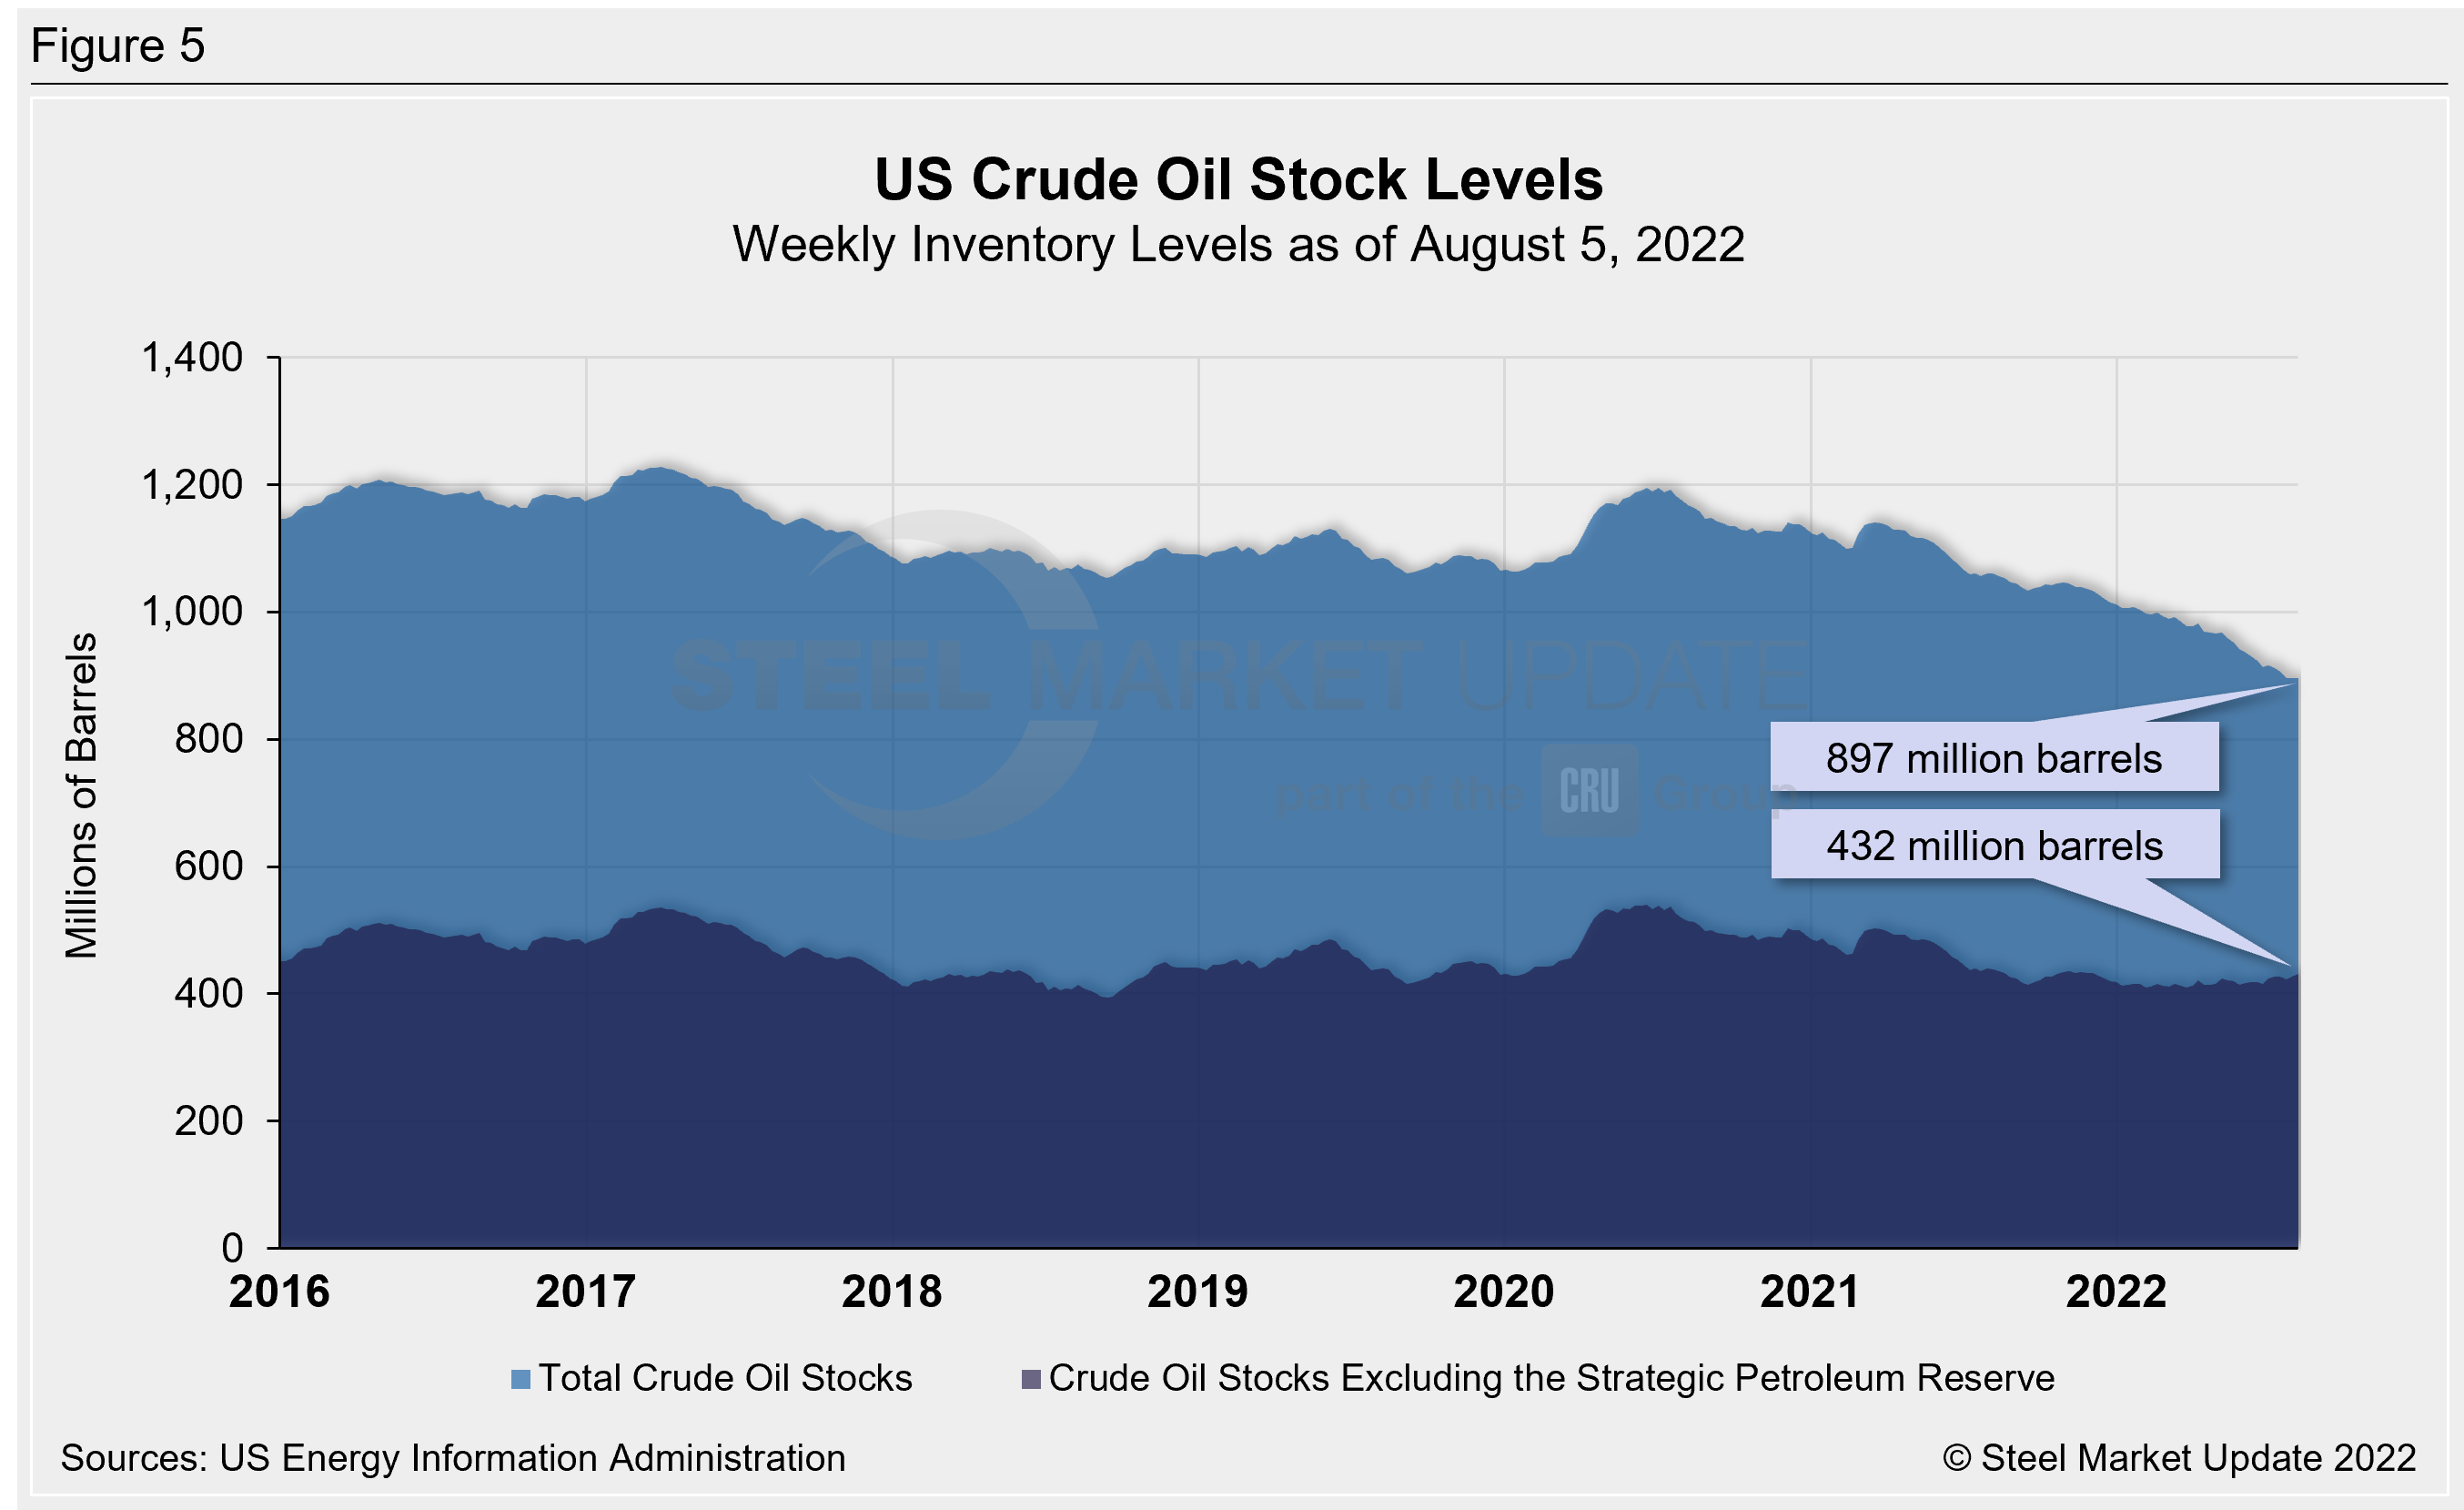
US total crude oil stocks continue to decline from mid-2020 highs, falling to an 18-year low of 896 million barrels in the last week of July. The latest stock level is 897 million barrels as of Aug. 5. For comparison, the record low in the EIA’s 40-year history was 608 million barrels in October 1982. Last week’s stock level is down 15% from 1.060 billion barrels one year ago (Figure 5).
Trends in energy prices and rig counts are an advanced indicator of demand for oil country tubular goods (OCTG), line pipe and other steel products.
By Brett Linton, Brett@SteelMarketUpdate.com


