

Market Data

November 23, 2022
November Energy Market Update
Written by Brett Linton
The Energy Information Administration’s (EIA) October Short-Term Energy Outlook (STEO) was released earlier this month, forecasting spot prices, production, and inventories for crude oil and natural gas. Crude oil prices are forecast to remain stable through the first quarter of 2023, while natural gas prices are expected to decline slightly after January. The EIA continues to note a level of uncertainty in its forecasts, explaining that: “Uncertainty in macroeconomic conditions could significantly affect energy markets in the forecast period.”
In this Premium analysis we cover oil and natural gas prices, North American drilling rig activity, active drill rigs by state, and US crude oil stock levels.
You can view the latest EIA Short-Term Energy Outlook here.
Oil and Gas Spot Prices
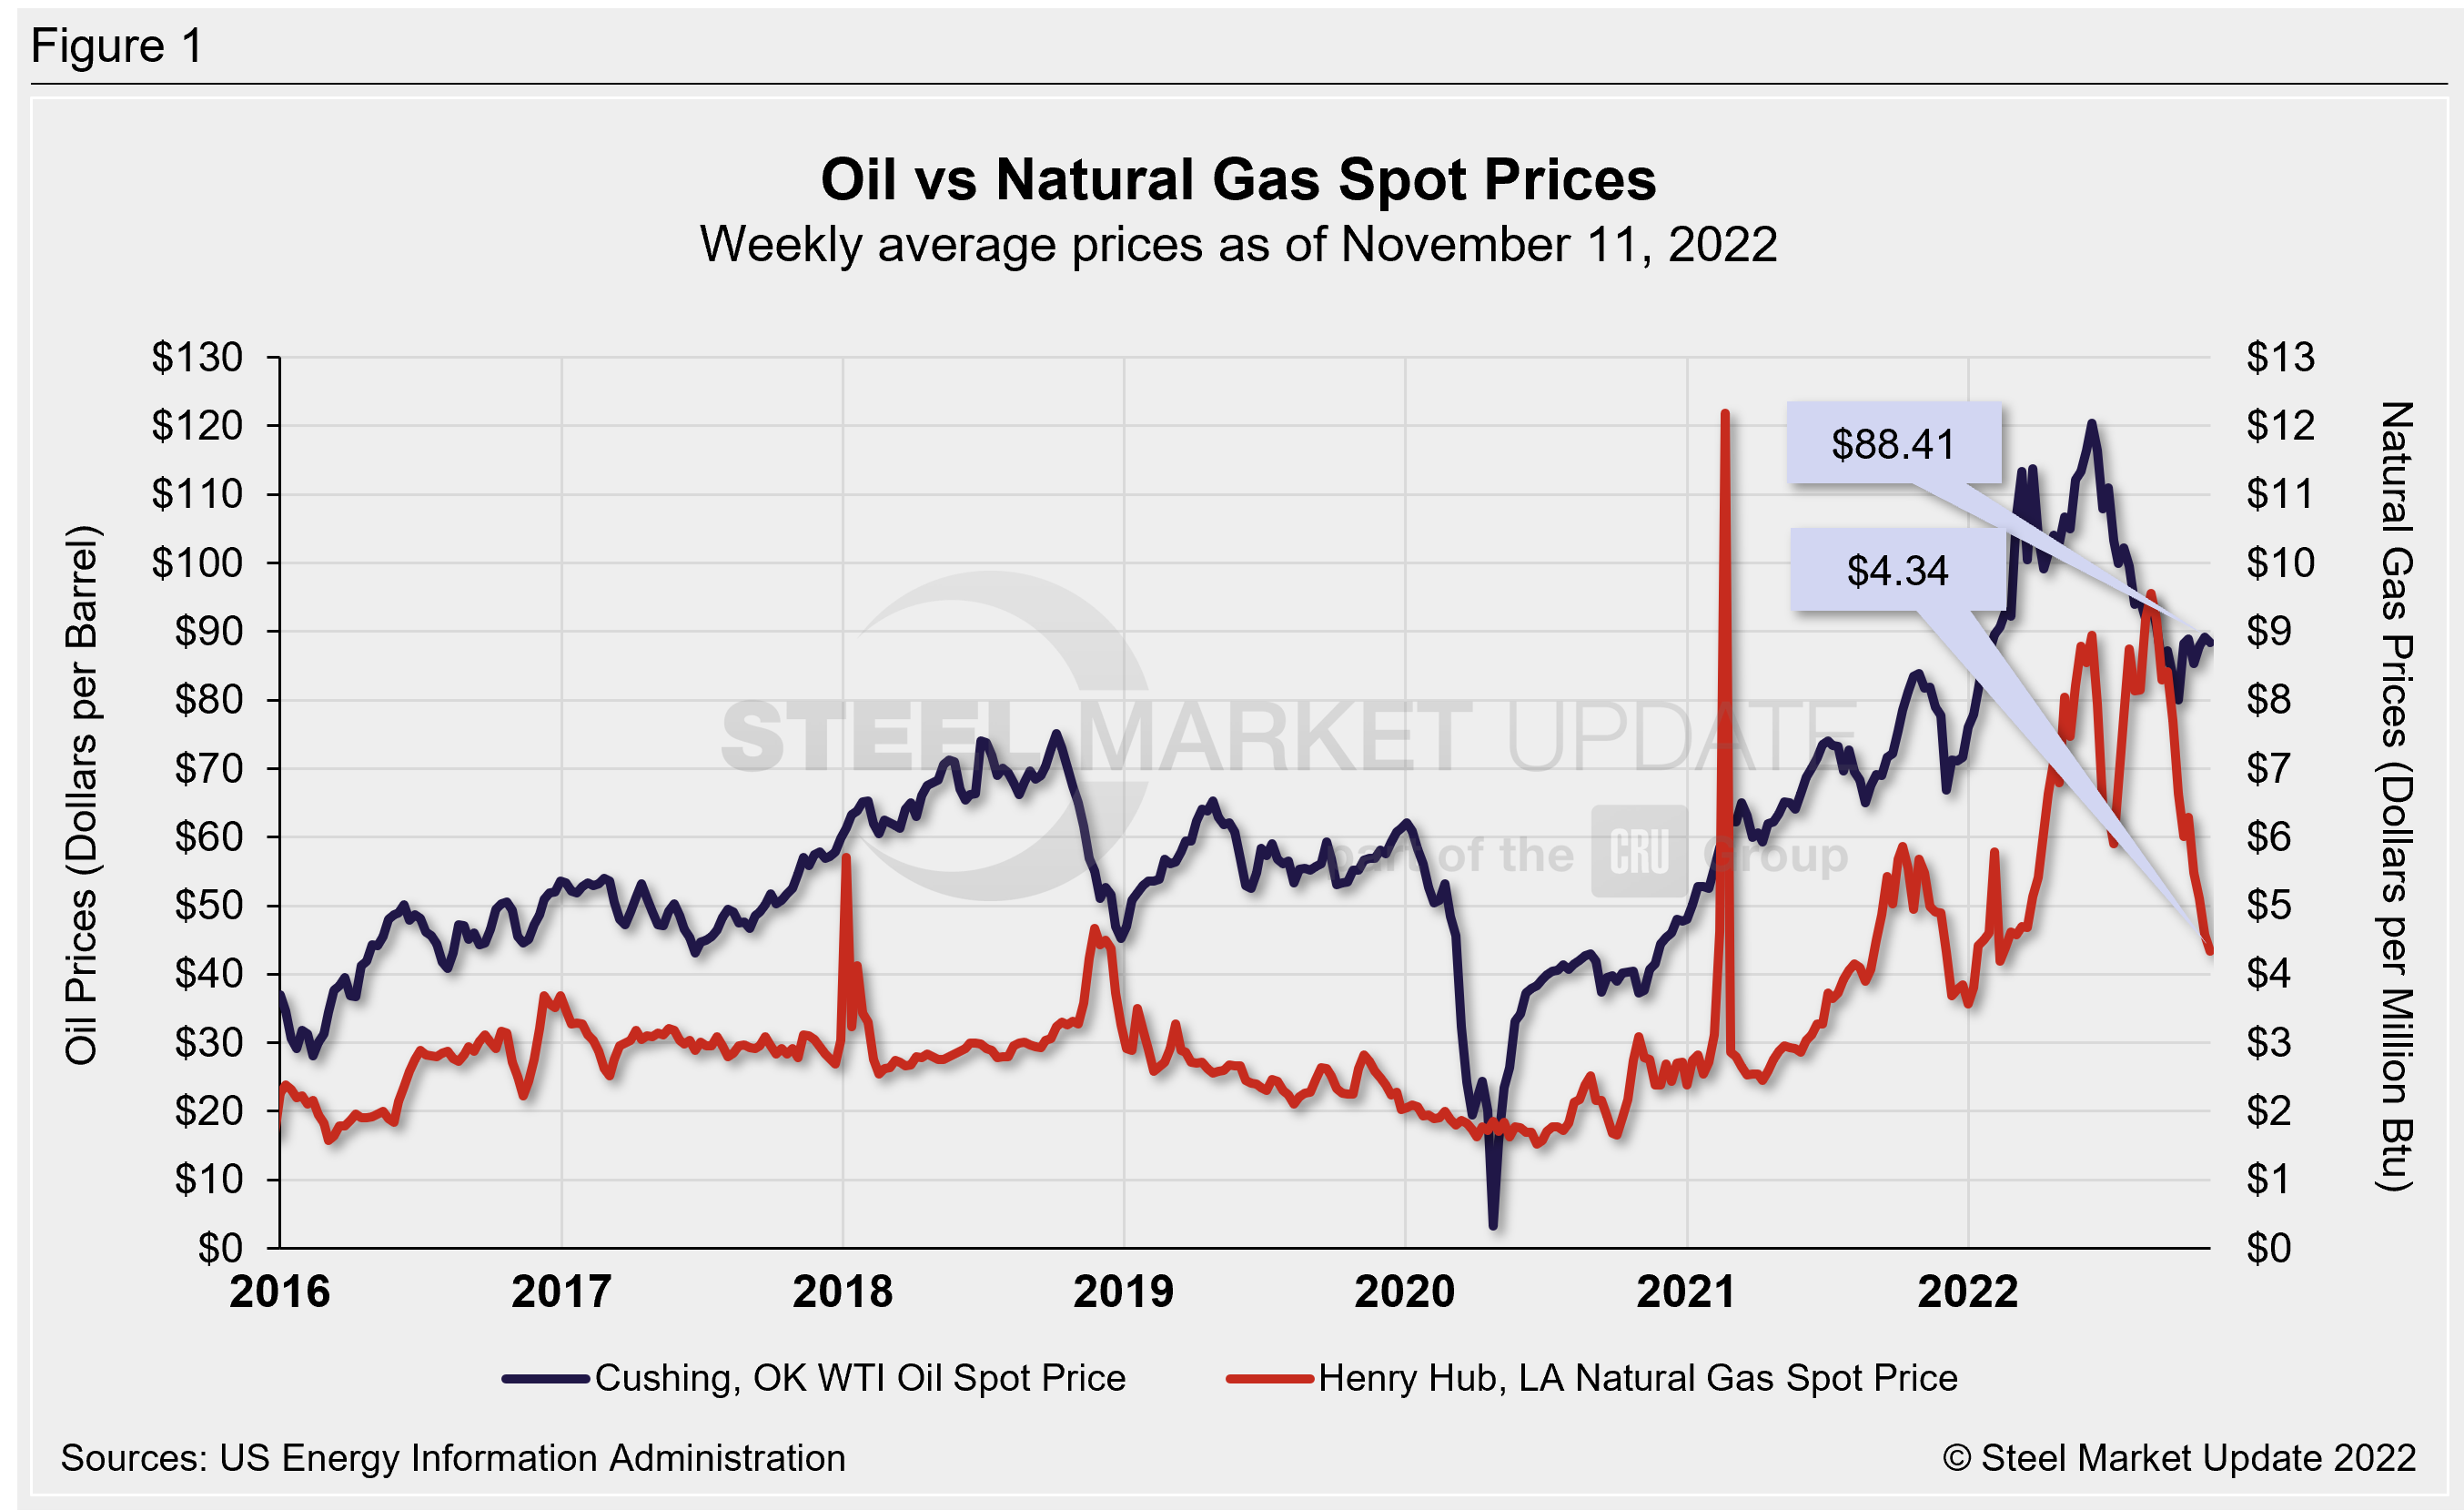
The weekly West Texas Intermediate oil spot market price was $88.41 per barrel as of the week ending Nov. 11 (Figure 1). Oil spot prices have been relatively steady since September, having reached a ten-month low of $80.08 per barrel on Sept. 30. Oil spot prices have been gradually easing from the 13+ year high of $120.43/b seen in early June. For comparison, the record high in the EIA’s 36-year data history occurred in July 2008 at $142.52/b. The EIA expects oil spot prices to average $94/b in the first half of 2023, averaging $95/b across 2023 (unchanged from its previous estimate).
Natural gas spot prices continue to rapidly decline, and are now at a nine-month low of $4.34 per Metric Million British Thermal Units (MMBTU). Recall prices reached a high of $9.56/MMBTU in late August. The record high in the EIA’s 36-year history was $14.49/MMBTU the week of Dec. 16, 2005. The EIA expects natural gas prices to average $6.00/MMBTU in Q4 2022 through Q1 2023 ($1.00/MMBUT lower than the October forecast). The November STEO explains, “We expect natural gas prices will decline after January as the deficit to the five-year average in inventories decreases.”
Rig Counts
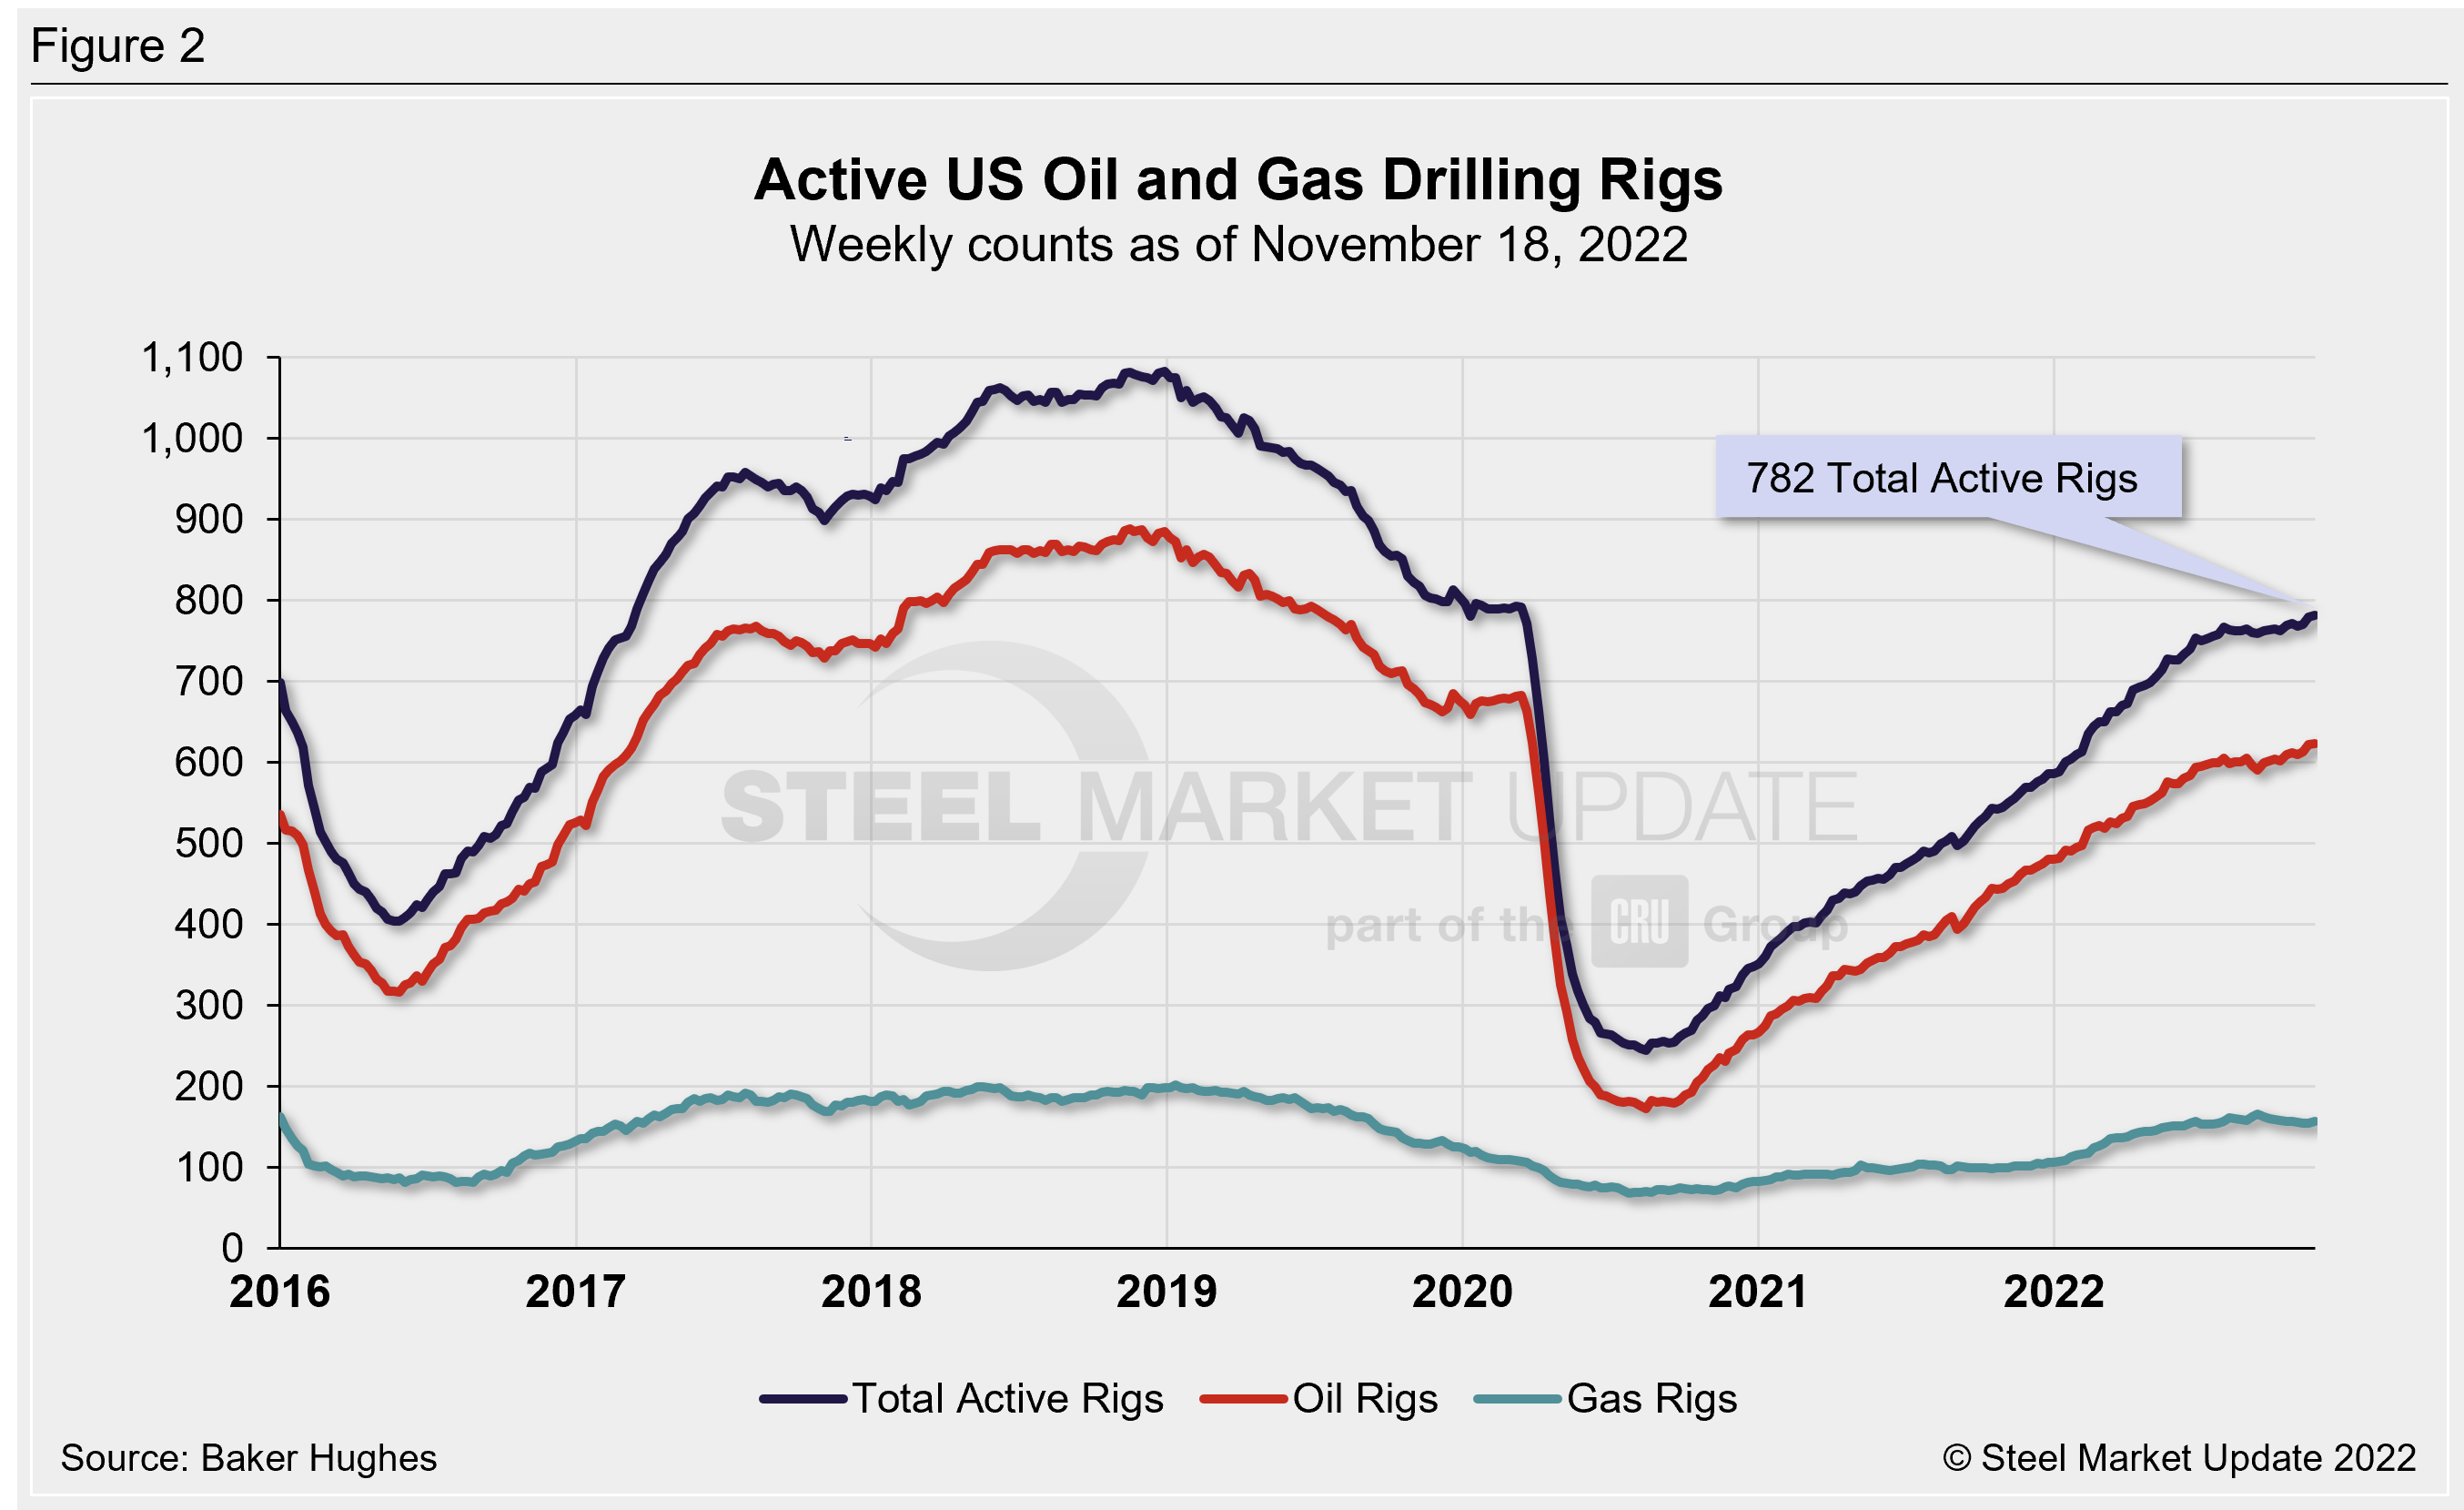
The number of active US oil and gas drill rigs continues to recover, down now just 1% compared to pre-Covid shutdowns in March 2020. The latest US count was 782 active drill rigs as of the end of last week, comprised of 623 oil rigs, 157 gas rigs, and two miscellaneous rigs, according to Baker Hughes (Figure 2). Active rig counts are up 39% versus this time last year.
The latest Canadian rig count is 201 rigs, comprised of 135 oil rigs and 66 gas rigs. The Canadian rig count has been easing since October but is in line with levels seen prior to 2020. Active Canadian rigs are up 20% compared to one year prior (Figure 3).
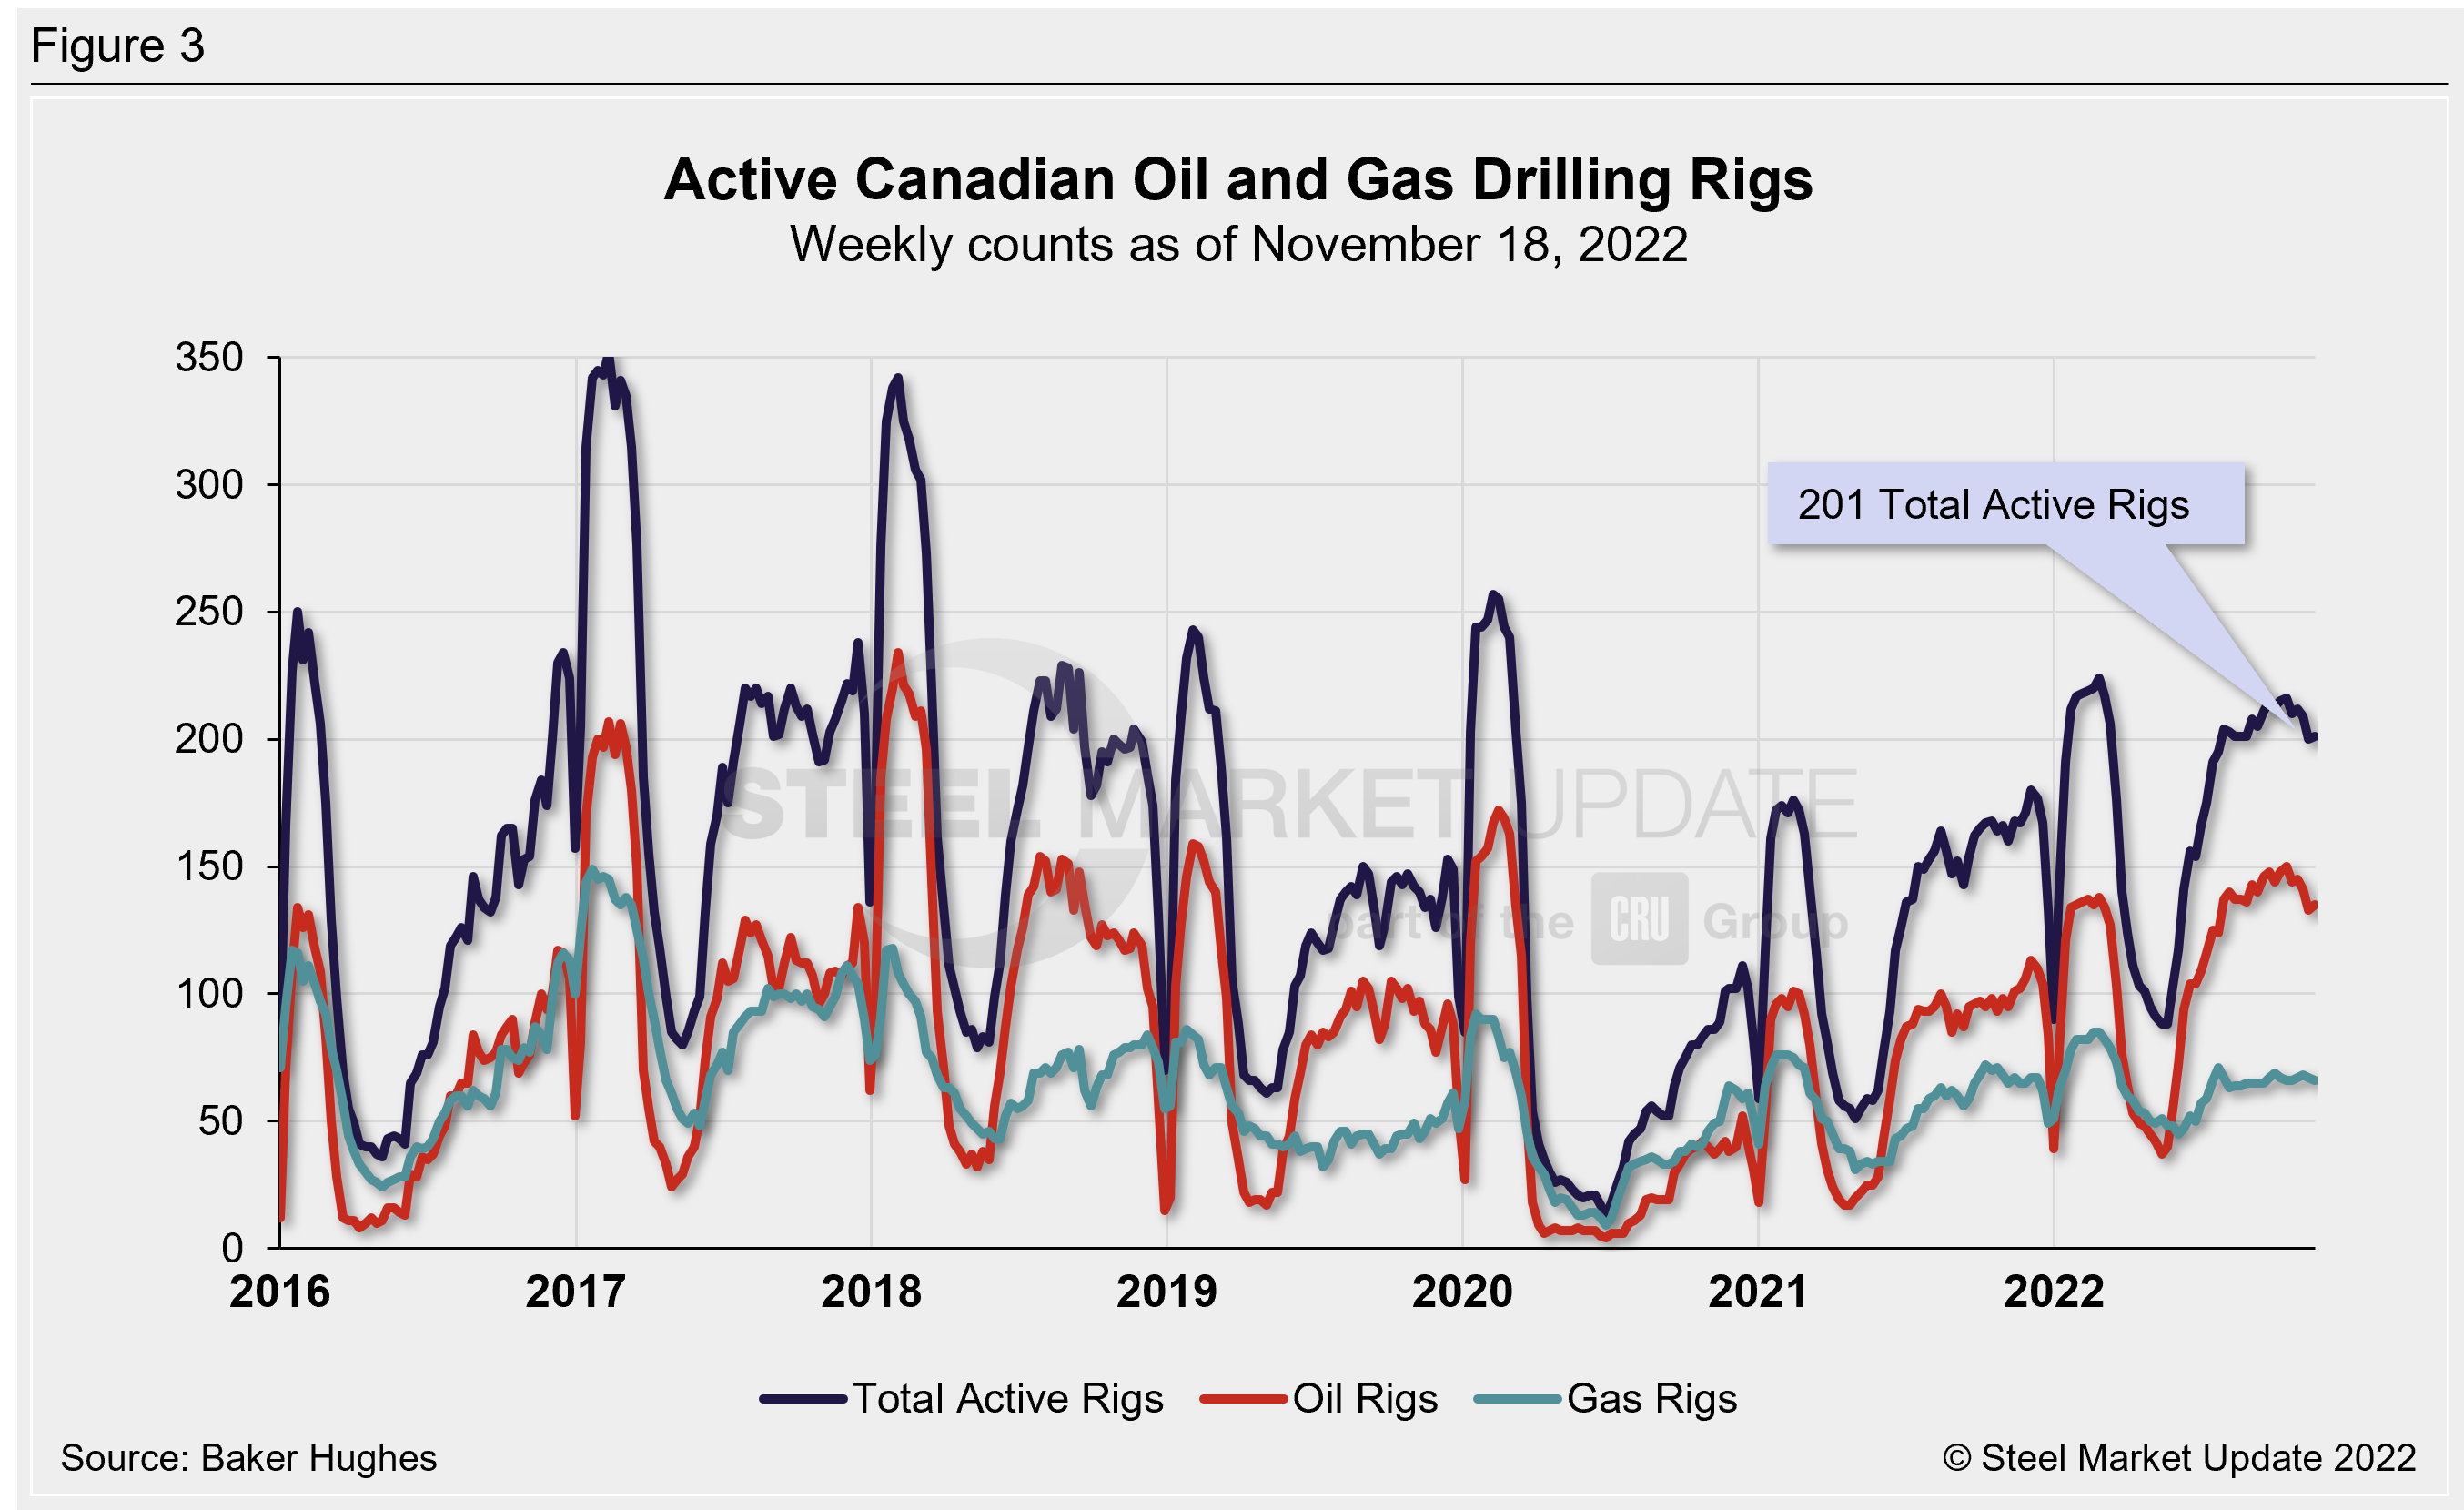
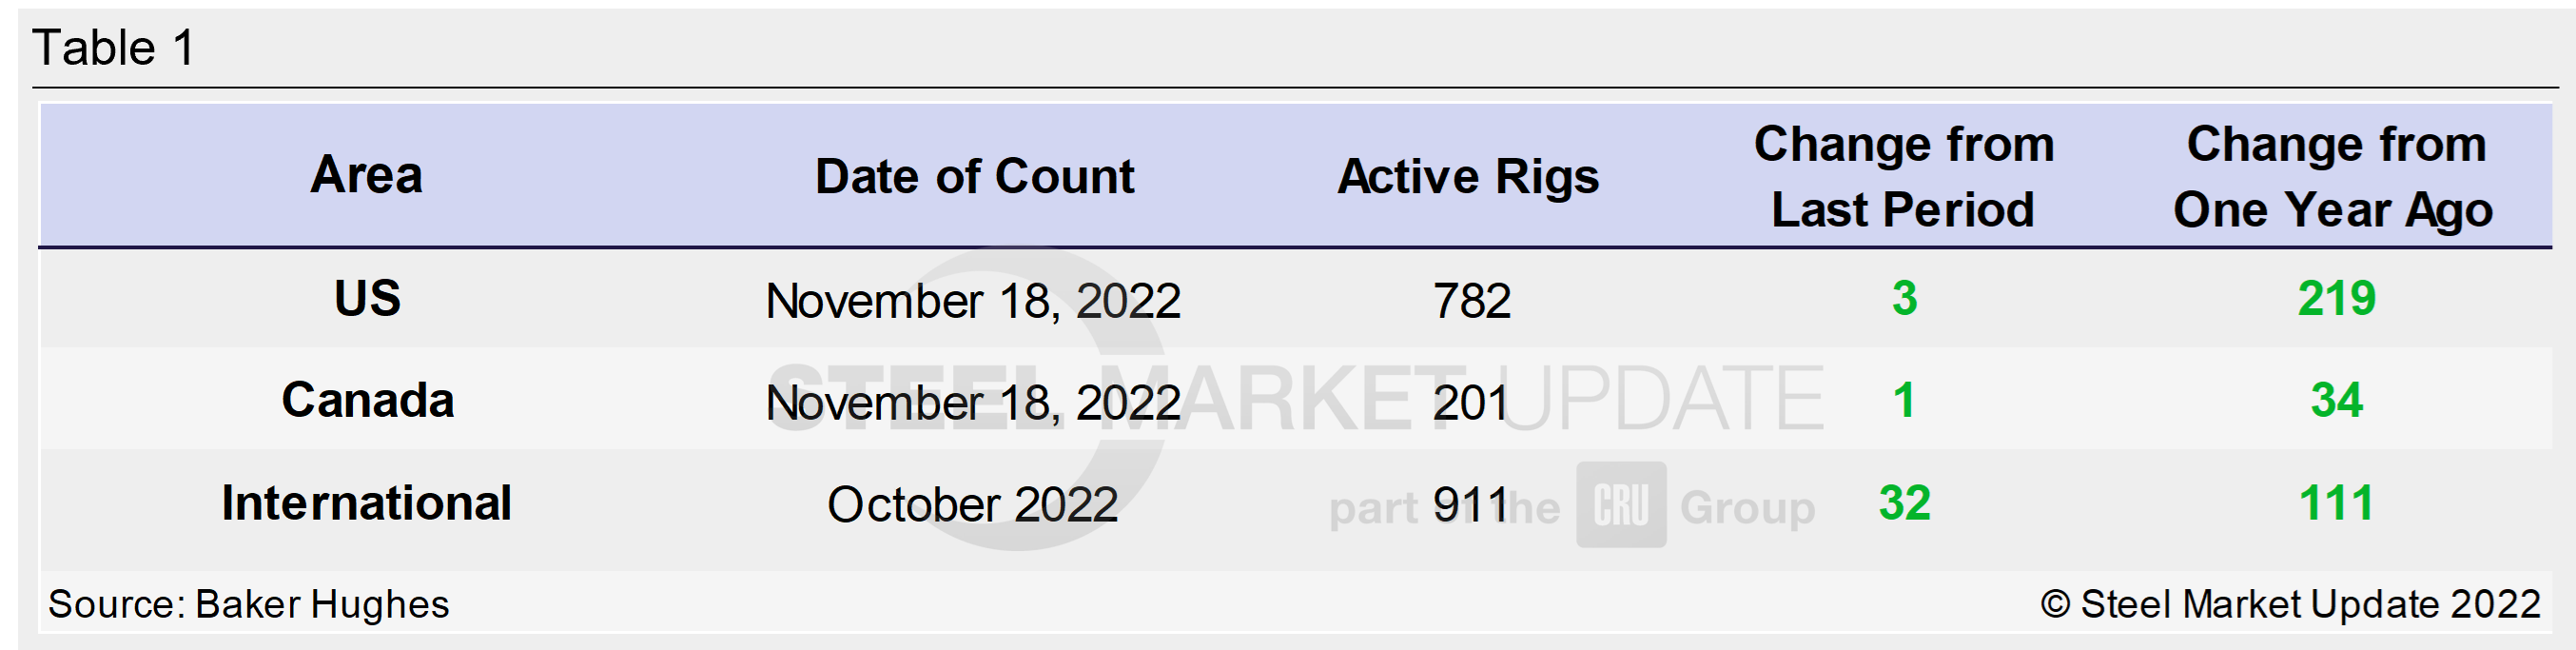
Table 1 below compares the current US, Canadian and international rig counts to historical levels.
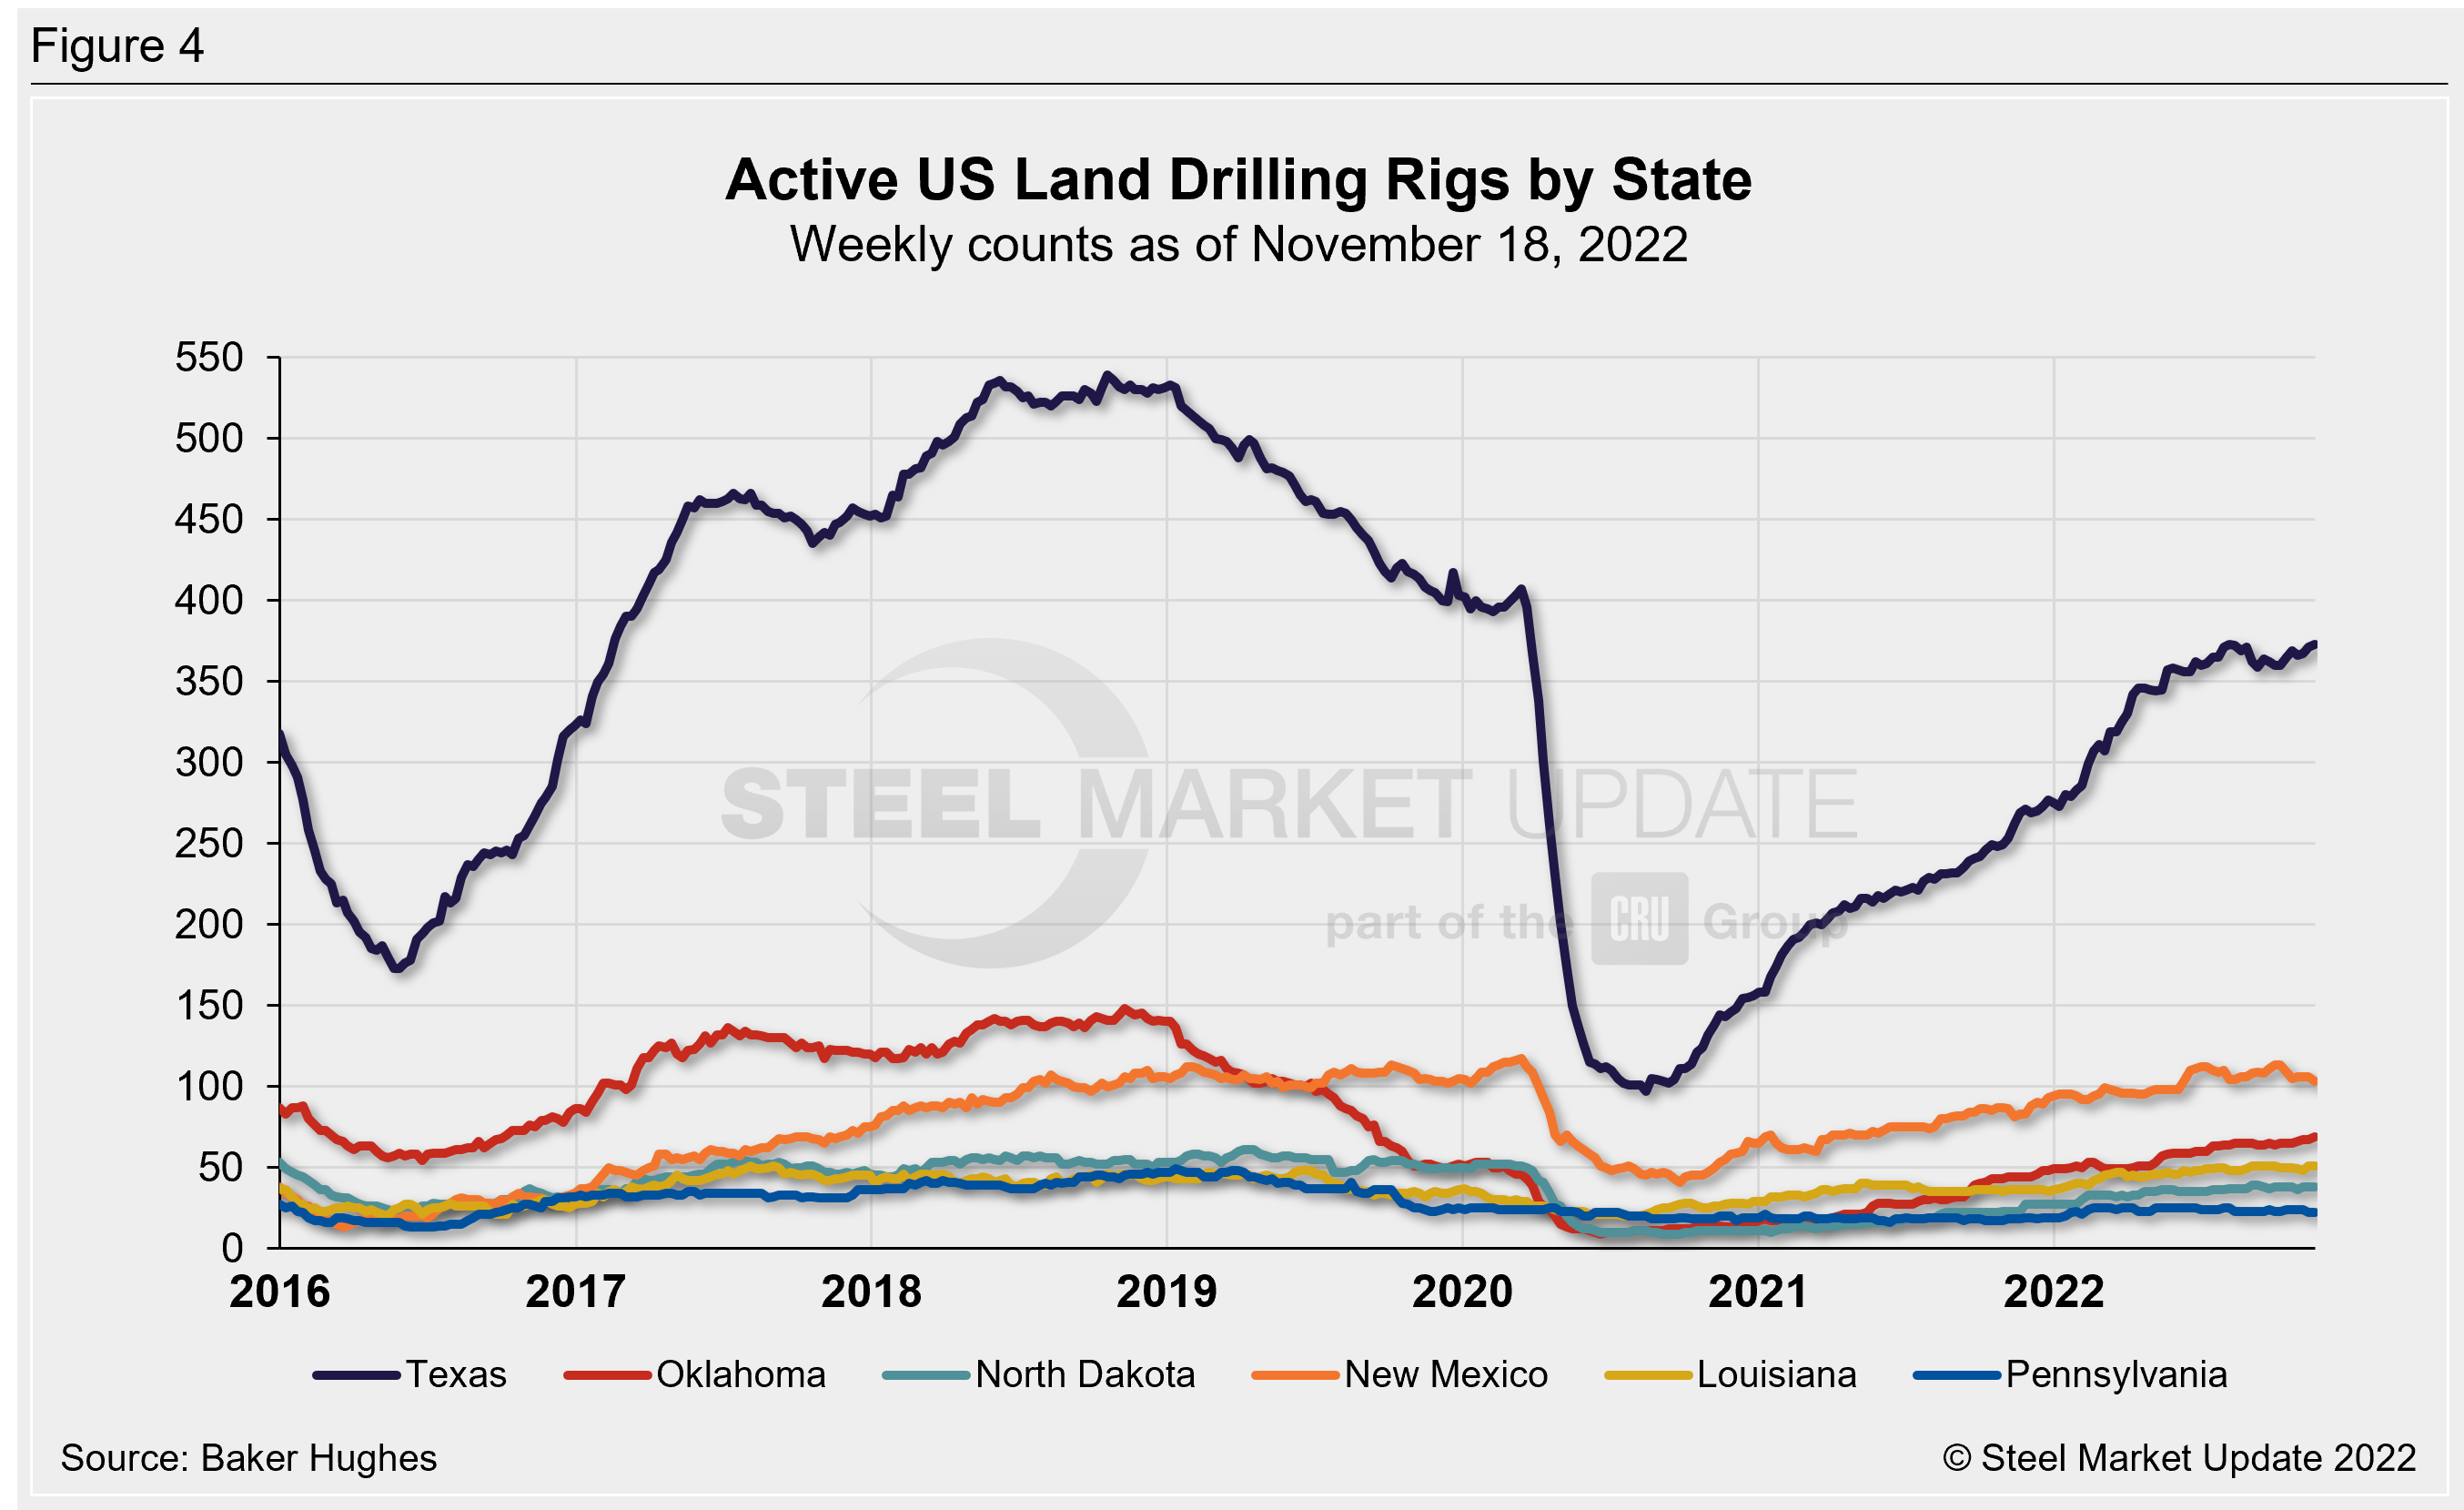
US oil and gas production is heavily concentrated in Texas, Oklahoma, North Dakota, and New Mexico. Production levels continue to improve for each state, but not all activity has recovered to pre-2020 levels (Figure 4). As of Nov. 18, Texas is the most active state with 373 rigs in operation and New Mexico is the second highest with 103 rigs. Recall that the number of active Texas rigs had plummeted 76% in 2020, falling from 407 in April to 97 rigs in August.
Stock Levels
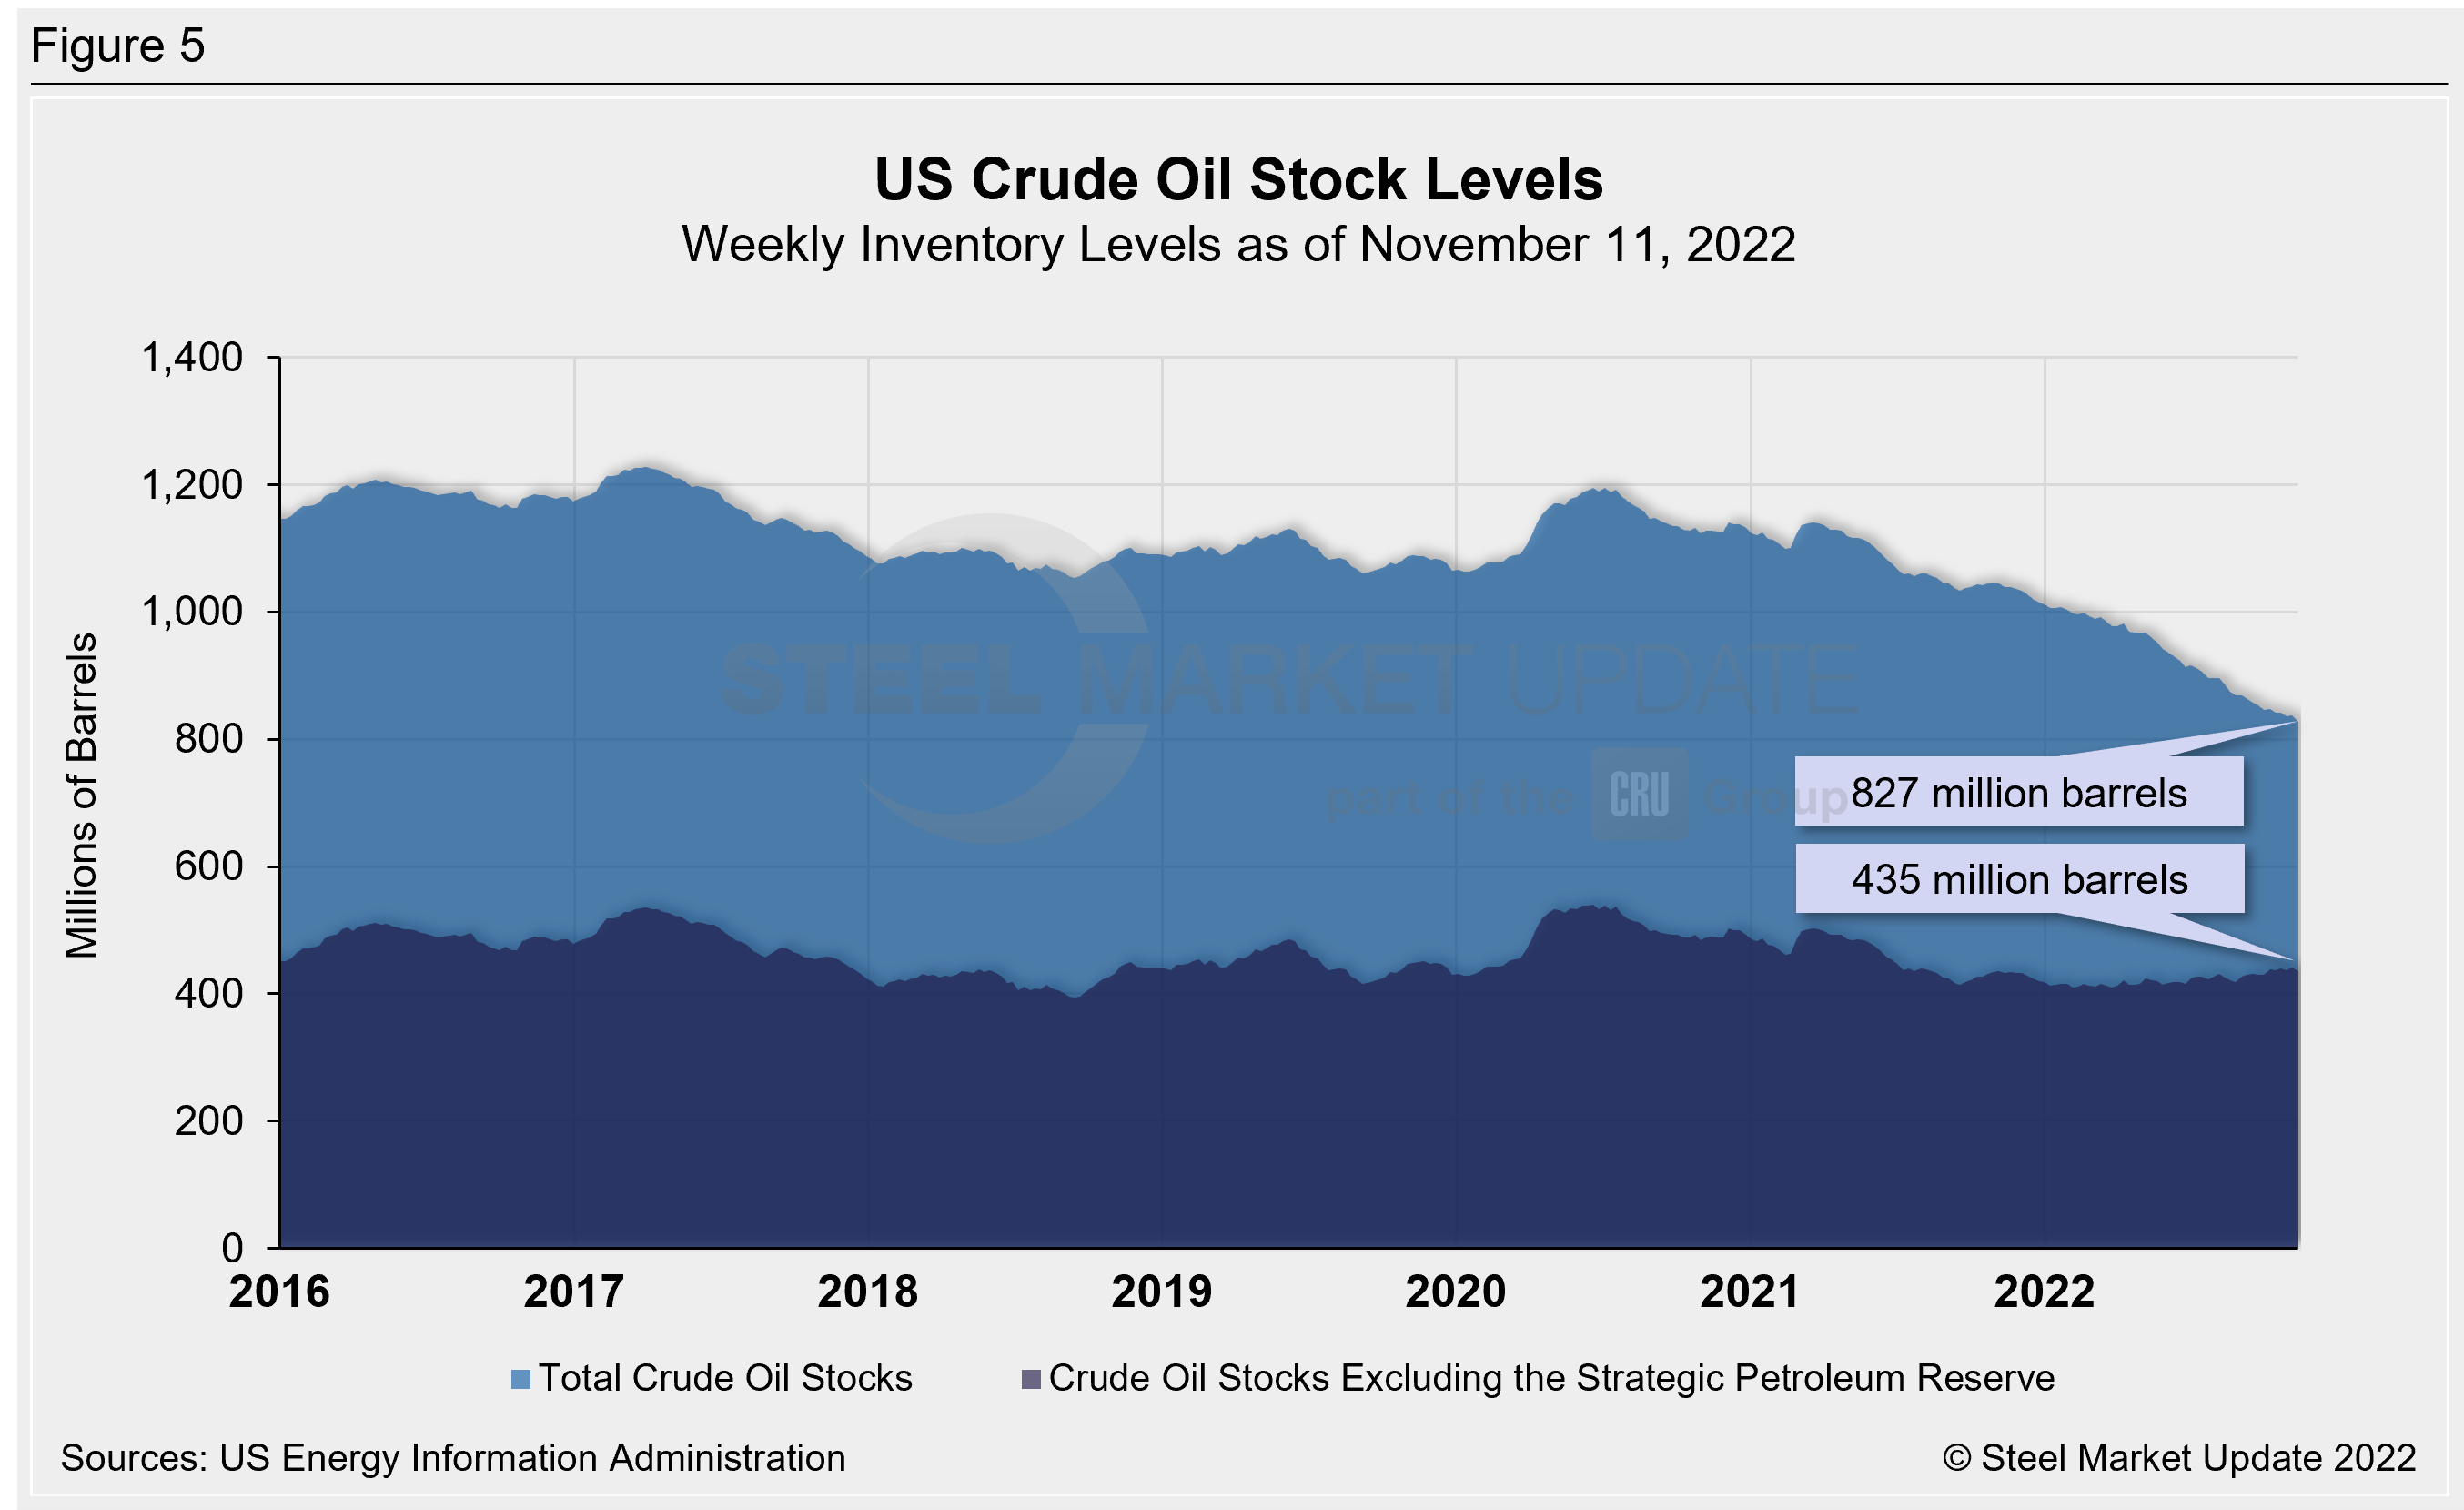
US crude oil stocks continue to decline from 2020 highs, reaching a 21-year low of 827 million barrels last week. For comparison, the record low in the EIA’s 40-year history was 608 million barrels in October 1982. Last week’s stock level is down 20% from 1.044 billion barrels one year ago (Figure 5).
Trends in energy prices and rig counts are an advanced indicator of demand for oil country tubular goods (OCTG), line pipe and other steel products.
By Brett Linton, Brett@SteelMarketUpdate.com


