

Market Data
March 8, 2023
SMU Key Market Indicators Improve
Written by David Schollaert
Editor’s note: Steel Market Update is pleased to share this Premium content with Executive members. For information on how to upgrade to a Premium-level subscription, contact Lindsey Fox at lindsey@steelmarketupdate.com.
Monthly Key Market Indicators (KMI) improved over the past month, advancing repeatedly since hitting a recent low last November, according to the latest analysis by Steel Market Update. Steel buyer sentiment also increased, mirroring a similar trend over the same period after tumbling to a 26-month low in Q4 2022. Positive and neutral indicators have improved, while negative indicators waned.
Despite recent improvements, headwinds remain. The economy has shown some continued signs of strength in employment totals, while GDP has seen repeatedly lower revisions on weaker consumer demand. The addition of a housing bubble that could soon burst has piled on to mounting troubles.
With more Federal Reserve rate hikes still possible to tame inflation, consumer confidence has also deteriorated, as many wonder if there could be more pain ahead if benchmark lending rates are driven higher.
Despite decade-high inflation and ongoing supply disruptions continuing to weigh on the economy, consumers and businesses have remained, in many ways, resolute. As a result, the outlook has improved since our last analysis.
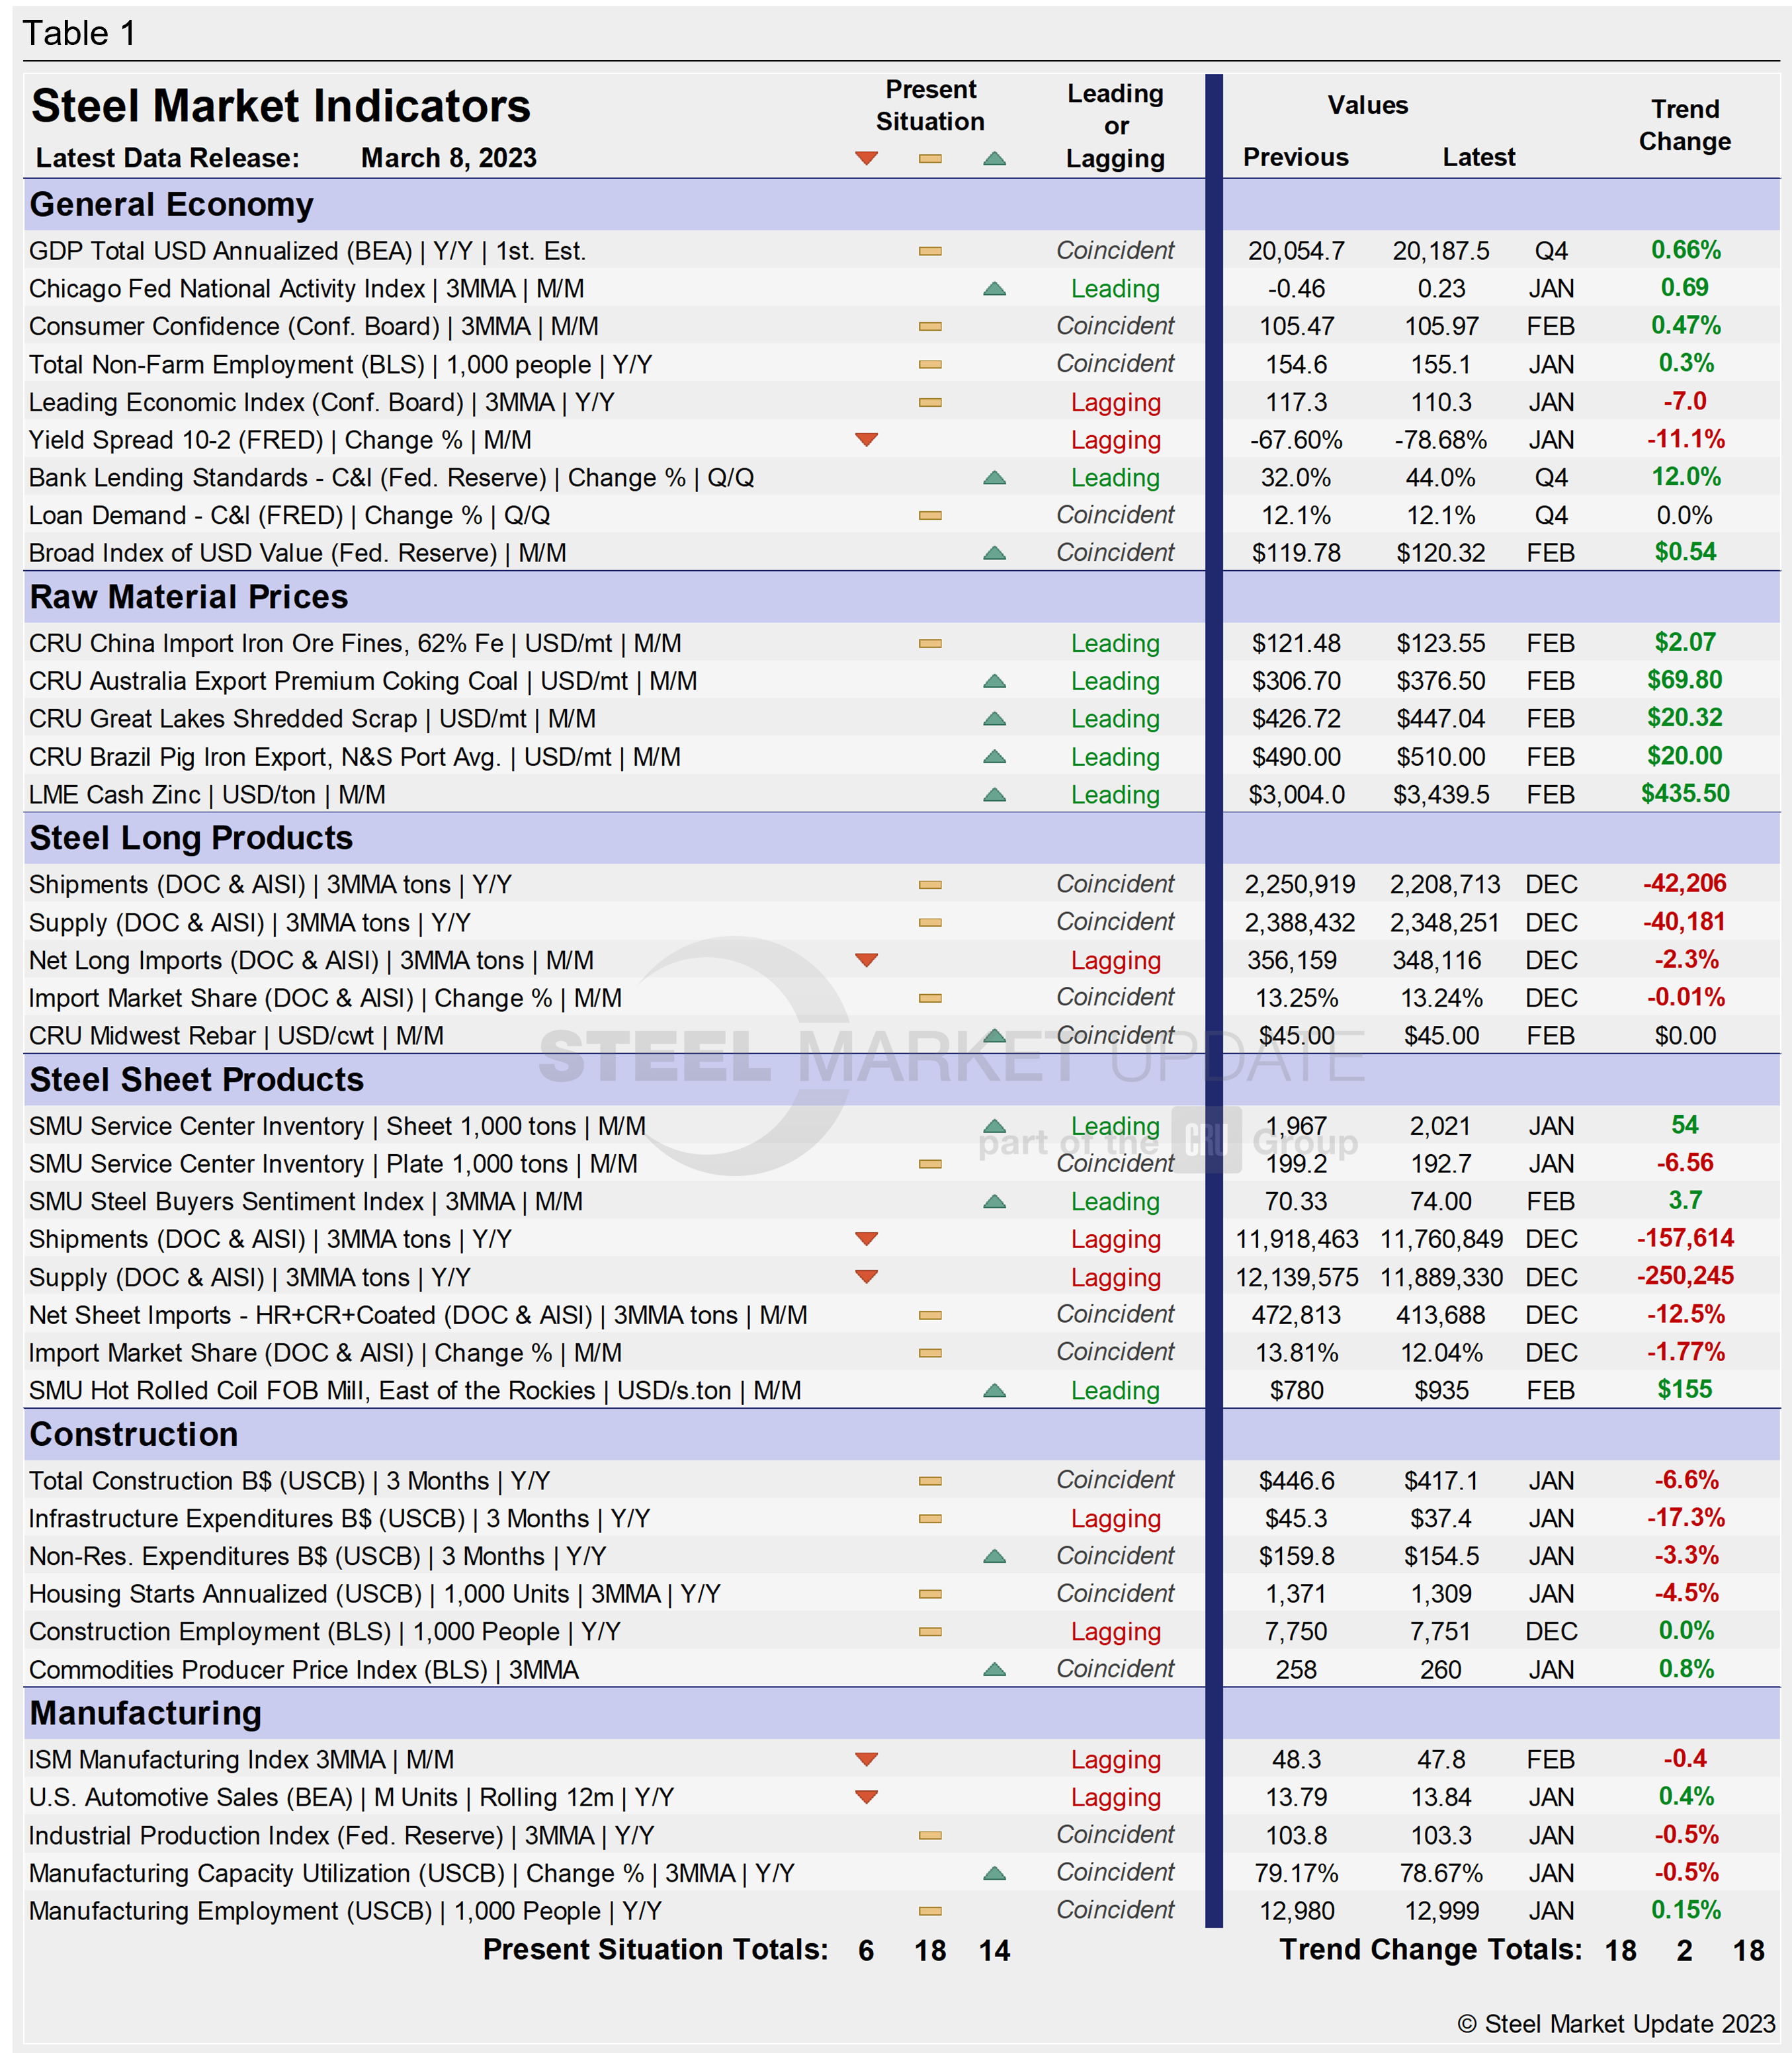
SMU’s KMI include data on the economy, raw materials, manufacturing, construction, and steel sheet and long products. They offer a snapshot of current sentiment and the near-term expected trajectory of the economy. Markers for the Present Situation had been slowly rising after positive indicators fell in July to their lowest totals since mid-2016. They eased again as 2022 ended.
Positive momentum has recovered since the new year, and in the latest data, 14 of the 38 Present Situation indicators are positive, sideways compared with the previous month (MoM) but up four points from December’s reading. The neutral position edged up while negative indicators declined over the same period. The neutral indicator rose by two points to 18, while the negative indicator fell by the same amount to a reading of 6, the lowest in nearly 12 months.
SMU’s Present Situation and Trends analyses in the table below are based on the latest available data as of March 8. Readers should regard the color codes in the “Present Situation” column as a visual summary of the current market condition. The “Trend” columns are color-coded to give a quick visual snapshot of the market’s direction. All data included in this table was released within the past month. The month or specific date to which the data refers to is shown in the second column from the far right. Click to expand the table below.
Present Situation
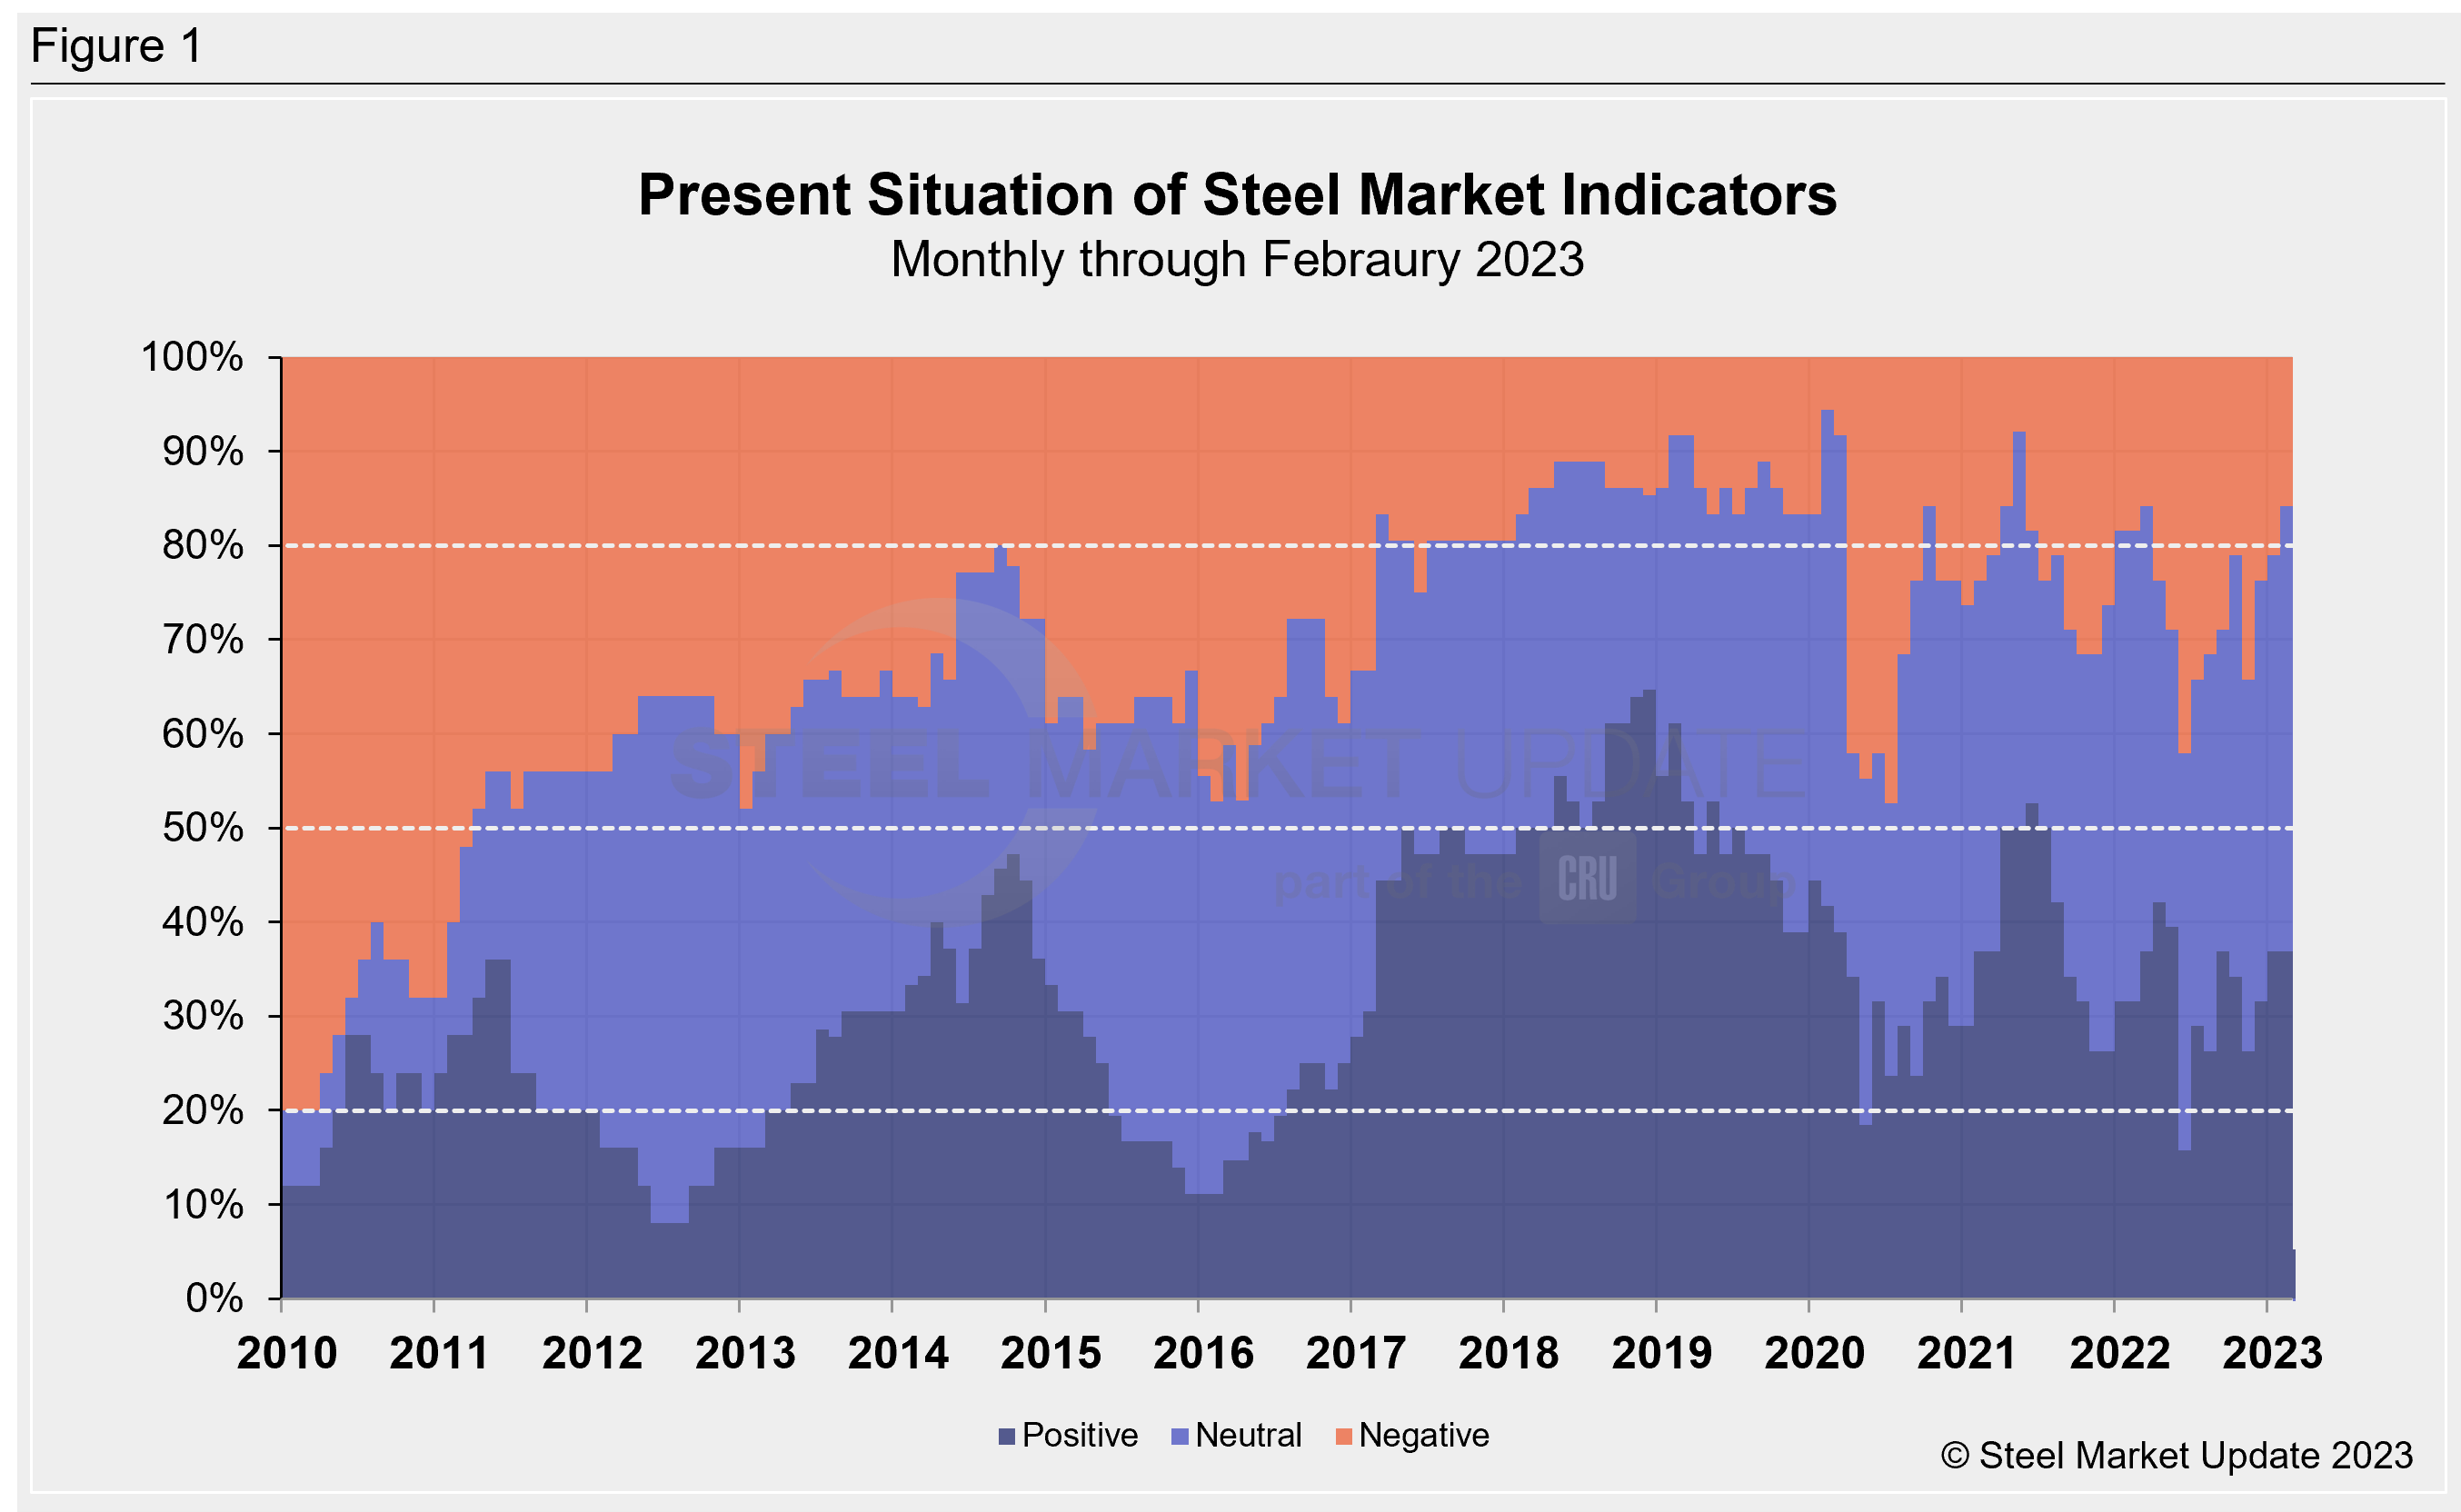
SMU’s Present Situation indicators below continue to highlight the uncertainty of the domestic market. Though positive markers have increased, so have neutral indicators. The trend points to a broadly watchful marketplace.
Through February, 47.4% of the marketplace is neutral, a 5.3-percentage point increase MoM. Presently, just 15.8% of the market is negative, near a six-percentage-point decrease vs. January’s reading, and a vast improvement from November’s measure of 34.2%, its second-worst total since the height of the pandemic in July 2020. And 36.8% of the market is positive, no change when compared to the month prior.
With just a few more neutral and a sideways move in positive indicators, Present Situation indicators are now 84.2% as neutral-to-positive, according to SMU’s assessment of key market indicators, a noticeable increase from 78.9% one month ago.
Our monthly assessment of the Present Situation since January 2010 on a percentage basis is shown in Figure 1.
Trends
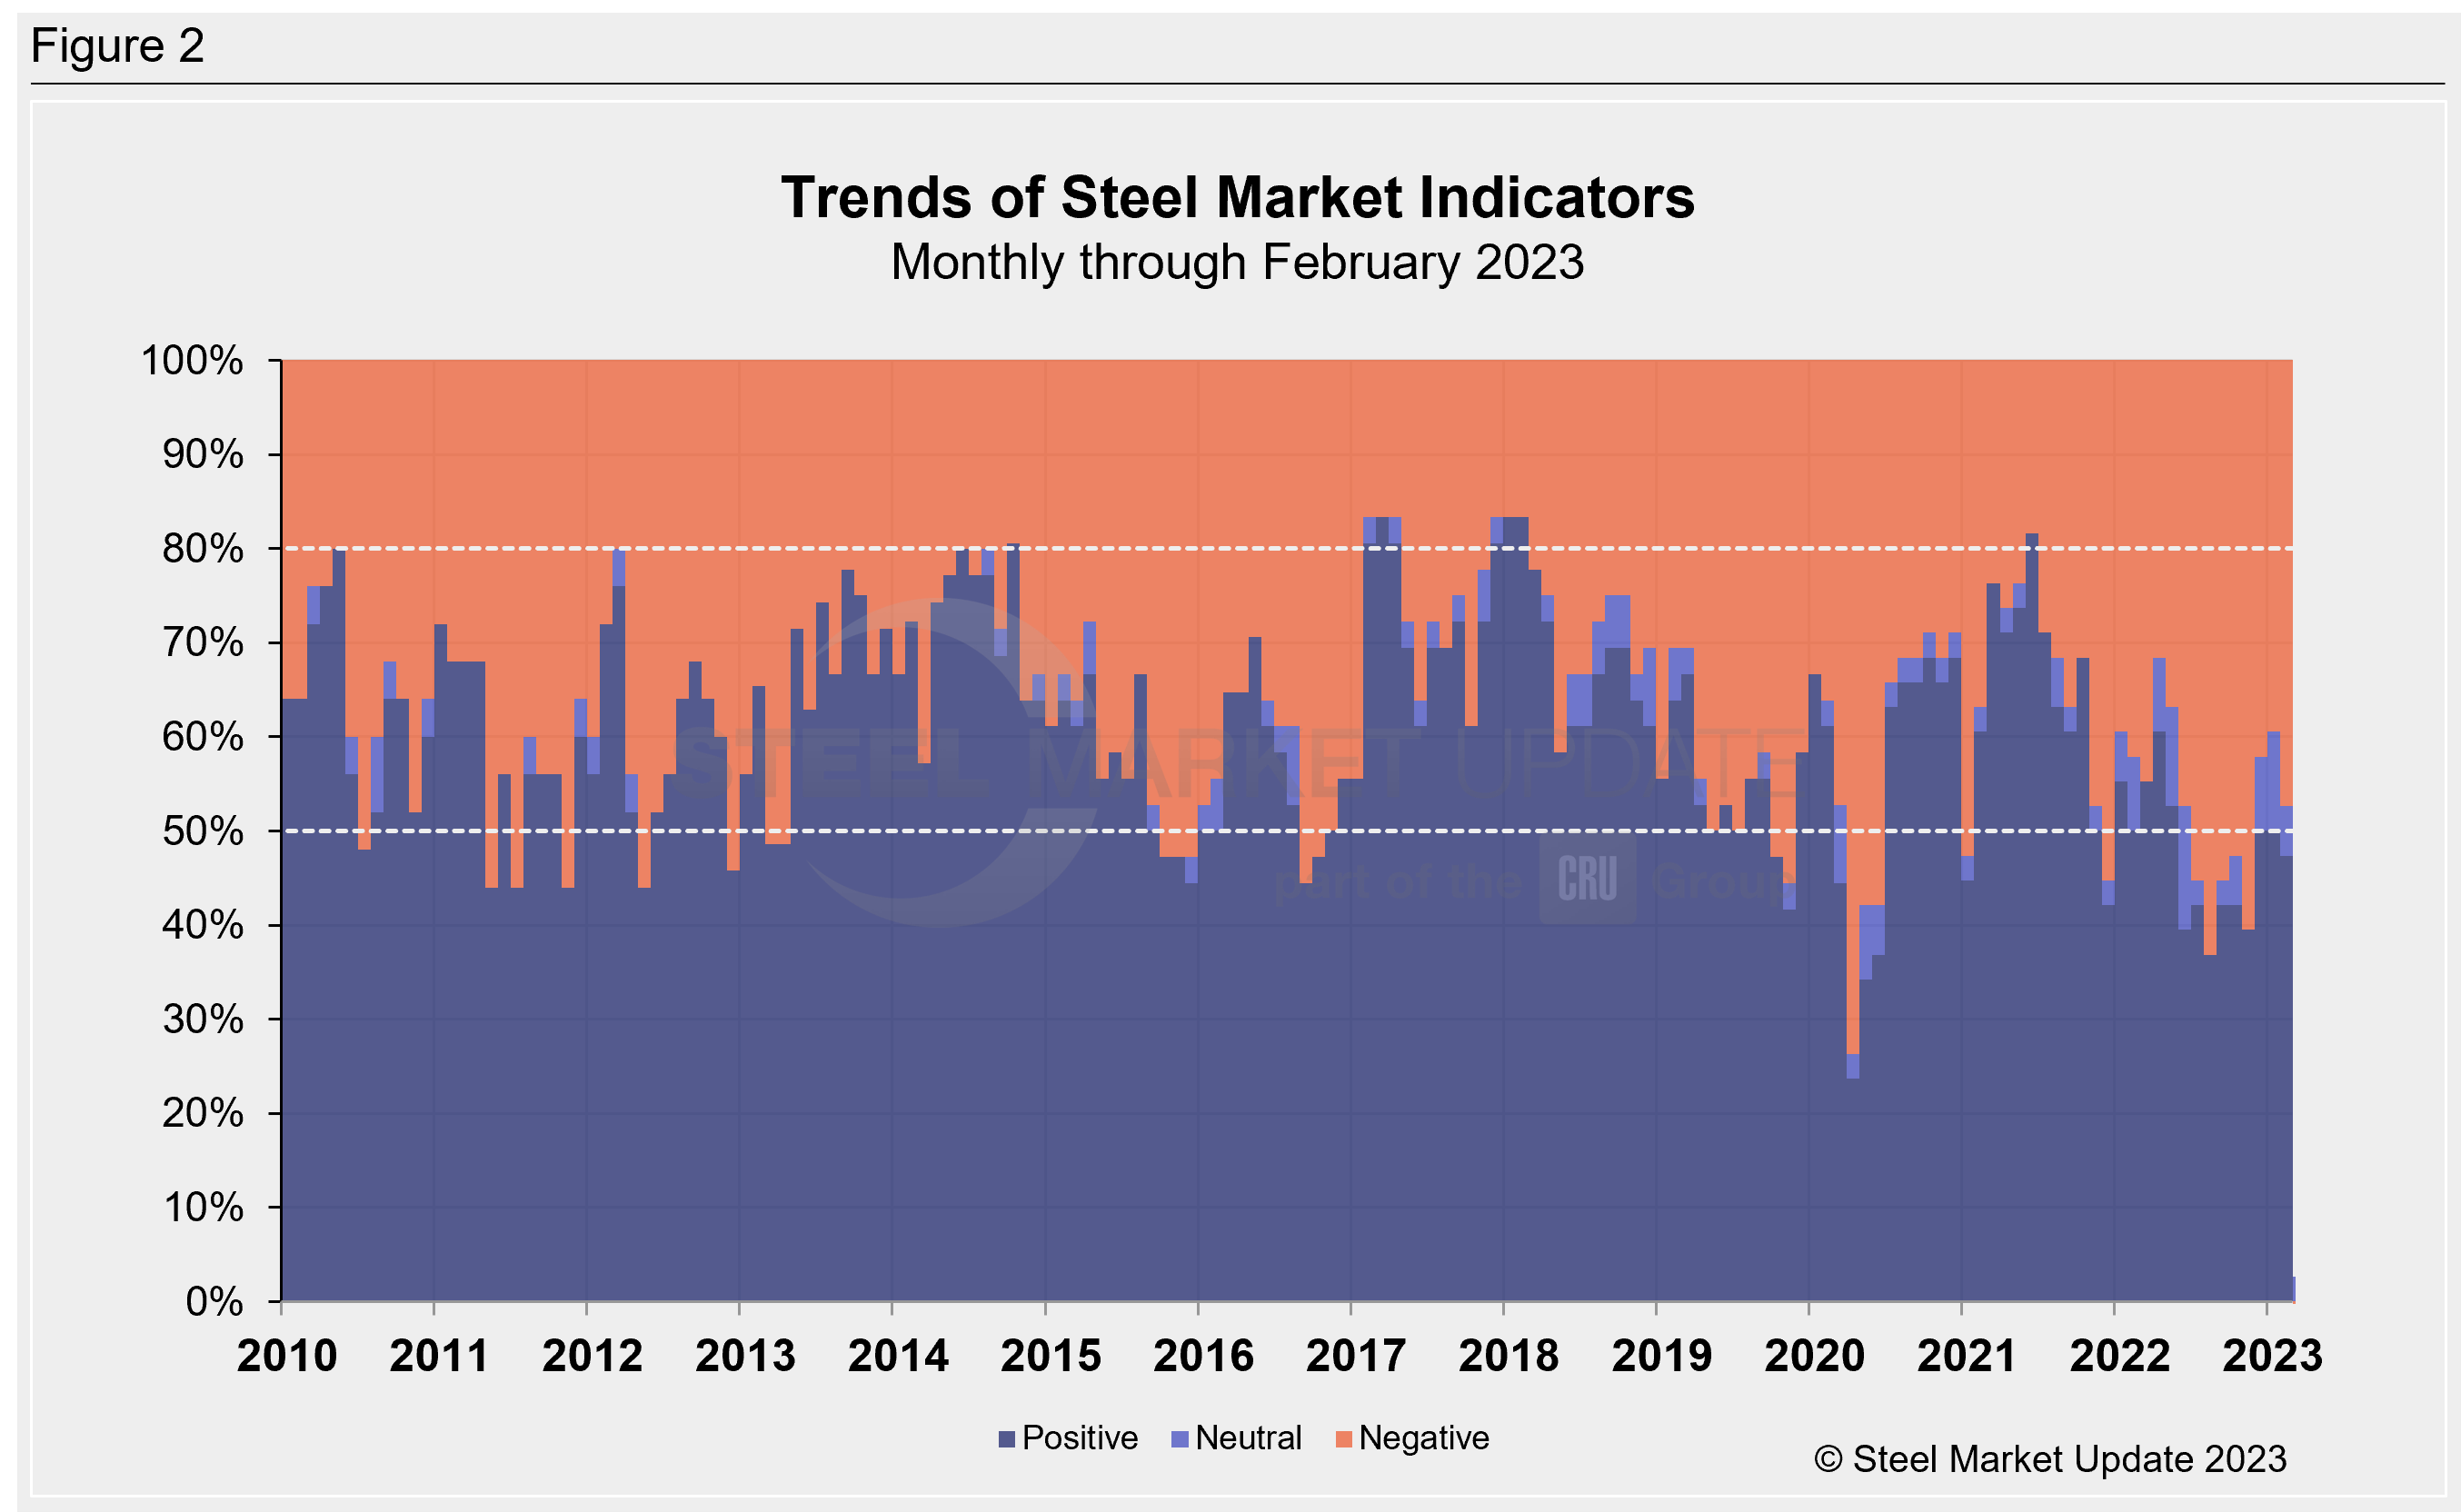
SMU’s Trends indicators point towards the uncertainty ahead, as the positive and negative markers were largely split, as neutral indicators waned. The dynamic points to a lack of long-term clarity resulting from the current headwinds facing the US economy.
It is important to remember that most values in the Trends columns are three-month moving averages (3MMA) to smooth variations in monthly data. Note that in many cases this is not February or March data, but data that was released in February and/or March for previous months. Compared to month-ago data, the negative trend rose from 39.5% to 47.4% through February. The neutral trend fell by 5.2 percentage points to a reading of 5.3%. The positive trend also dipped, down 2.6 percentage points to a measure of 47.4% over the same span.
The continued negative turn places our latest reading well behind the high of 81.6% seen in June 2021. Figure 2 shows the recent movement of the trends and historical data for comparison.
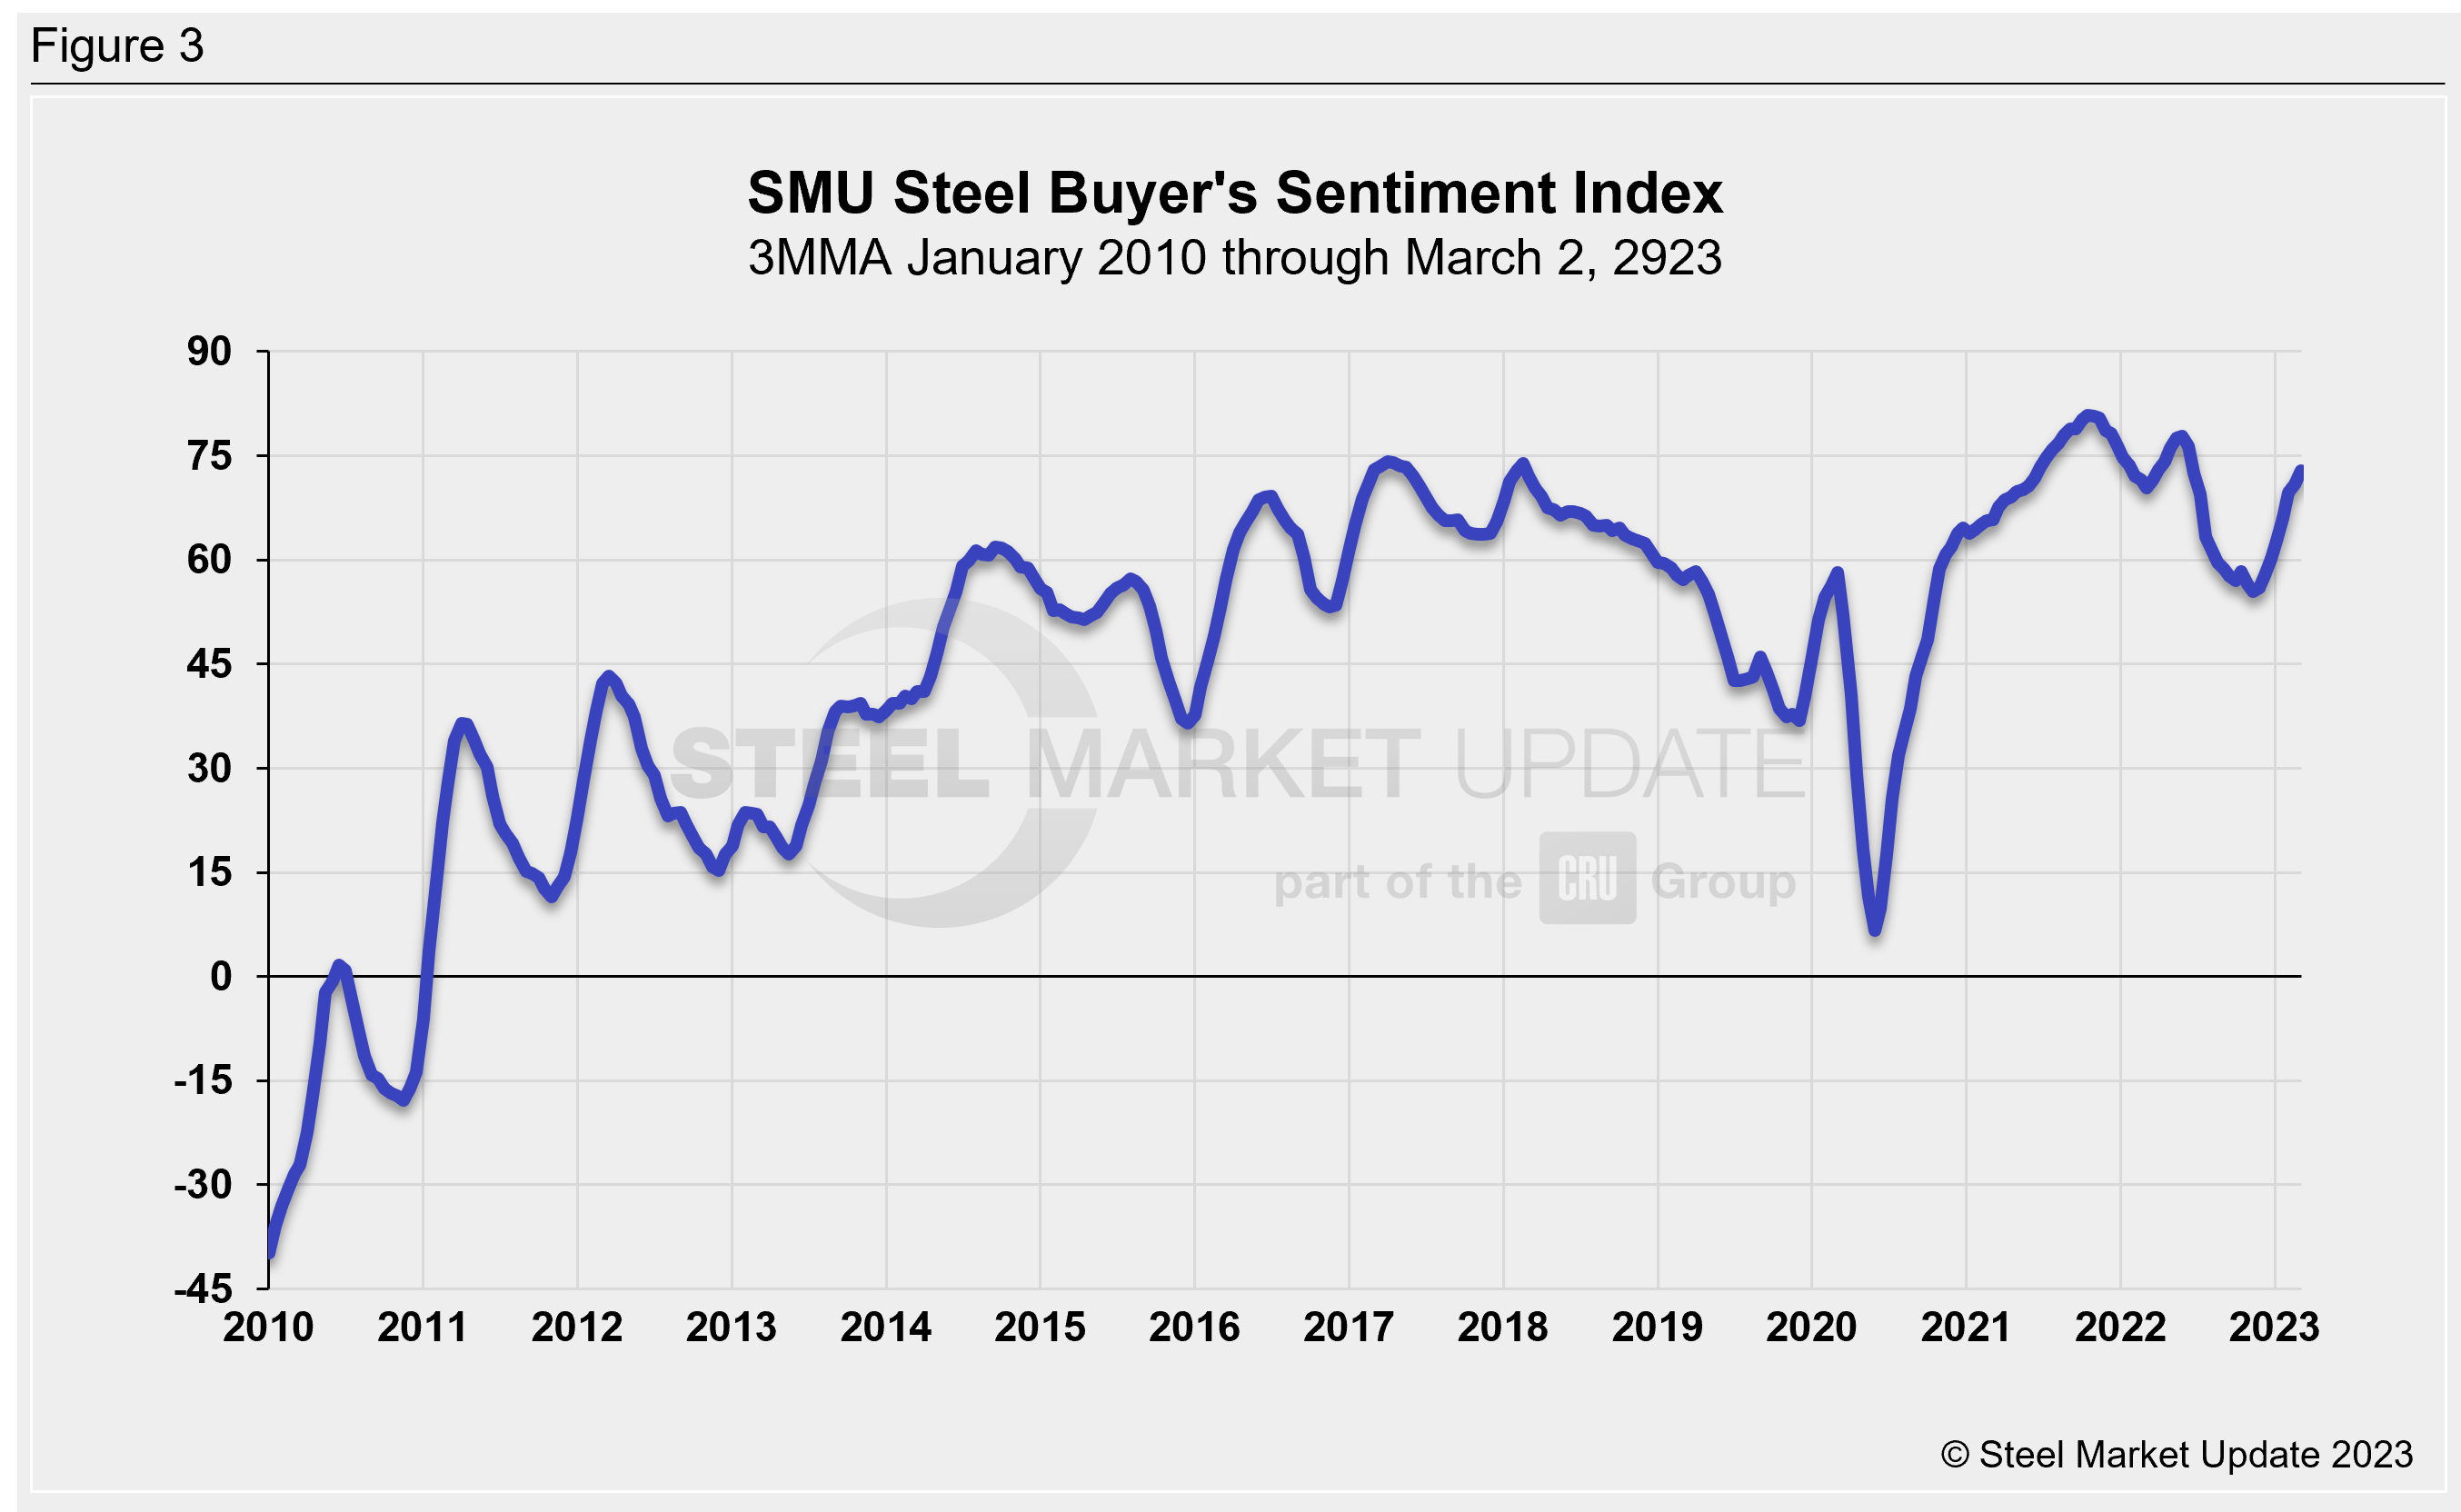
The SMU Steel Buyers Sentiment Index is a measure of the current attitude of North American steel buyers regarding their company’s chances for success in today’s market.
Recall that the single value of the current sentiment index fell to -8 in early March 2020, a 66-point drop in just a month as the pandemic devastated the economy. It rebounded to a healthy +82 by late March but had been largely trending down through November and into December. It has since recovered repeatedly, standing at +76 as of March 2.
Figure 3 shows the 3MMA of the index since 2010. A reading above the neutral point of zero indicates that buyers have a positive attitude toward their prospects. Steady-to-declining demand and falling steel prices appear to be pressuring the Steel Buyer’s Sentiment Index to remain low.
By David Schollaert, david@steelmarketupdate.com


