

Market Data

July 21, 2023
Current, Future Steel Buyers Sentiment Indices Run Even
SMU’s Current and Future Steel Buyers Sentiment Indices are at parity, with current level and future ticking up, according to our most recent survey data.
Every other week we poll steel buyers about sentiment. The Steel Buyers Sentiment Indices measure how steel buyers feel about their company’s chances of success in the current market, as well as three to six months down the road. We have historical data going back to 2008.
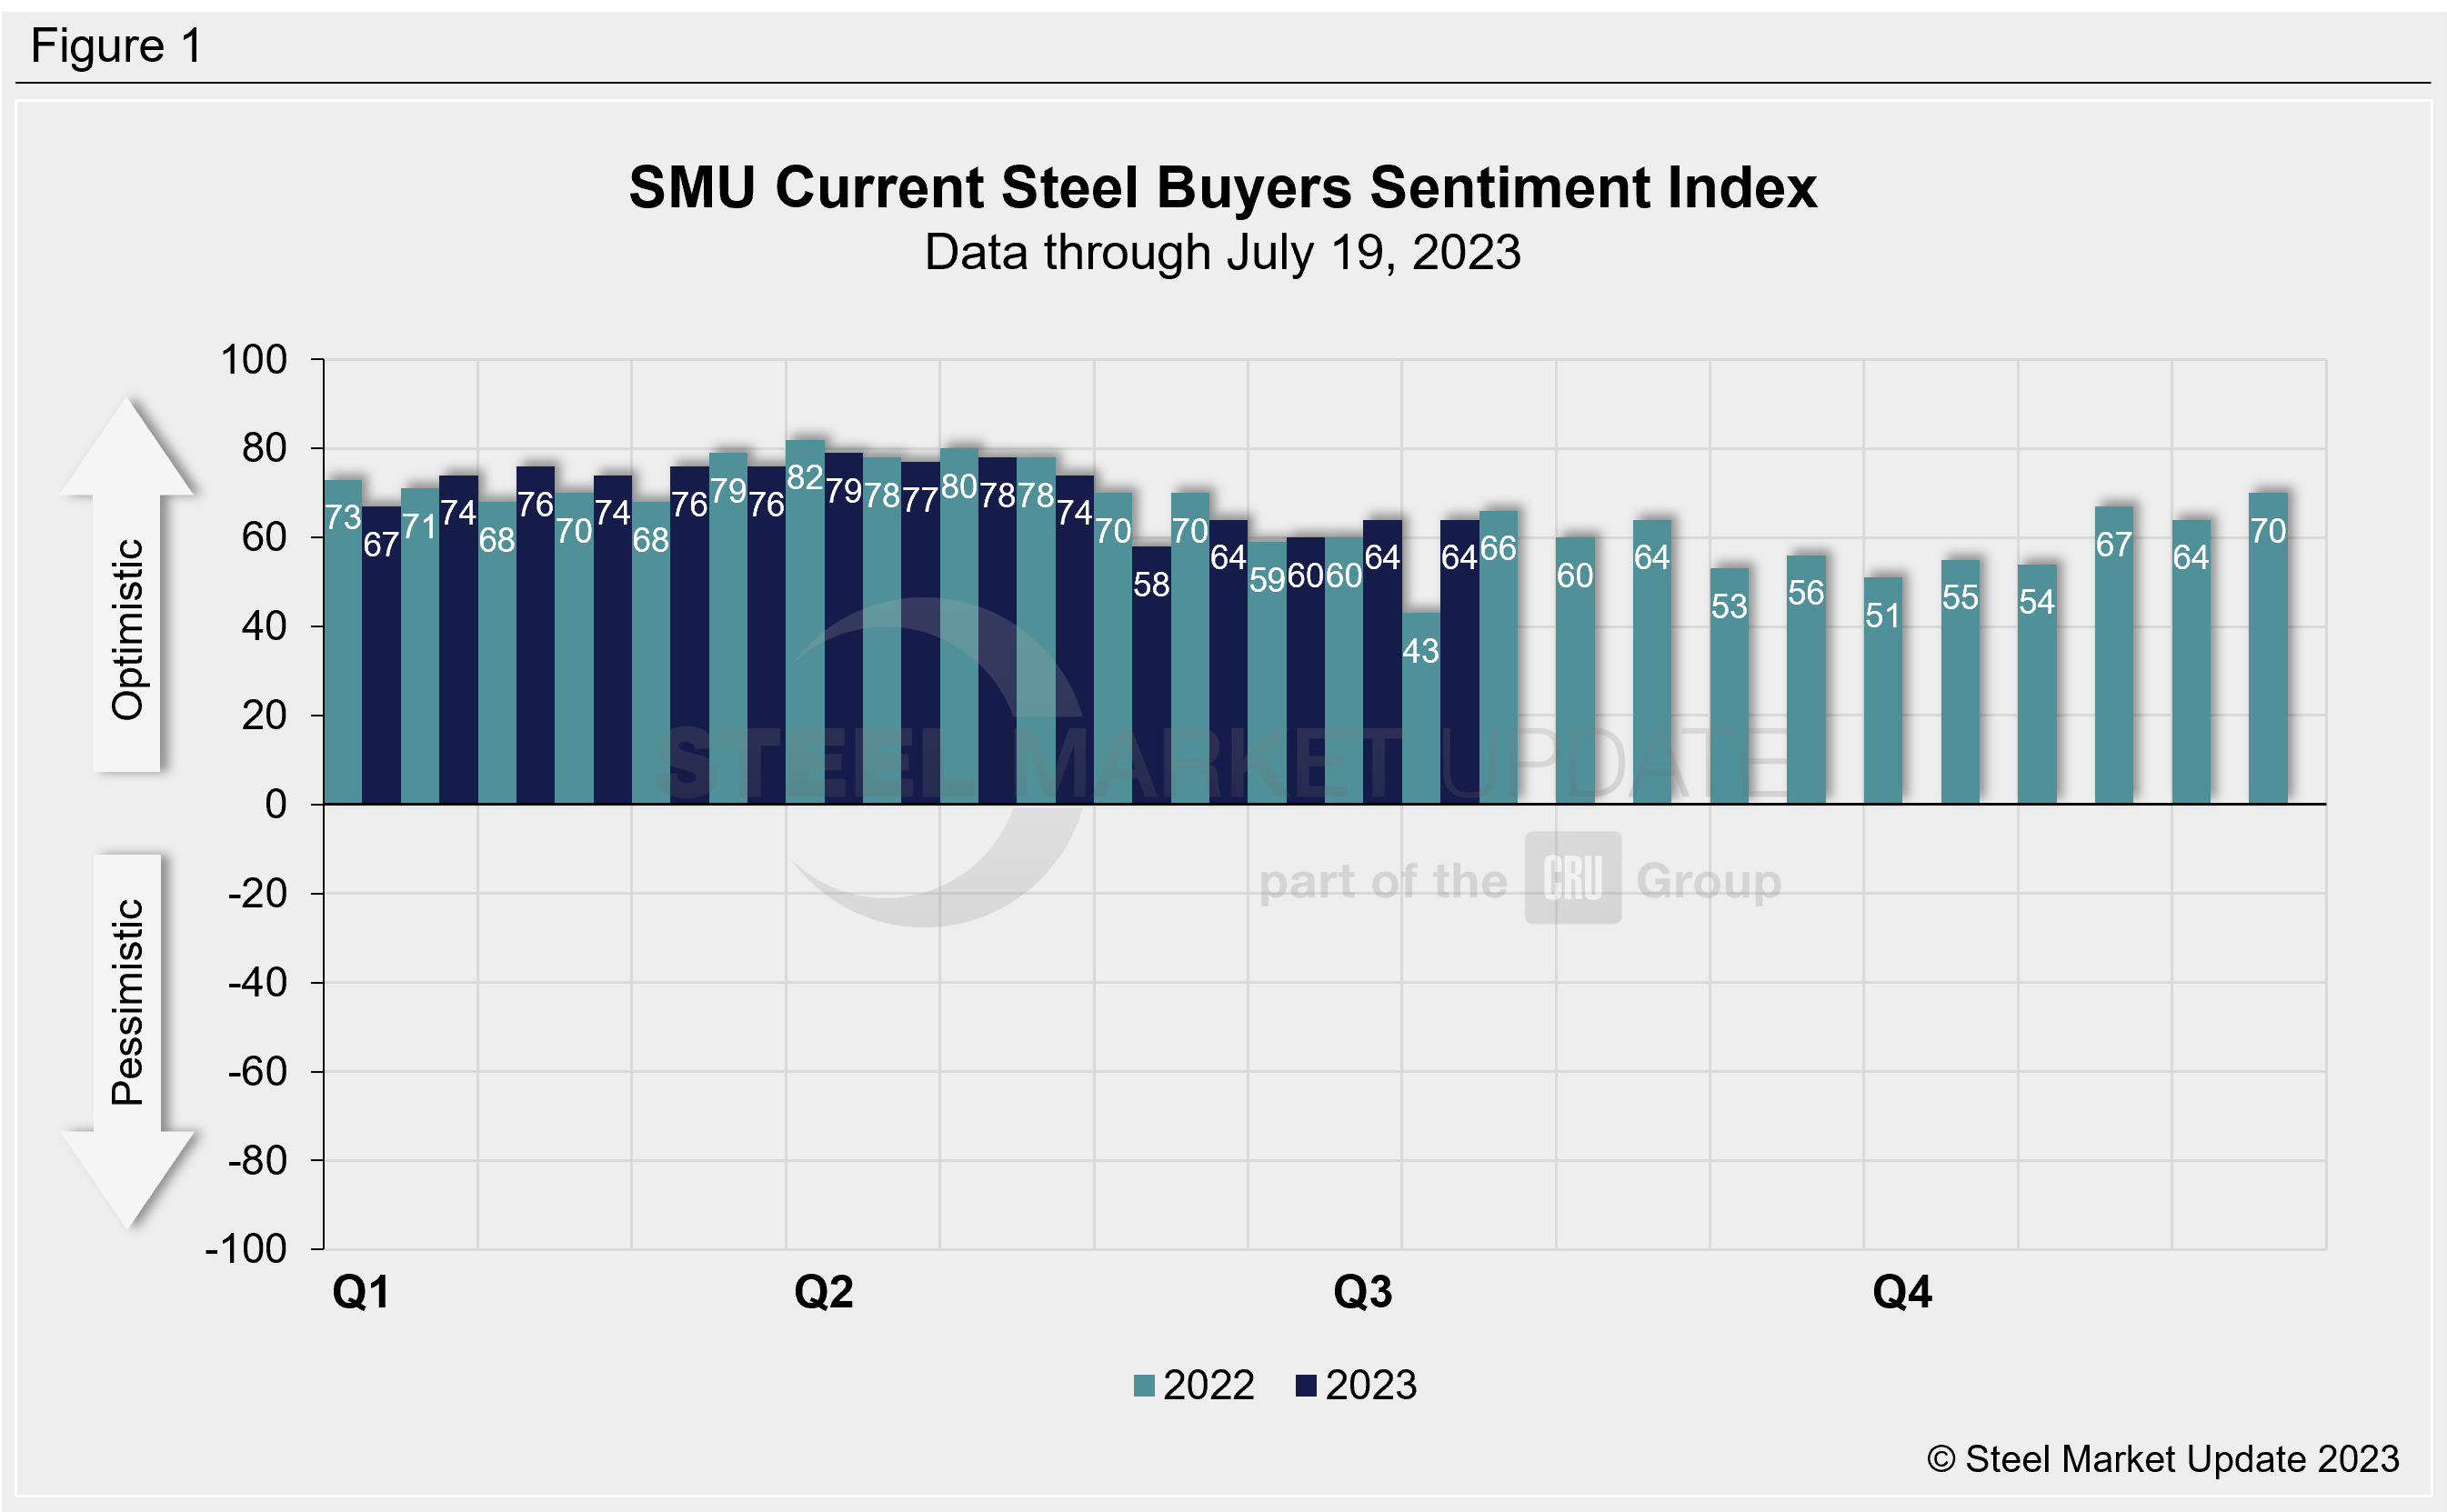
SMU’s Current Buyers Sentiment Index was flat at +64 this week. (Figure 1). Current sentiment hasn’t cracked +70 since the beginning of May after hovering in the mid-70s since the middle of January.
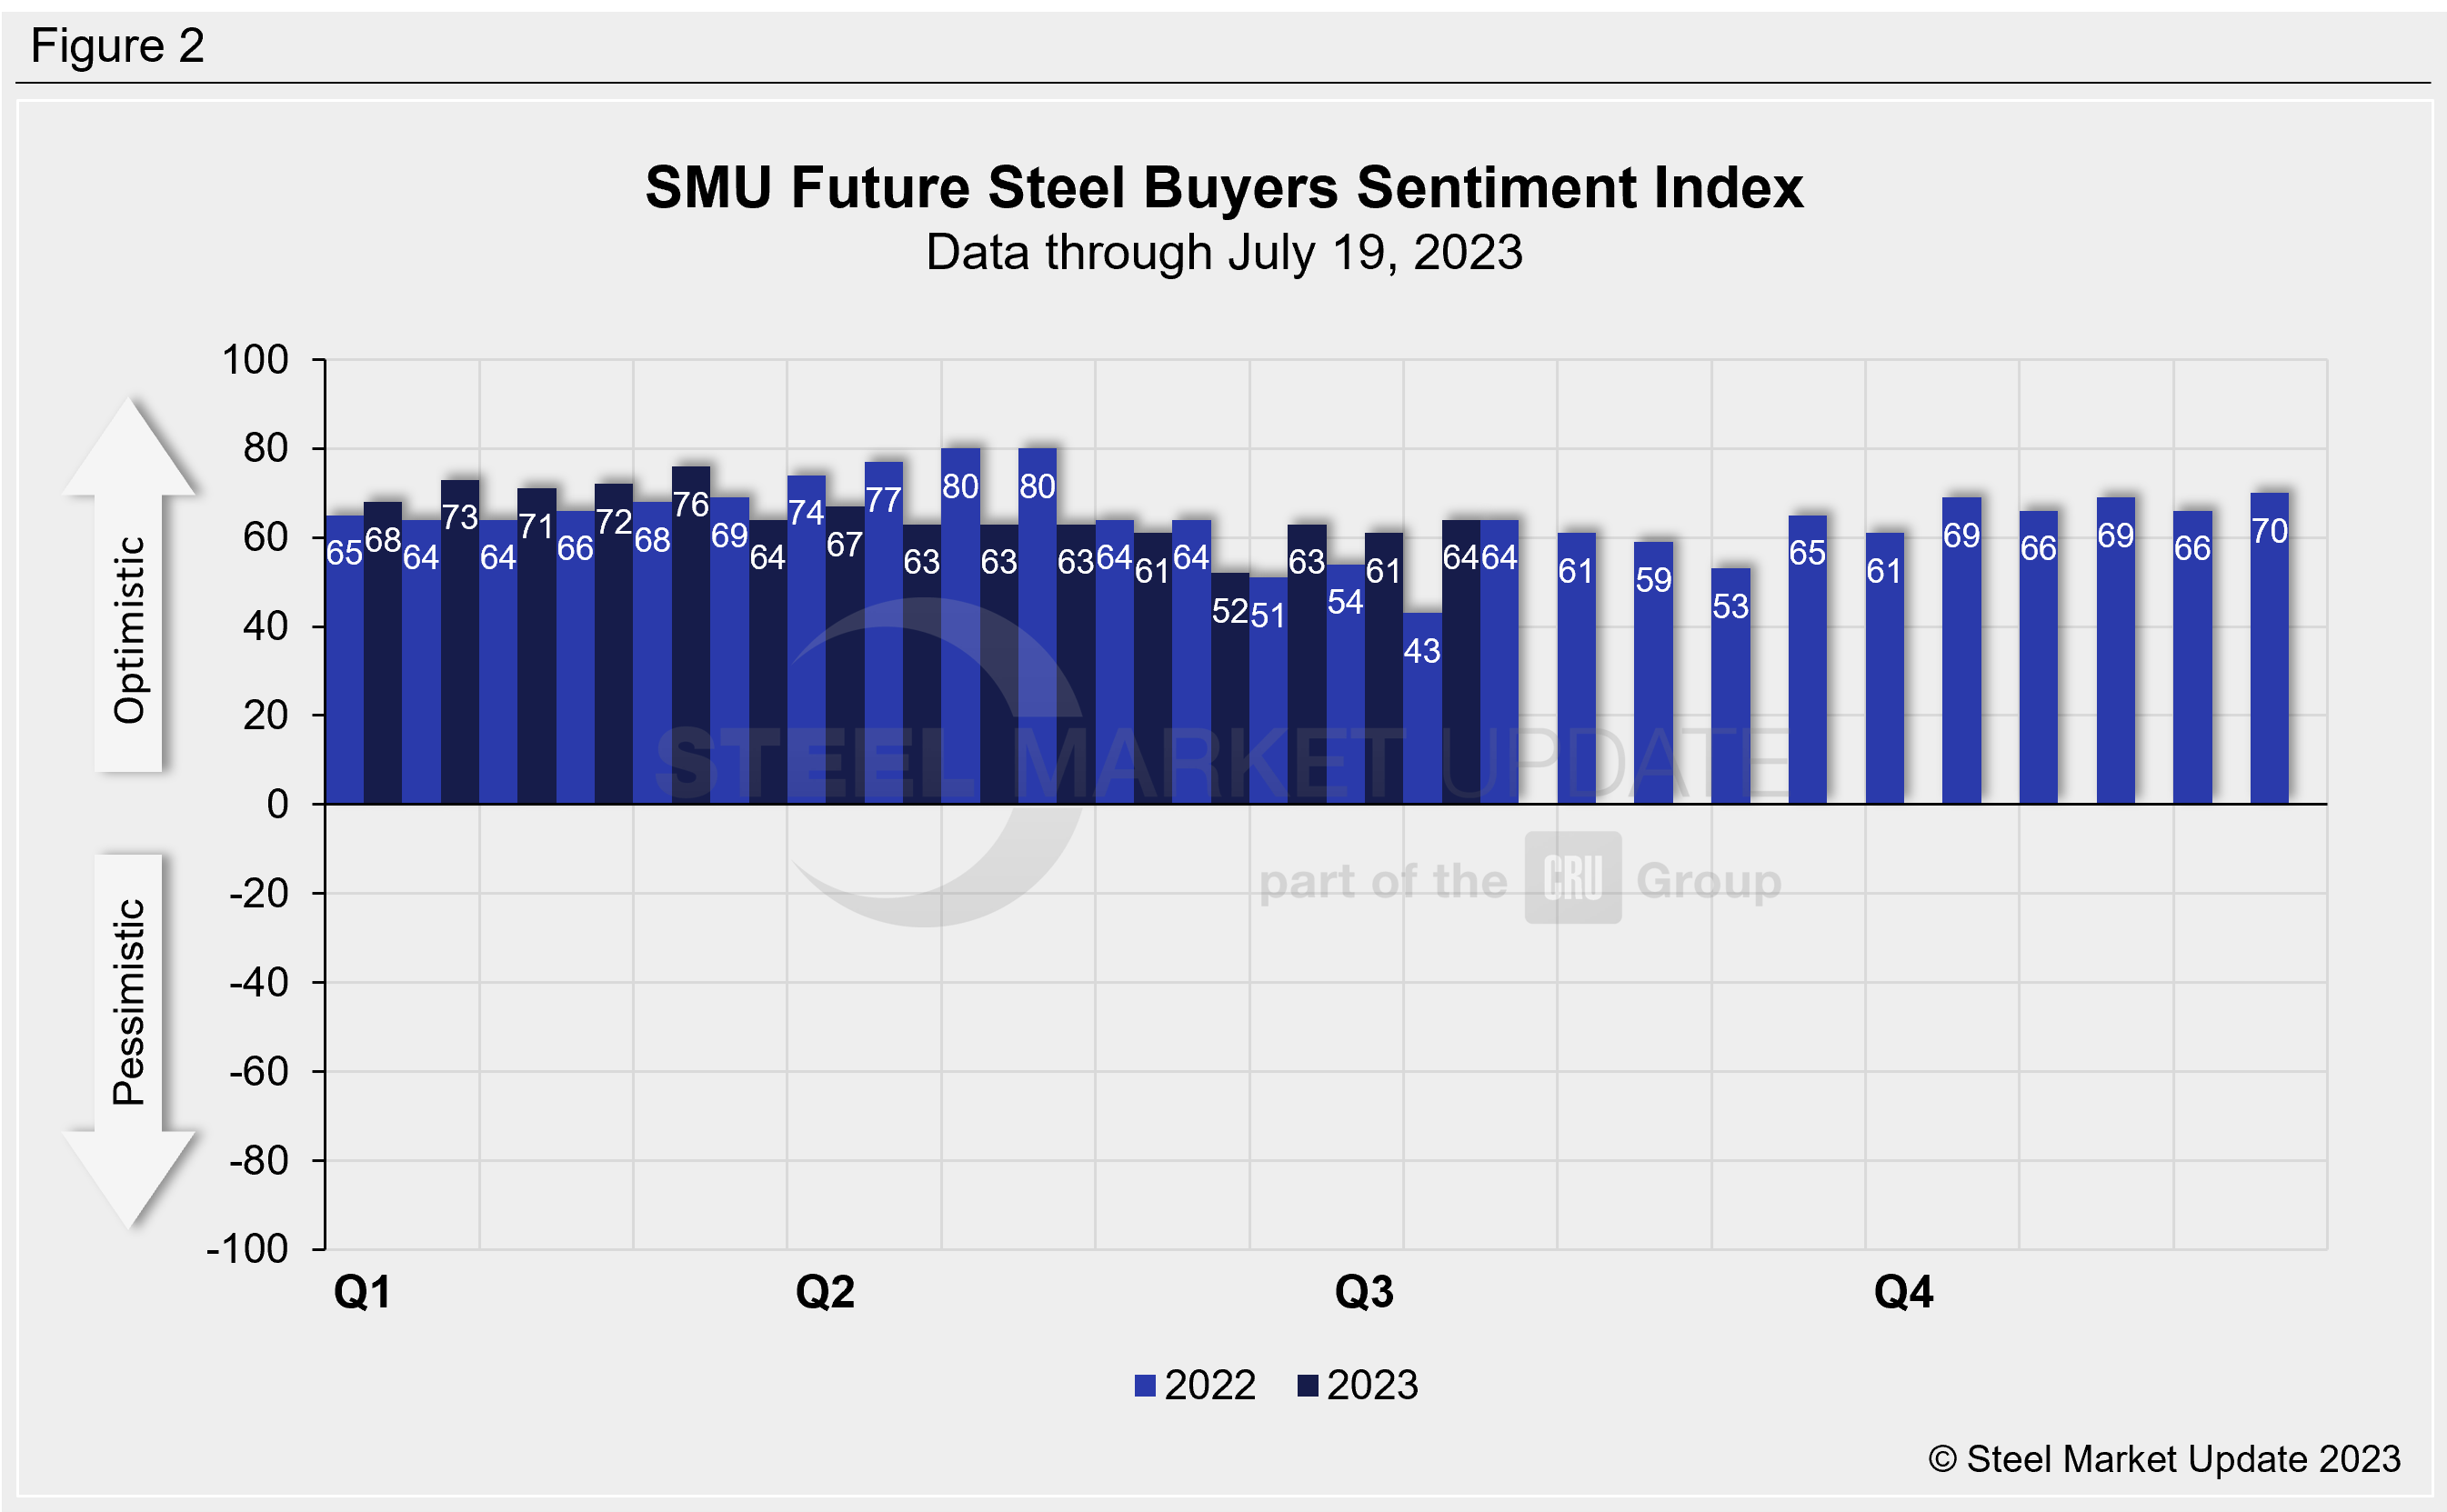
SMU’s Future Buyers Sentiment Index measures buyers’ feelings about business conditions three to six months in the future. This week, the index rose three points to +64 vs. the previous market check (Figure 2). The future and current indices were last running even at the beginning of March when they both stood at +76.
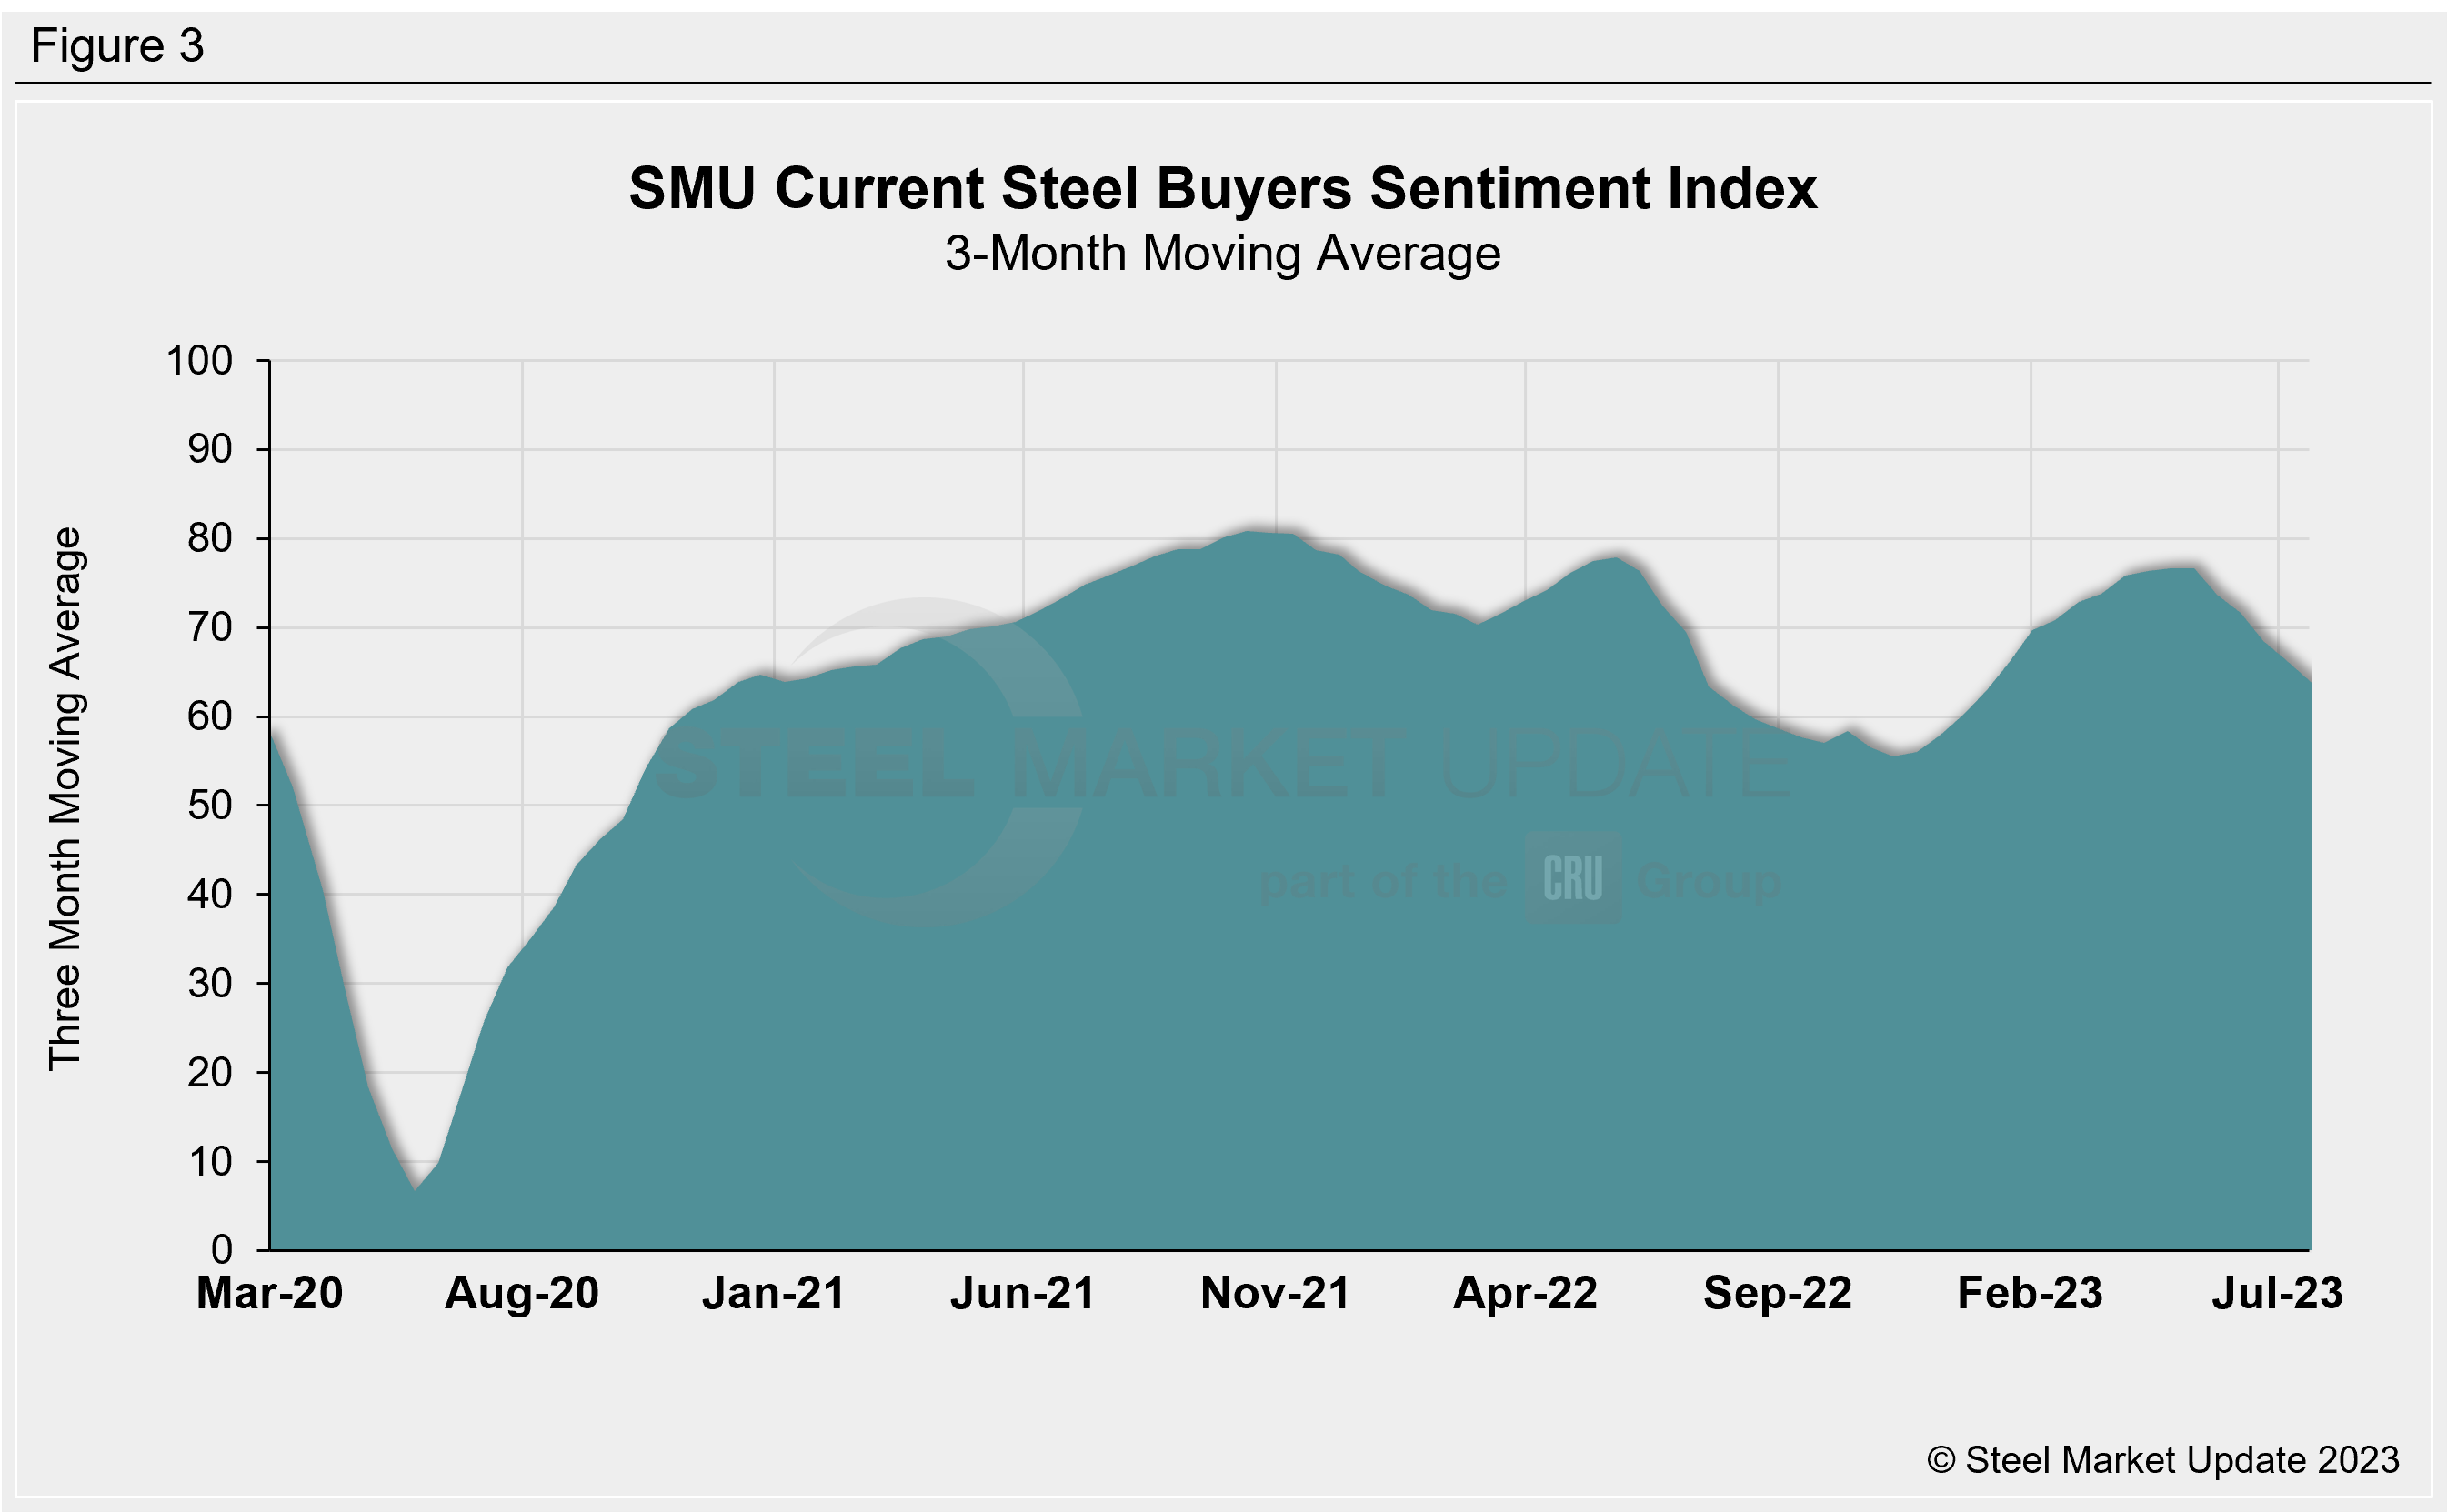
Measured as a three-month moving average, the Current Sentiment 3MMA fell to +64, compared with +66.33 two weeks earlier. (Figure 3).
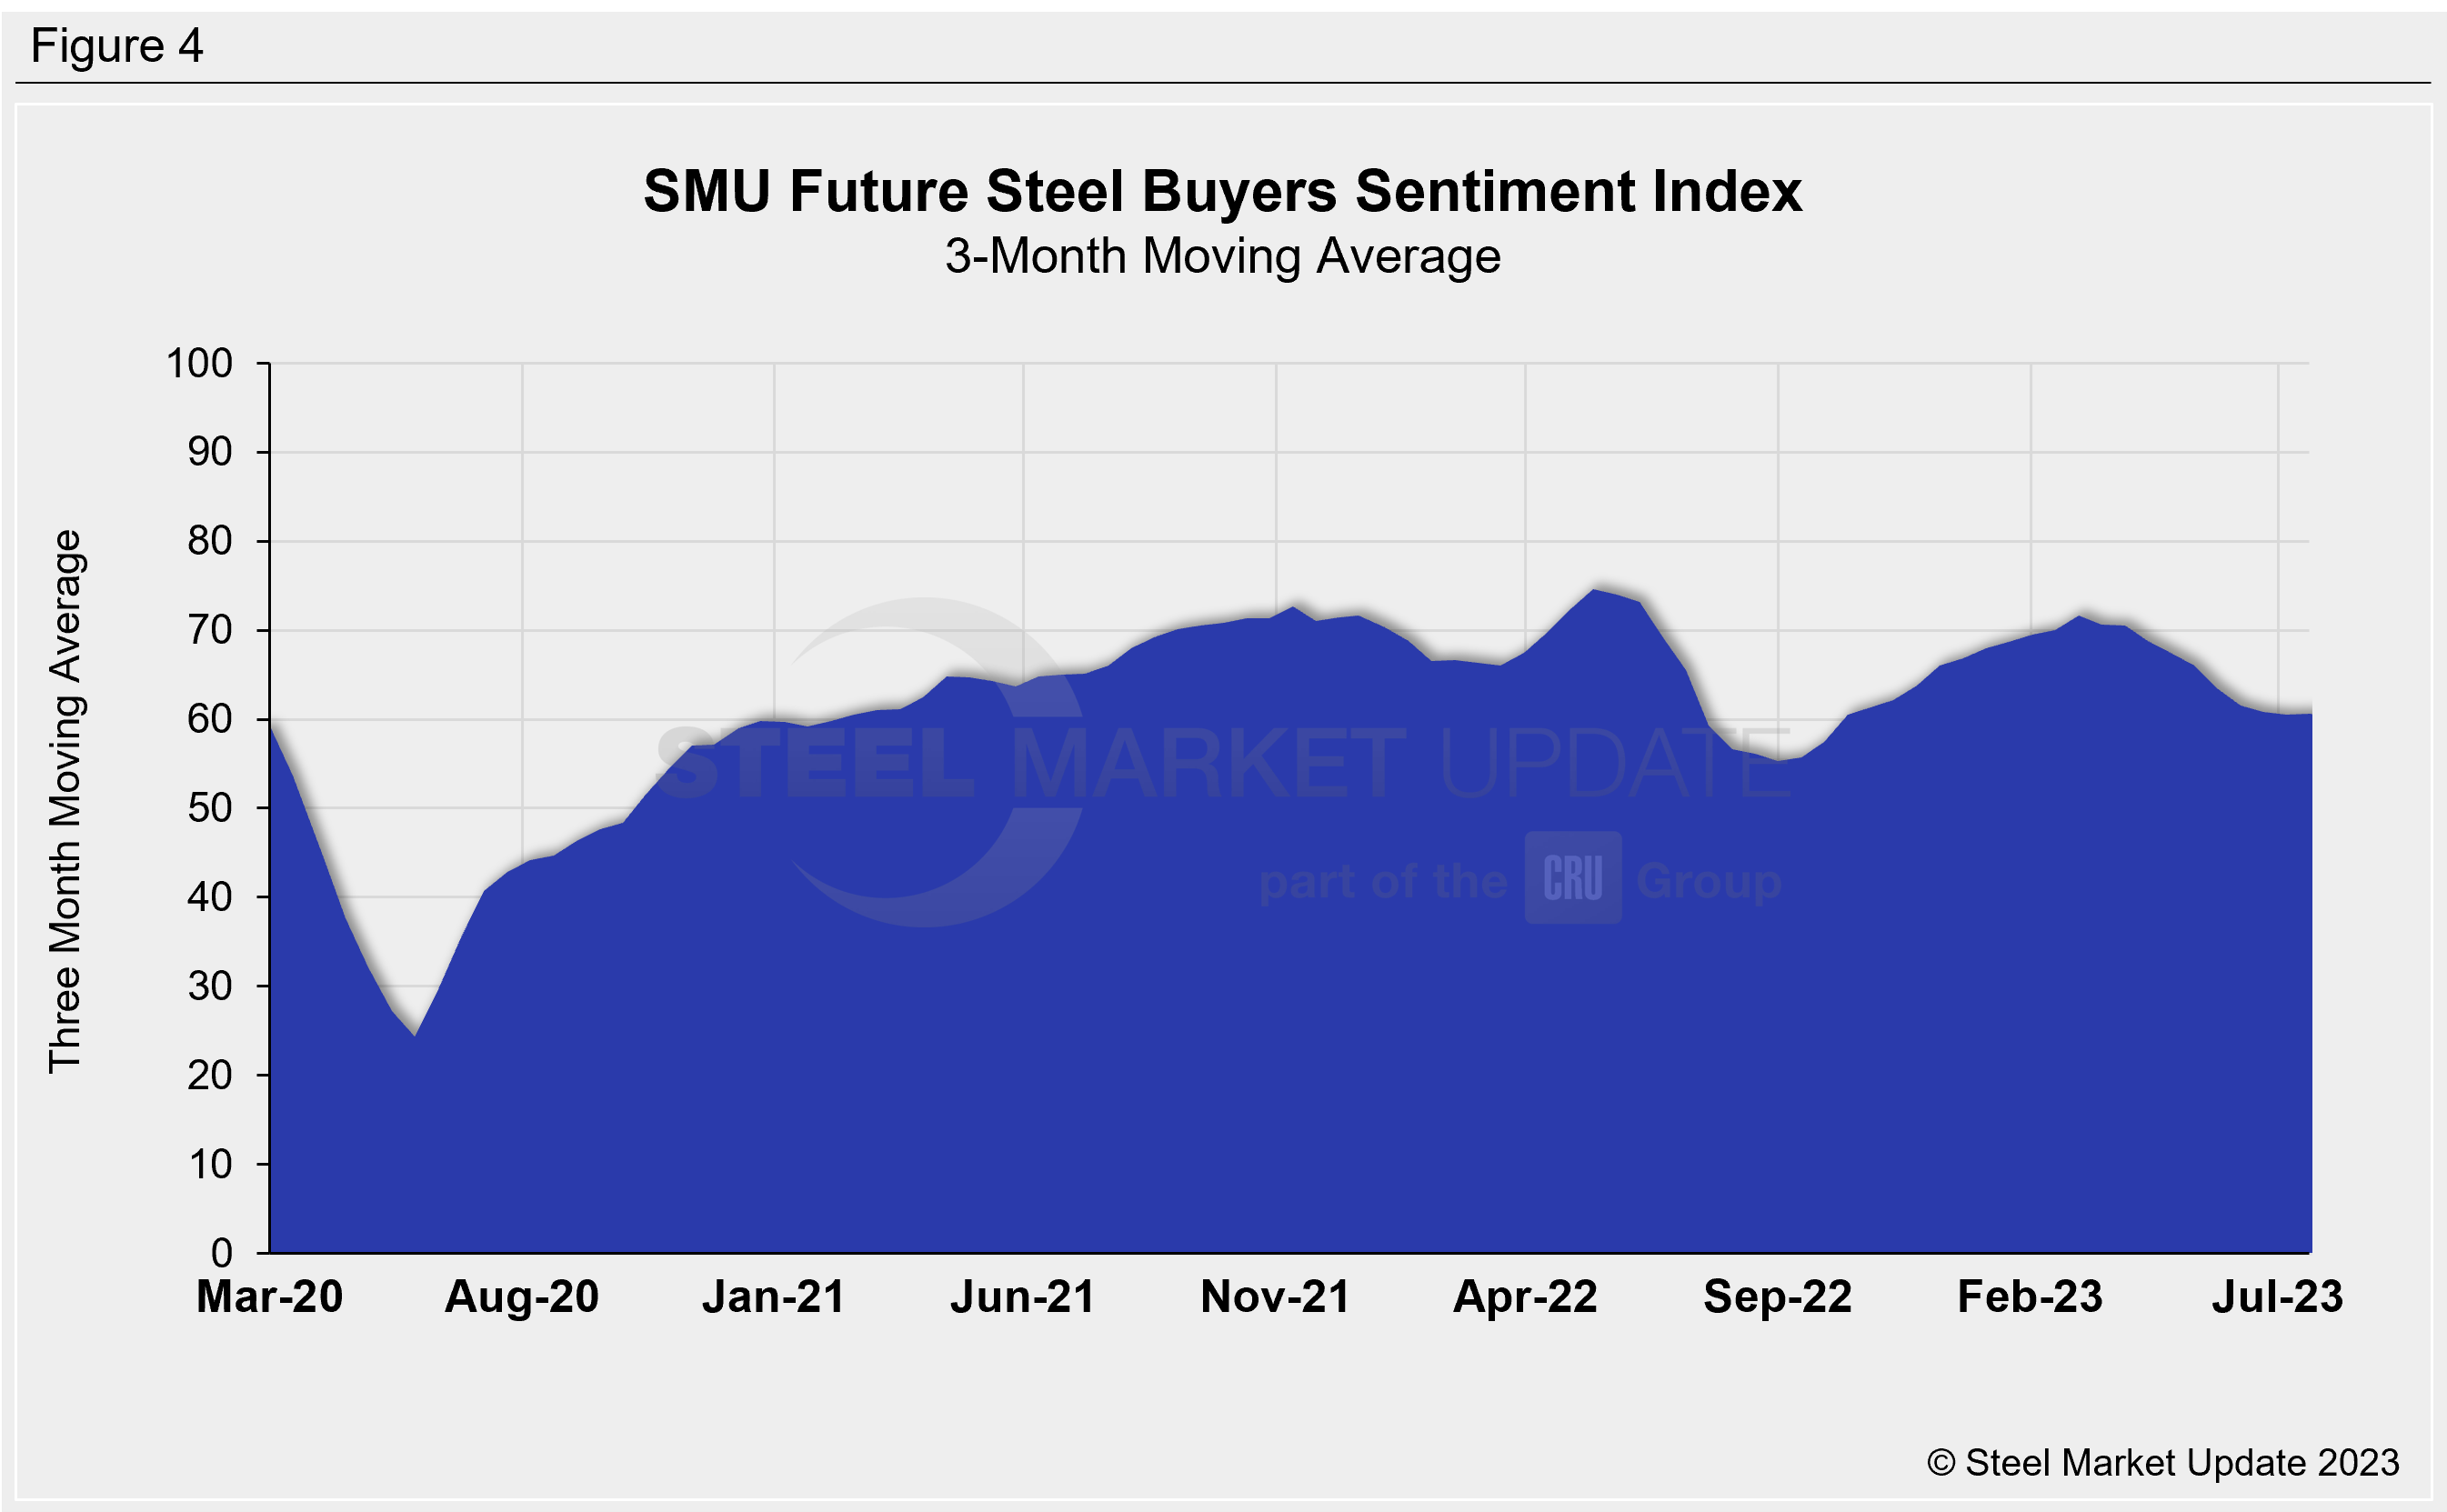
This week’s Future Sentiment 3MMA was +60.67, up slightly from +60.50 at the previous market check (Figure 4).
What SMU Survey Respondents Had to Say:
“The arket is soft.”
“We’re continuing to buy ‘hand to mouth.’ Just no need to spend the cash right now.”
“Our future buys are below forecast.”
“Coming off of the July 4th holiday, business is better.”
“Summer slowdown.”
“Summer break, then an increase in demand.”
About the SMU Steel Buyers Sentiment Index
The SMU Steel Buyers Sentiment Index measures the attitude of buyers and sellers of flat-rolled steel products in North America. It is a proprietary product developed by Steel Market Update for the North American steel industry. Tracking steel buyers’ sentiment is helpful in predicting their future behavior.
Positive readings run from +10 to +100. A positive reading means the meter on the right-hand side of our home page will fall in the green area indicating optimistic sentiment. Negative readings run from -10 to -100. They result in the meter on our homepage trending into the red, indicating pessimistic sentiment. A reading of “0” (+/- 10) indicates a neutral sentiment (or slightly optimistic or pessimistic), which is most likely an indicator of a shift occurring in the marketplace. Sentiment is measured via SMU surveys twice per month.
Click here to view an interactive graphic of the SMU Current Steel Buyers Sentiment Index and of the SMU Future Steel Buyers Sentiment Index.
By Ethan Bernard, ethan@steelmarketupdate.com


