

Analysis
September 6, 2023
Consumer Confidence Dipped in August
Written by David Schollaert
US consumer confidence pulled back in August, declining for the first time in four months. The result came in after the index jumped to its highest level in nearly two years the month prior. This shows consumers’ assessment of current business and labor market conditions has deteriorated, The Conference Board reported.
The headline Consumer Confidence Index declined 7.9 points to 106.1 in August from 114 one month ago. Both the Present Situation index and the Expectations Index also dropped from July, coinciding with signs of cooling in what has been a resilient US jobs market, the report noted.
“Consumer confidence fell in August 2023, erasing back-to-back increases in June and July,” said Dana Peterson, The Conference Board’s chief economist. “August’s disappointing headline number reflected dips in both the current conditions and expectations indexes.”
Responses from consumers showed they were “once again preoccupied with rising prices in general and for groceries and gasoline in particular,” Peterson added.
“The pullback in consumer confidence was evident across all age groups—and most notable among consumers with household incomes of $100,000 or more, as well as those earning less than $50,000,” she said.
Confidence for consumers with incomes between $50,000 and $99,999, however, held relatively steady, according to the report.
The Present Situation Index, which measures consumer sentiment toward current business and labor market conditions declined in August. The index fell 2.9 points to 144.8. The Expectations Index, which assesses the short-term outlook for income, business, and labor market conditions, edged lower to 80.2, down 0.2 points from the prior month’s reading.
Calculated as a three-month moving average (3MMA) to smooth out volatility, The Conference Board’s Composite Index was 110.1, a 1.2-point increase vs. July, and increasing for the third straight month.
The Composite Index is made up of two sub-indexes: consumers’ view of the present situation and their expectations for the future. Figure 1 below notes the 3MMA linear trend lines from January 2013 through August 2023 vs. the trend lines of all three subcomponents of the index: Present Situation, Composite, and Future Expectations. All three were above the average composite line of 94.5 prior to the pandemic before falling consecutively through February 2021. The surge from March through June of 2021 pulled all three indexes above the composite line once again. But economic uncertainty continues to weigh on expectations, keeping it well below the average.
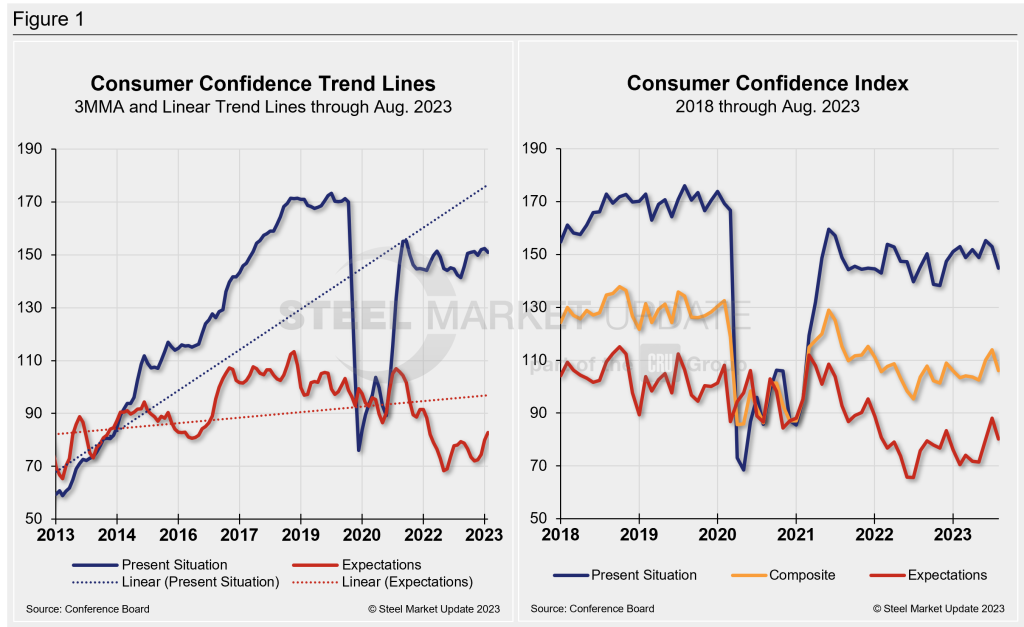
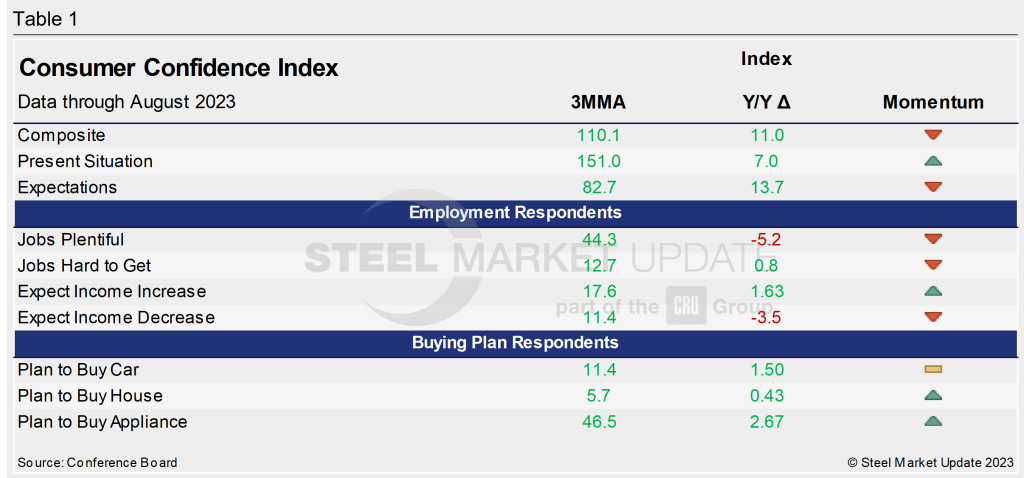
The table below compares August 2023 with August 2022 on a 3MMA basis. The headline index and both of its two sub-indexes have been on the rise on a year-on-year (YoY) basis. Expectations has seen the strongest gain, though growth for all three has been notable.
When compared to the same 2019 pre-pandemic period, the Composite Index is down nearly 23 points on a 3MMA basis. The Present Situation is down 18 points, while the Expectations reading is down nearly 26 points this month when compared to the same period in 2019. The Consumer Confidence report includes employment data and purchase plans. These are summarized in the table below.
Present situation declined in August on “receding optimism around employment conditions,” according to the report, as fewer consumers said jobs are “plentiful” and more said jobs are “hard to get.”
“Hard data confirm that employment gains have slowed, overall wage increases are less generous compared to a year ago, and the average number of weeks of unemployment is ticking upward,” remarked Peterson.
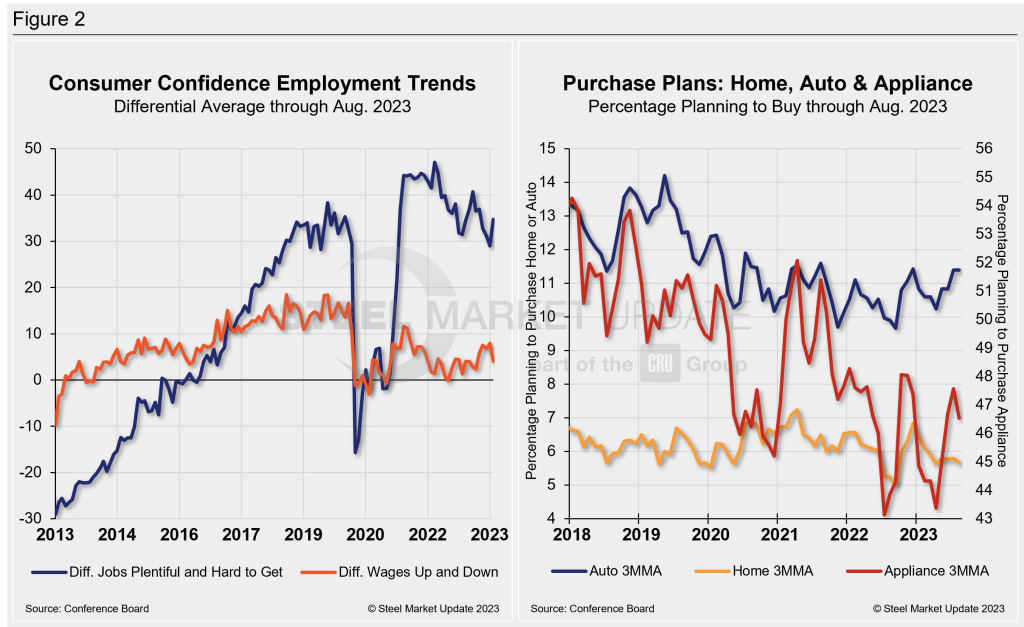
The differential between those finding jobs and those having difficulty was 34.7 in August, up from 29 in July. The measure, though up month on month (MoM), is still trending further away from the most recent high of 40.71 seen earlier this year. The difference between those expecting wages to rise vs. those expecting wages to fall is 4.1, down 3.8 points MoM, and well removed from the recent high of 11.6 in June 2021.
And while income expectations ticked down slightly in August, the outlook for consumers’ family finances declined further, according to the report. “Consumers may be hearing more bad news about corporate earnings, while job openings are narrowing, and interest rates continue to rise—making big-ticket items more expensive.”
Buying intentions for big-ticket items — cars, homes, and major appliances — were mostly unchanged in August, though mixed vs. month-ago levels.
The share of consumers planning to buy motor vehicles and appliances such as refrigerators and washing machines both declined MoM, down 0.2 and 0.1 points, respectively. Home buying plans edged up 0.6 points in August vs. July.
These recent dynamics and historical movements are illustrated below in Figure 2.
Note: The Conference Board is a global, independent business membership and research association working in the public interest. The monthly Consumer Confidence Survey®, based on a probability-design random sample, is conducted for The Conference Board by Nielsen. The index is based on 1985 = 100. The composite value of consumer confidence combines the view of the present situation and of expectations for the next six months.


