Analysis
July 16, 2025
Apparent steel supply remained high in May
Written by Brett Linton
The volume of finished steel entering the US market remained elevated in May, according to SMU’s analysis of Department of Commerce and American Iron and Steel Institute (AISI) data.
We calculate what we call ‘apparent steel supply’ like this: We combine domestic mill shipments with finished US steel imports – and then we subtract total US exports.
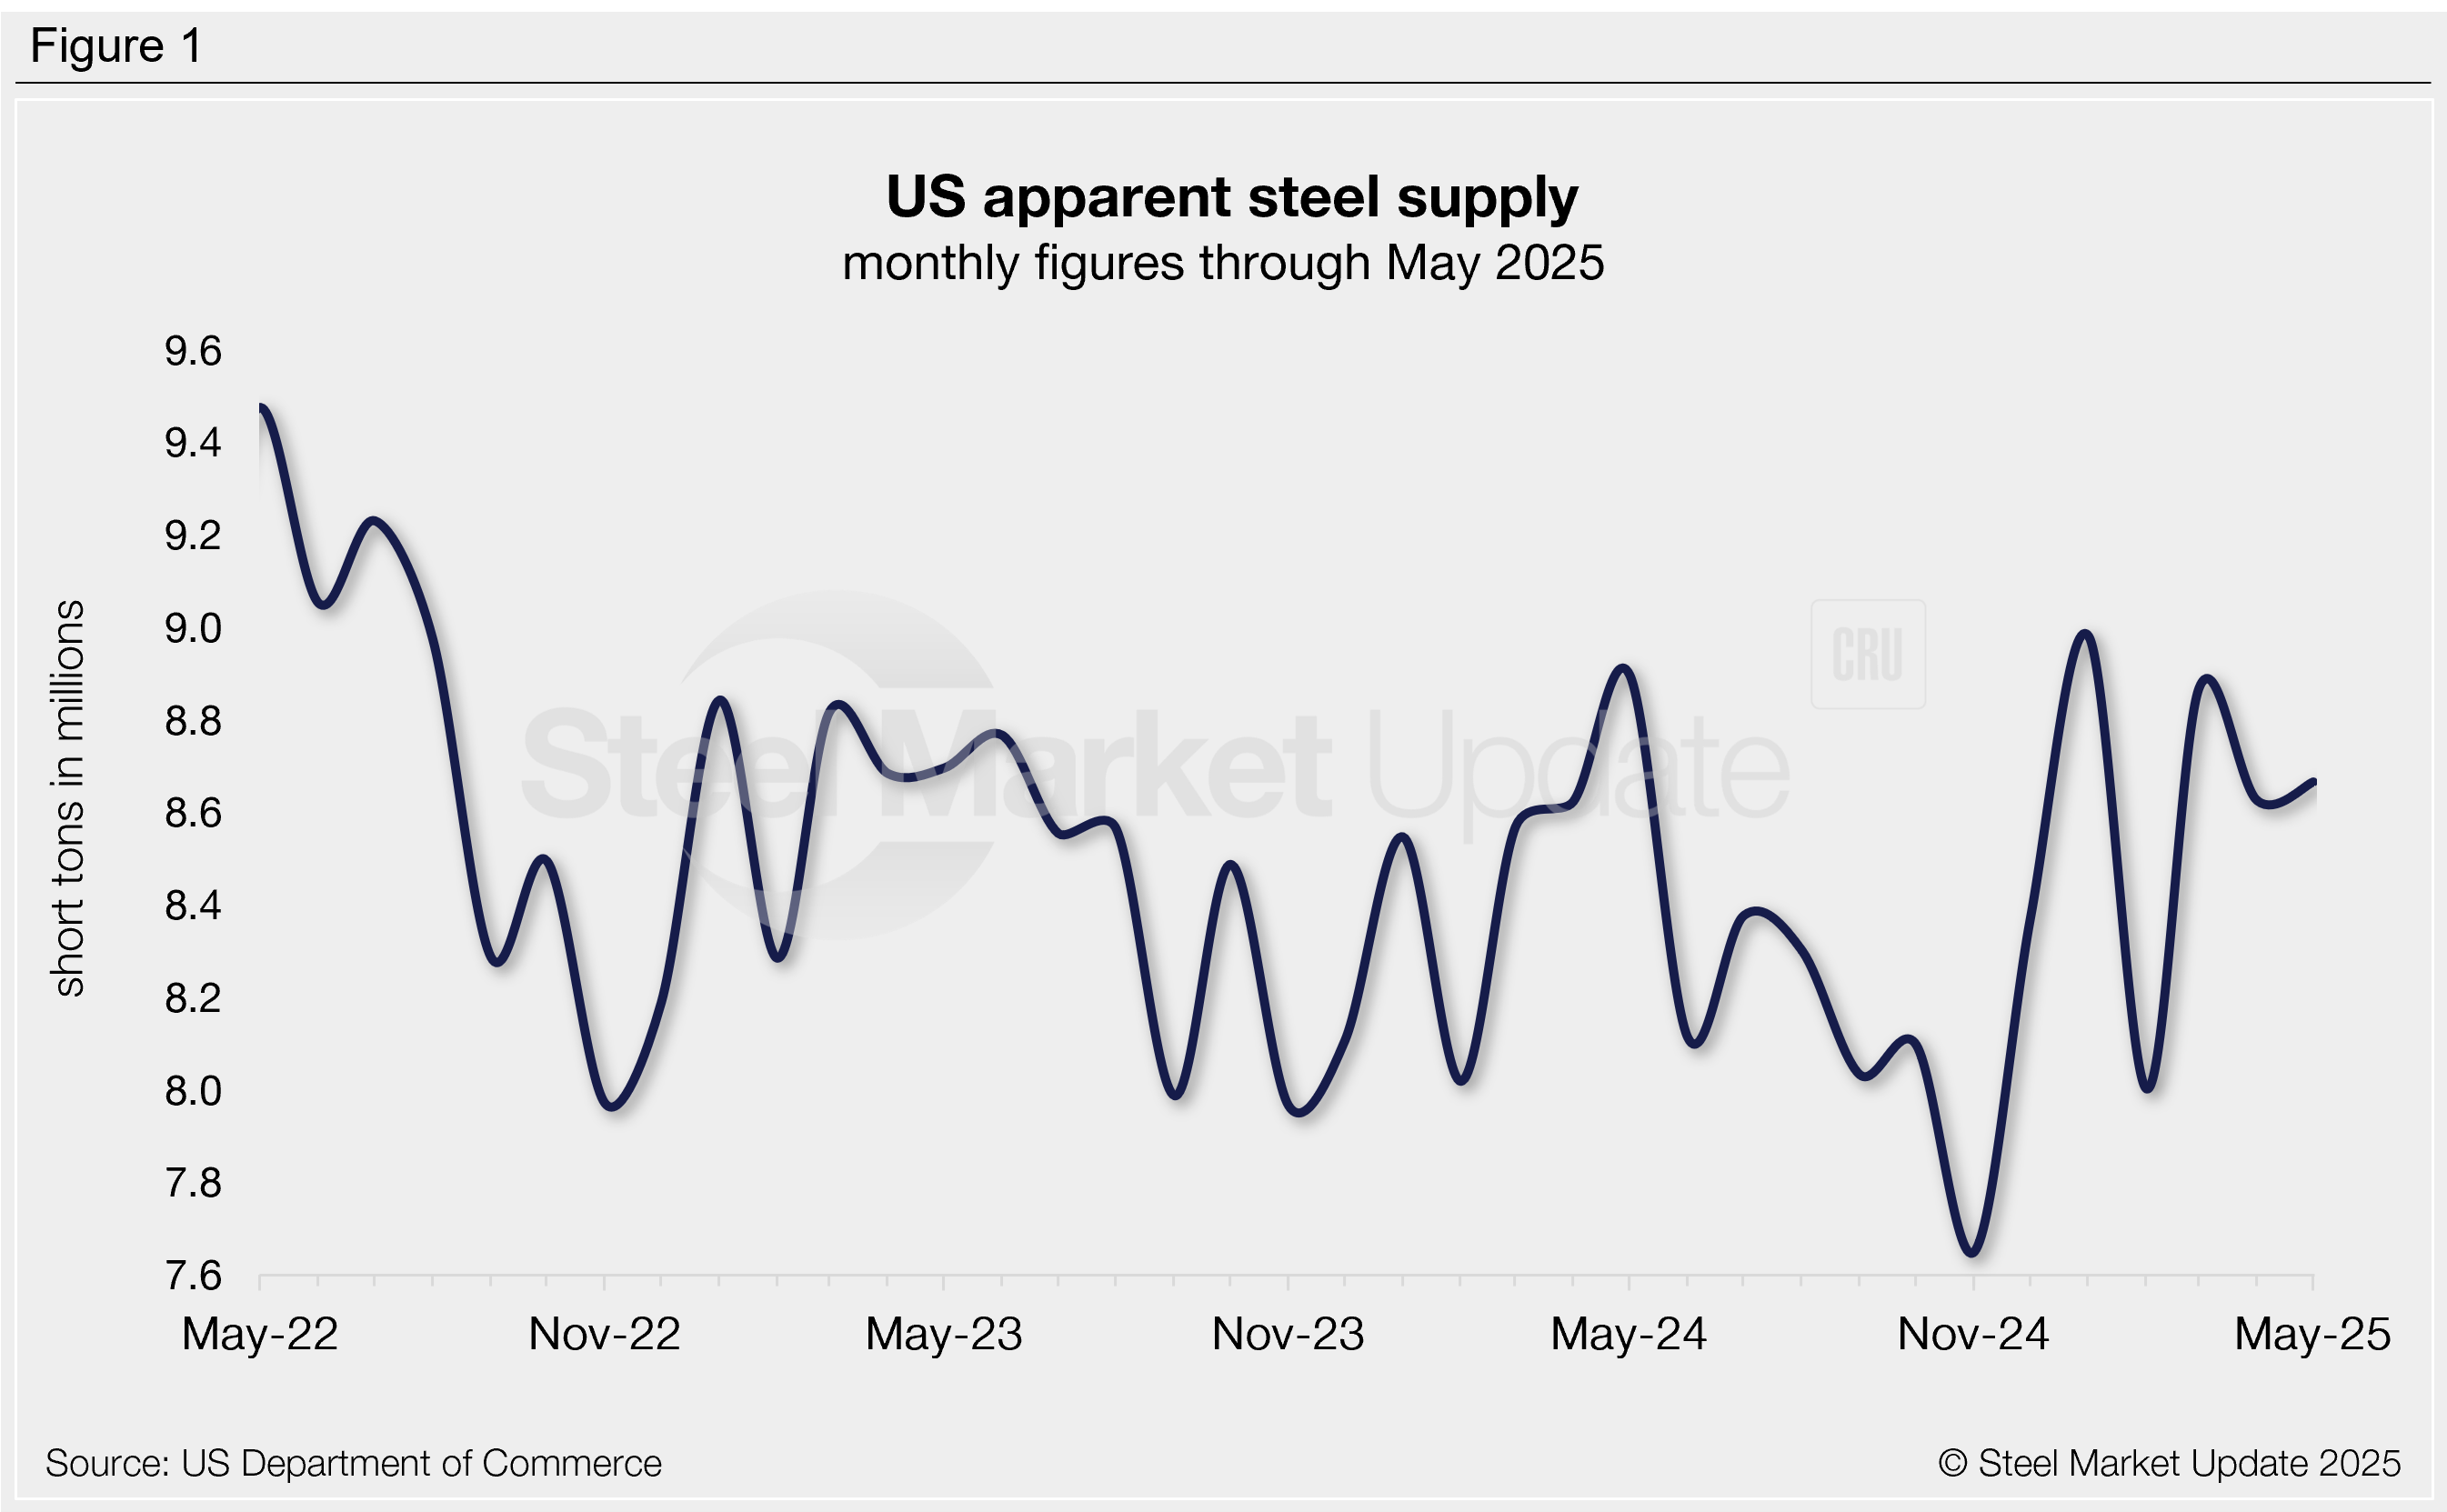
Apparent supply totaled 8.67 million short tons (st) in May, up 40,000 st from April and marking one of the higher levels we’ve seen in the past year. May supply was just 4% shy of the multi-year high reached in January. But it was 3% lower than the same month last year.
Over the past three years, supply has fluctuated within a stable range, averaging 8.46 million st per month during that time (Figure 1). But recent months have shown increased volatility. Case in point: Last November, supply fell to a near four-year low (7.65 million st). It then rebounded in January to a two-and-a-half year high (8.98 million st). For context, the highest measure recorded in our 15-year data history was 10.90 million st in October 2014, while the lowest was 6.52 million st in May 2020.
Trends
Supply can be calculated on a three-month moving average (3MMA) basis to smooth monthly fluctuations and better highlight underlying trends (Figure 2). On this basis, you can see that supply has generally trended downward after peaking in late 2021 (9.87 million st). In fact, it dropped to a four-year low last November (7.93 million st). The 3MMA has rebounded over the last six months, and it rose to a two-year high of 8.72 million st through May.
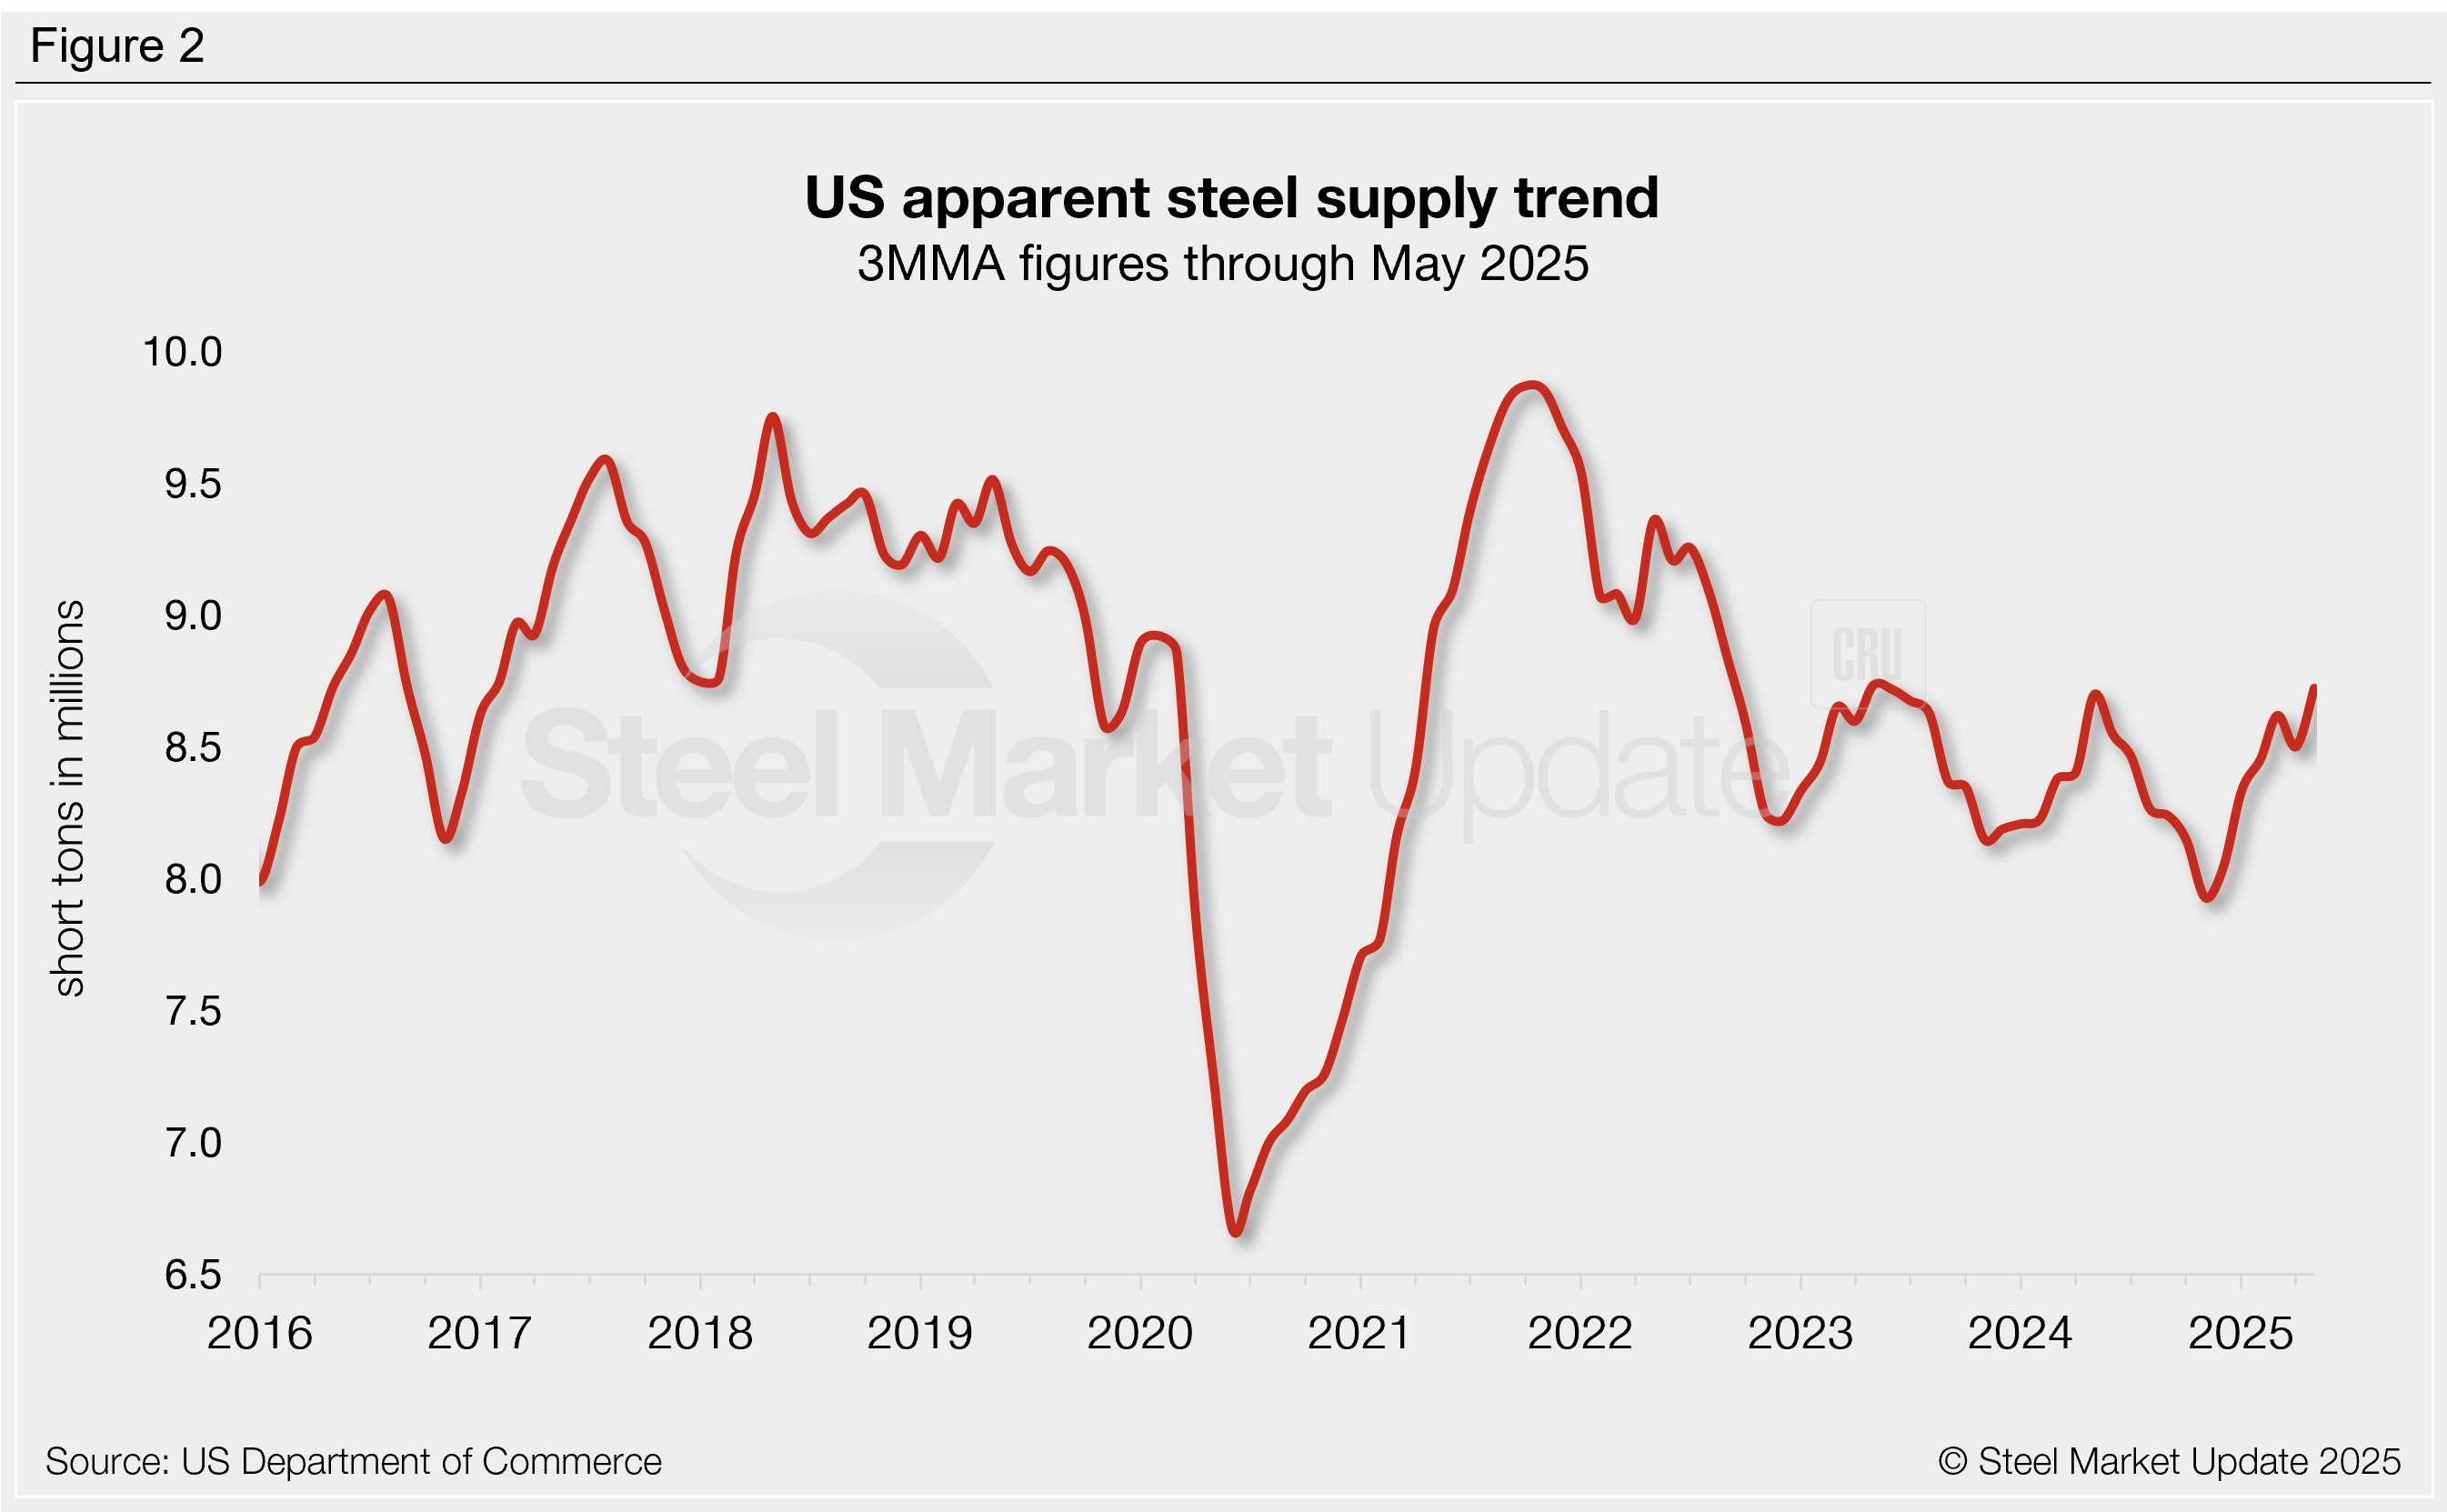
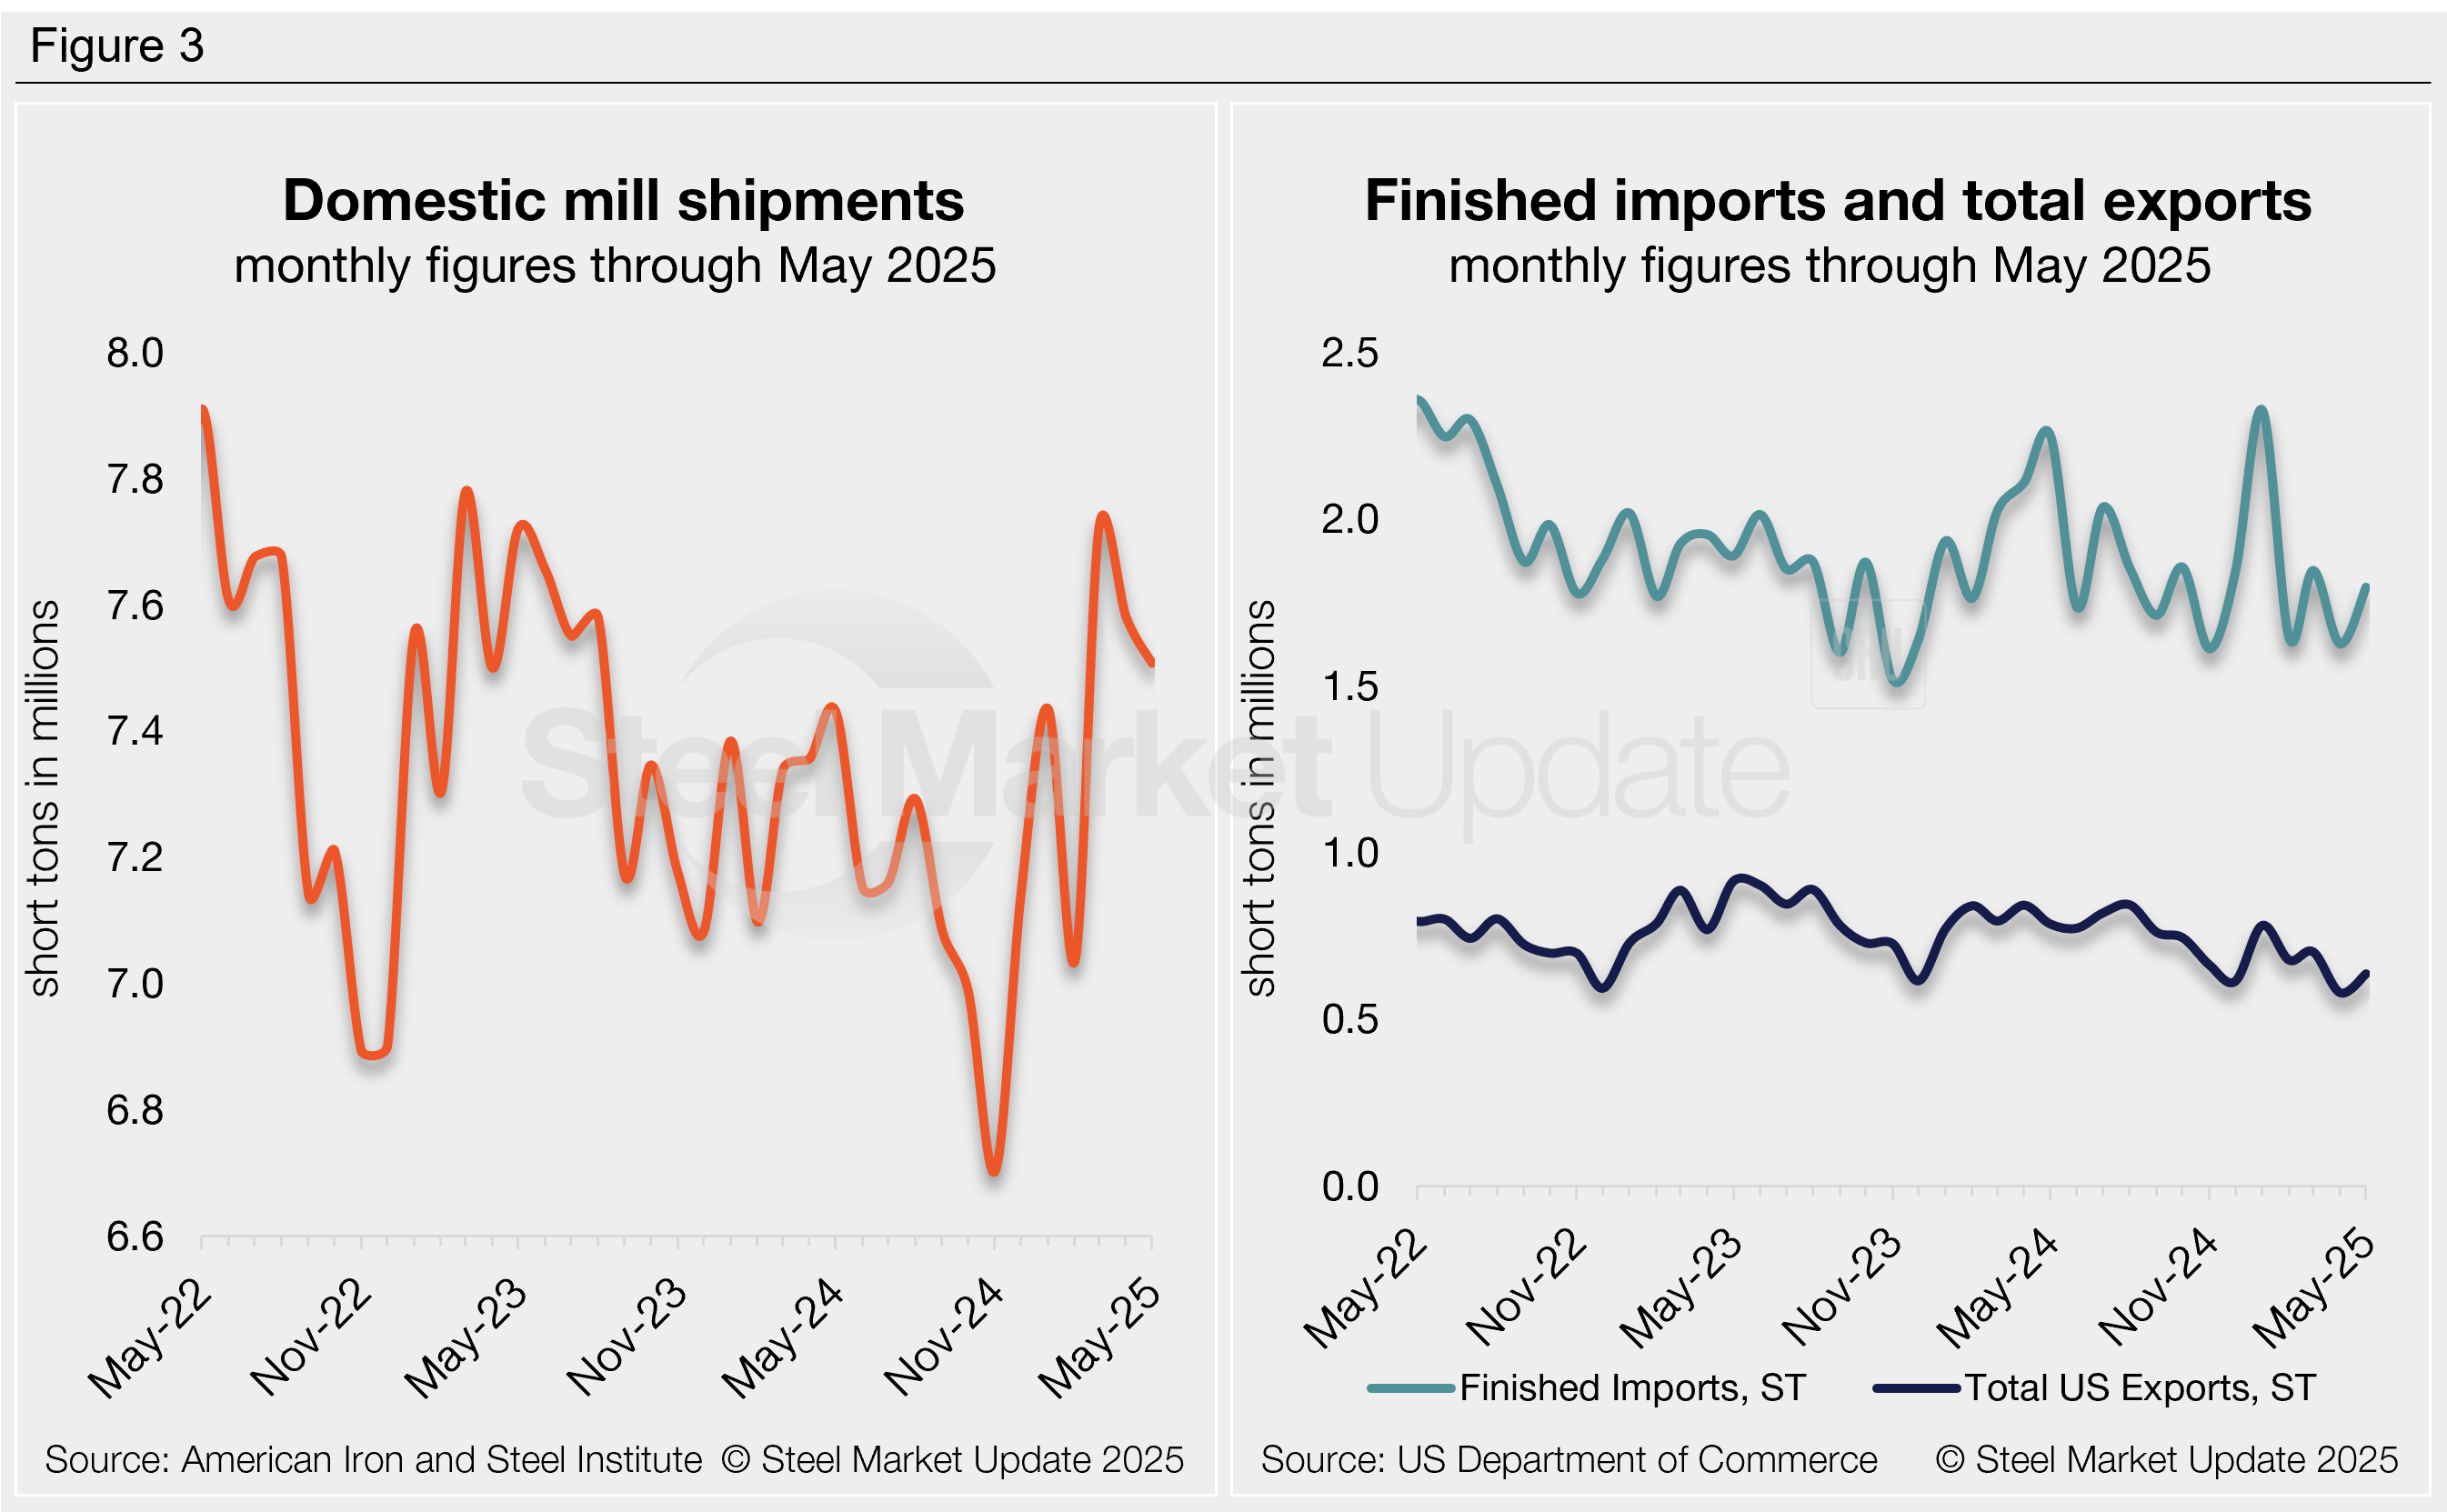
Figure 3 shows the individual components of apparent supply, some of which saw significant shifts from April to May even though supply was essentially flat.
- Domestic shipments dipped 1% (73,000 st) in May. Note that they account for 87% of total supply.
- Finished steel imports rose 9% (170,000 st) from April’s five-month low.
- Steel exports increased 9% (59,000 st) in May after falling to a multi-year low in April.
- Net imports (finished imports minus exports) made up 13% of May’s supply. That’s up from 12% in April but down from 16% a year earlier.
To see an interactive graphic of our apparent steel supply history, click here. If you need any assistance logging into or navigating the website, contact us at info@steelmarketupdate.com.