

Analysis

April 16, 2026
March service center shipments and inventories report
Written by David Schollaert
Flat rolled = 49.3 shipping days of supply
Plate = 45.1 shipping days of supply
Flat rolled
US service centers’ flat-rolled steel supply declined for a third straight month in March, with shipping days of supply slipping to 49.3 on an adjusted basis, according to SMU data.
That figure marks a roughly 12% decline from 56.4 shipping days in March 2025. It also marks the lowest total since June 2021.
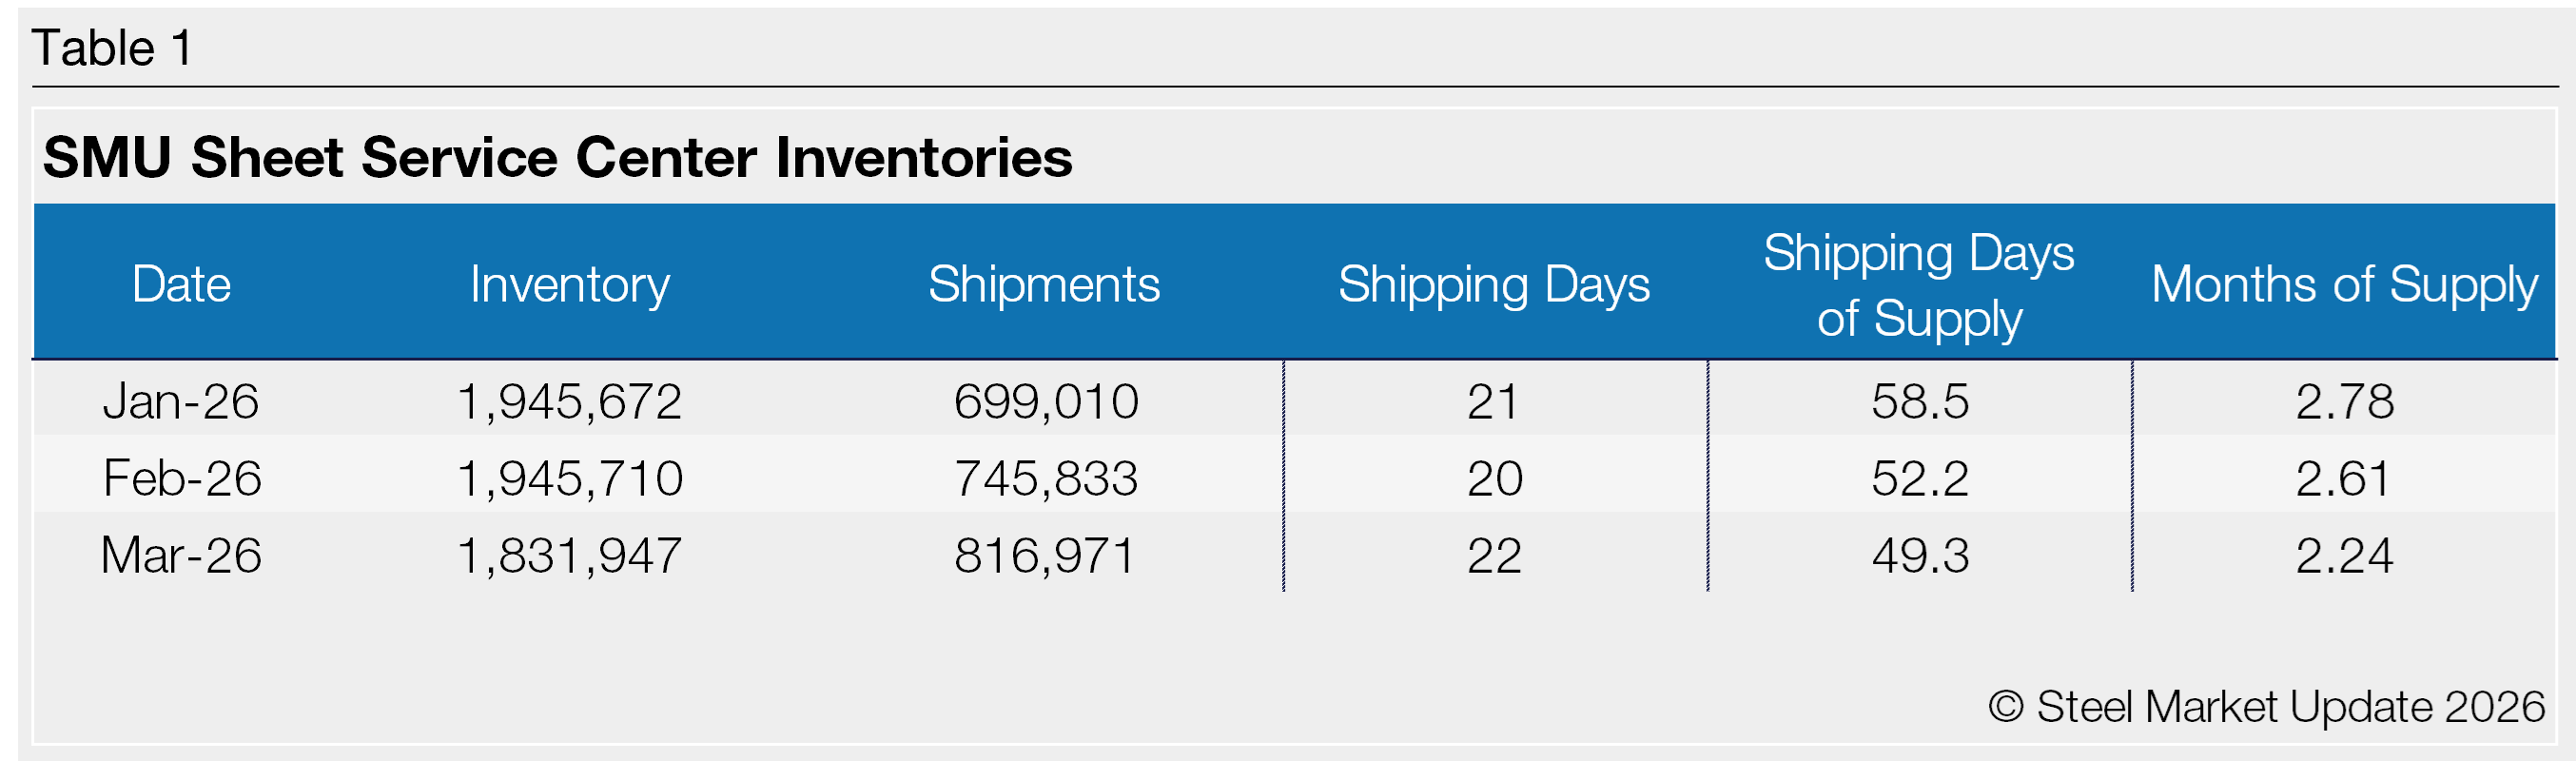
Flat roll inventories represented 2.24 months of supply in March, down 14% from 2.61 in February, and down more than 16% from 2.68 months in March 2025. The month-on-month (m/m) decrease in inventories is largely due to a ~6% drop in intake, likely driven by delayed domestic mill shipments.
Service centers are generally reporting that shipments are outpacing receipts, a dynamic displayed by lower intake and rising on-order volumes.
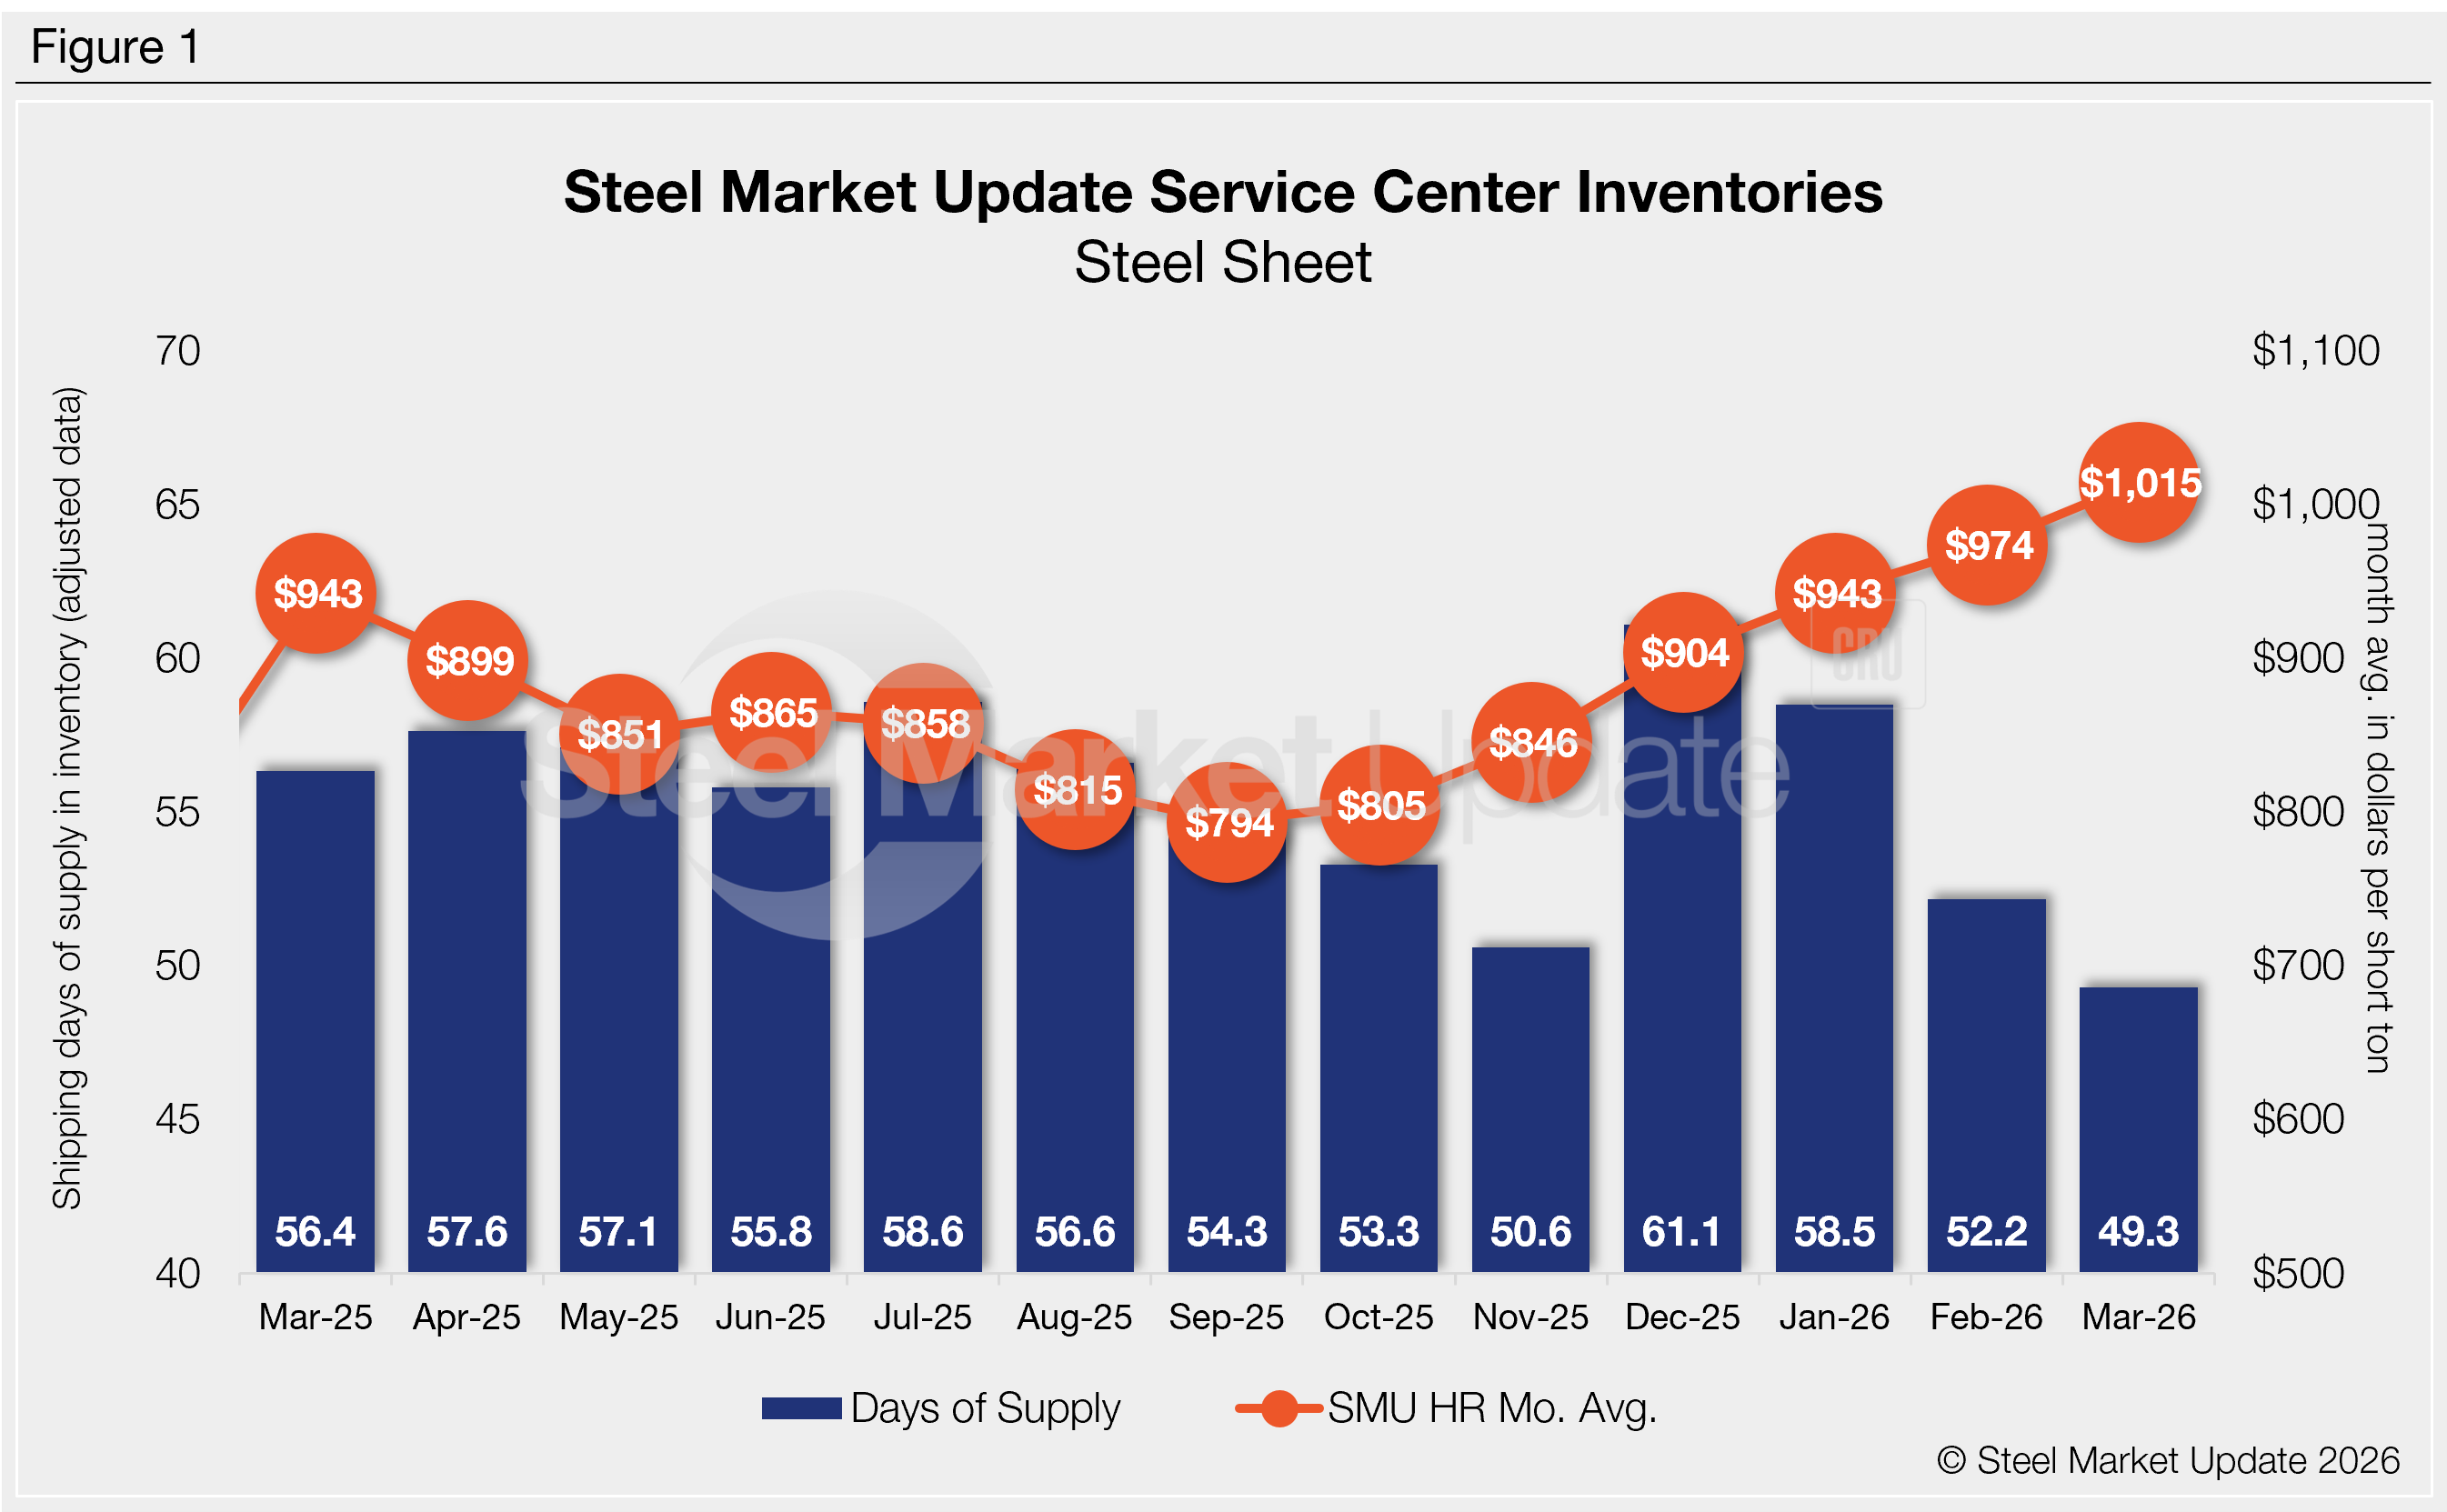
Shipments in March were up 9.5% m/m, and up about 0.2% y/y. The shipping pace remained high – roughly on par with February. But March had 22 shipping days, two days more than February, which caused the shipping rate to appear stronger.
The daily shipping rate was mostly flat, just 0.4% lower m/m and down 4.3% y/y. The decline vs. year-ago levels might reflect a surge in buying activity that occurred in March 2025 ahead of President Trump reinstating stricter Section 232 tariffs on steel and aluminum.
Increased shipments track with market participants’ characterization of demand as flat or up. Case in point: SMU’s late-March survey found that 56% of service centers were releasing the same amount of steel compared to a year earlier, while another 33% were releasing more steel. Only 11% reported releasing less vs. the same time a year earlier. (We find that mid-month survey figures can be a useful early indicator of where full-month service center inventory data will land.)
SMU also recorded an increase of 7.9% m/m in on-order volumes. This likely reflects both an increase in buying activity that coincided with mill delays and extended lead times.
At the end of March, service centers’ shipping days of supply on order were up more than 8% m/m. The dynamic underscores how lean inventories remain.
The latest SMU survey from April 2 showed that lead times remained extended. The result corresponded well with SMU’s April survey, which saw, on average, 21% of service centers building inventory. Seventy-nine percent maintained material, with none reporting an inventory reduction.
Plate
US service center plate inventories were also down in March, as intake fell by more than 18% m/m, according to SMU data.
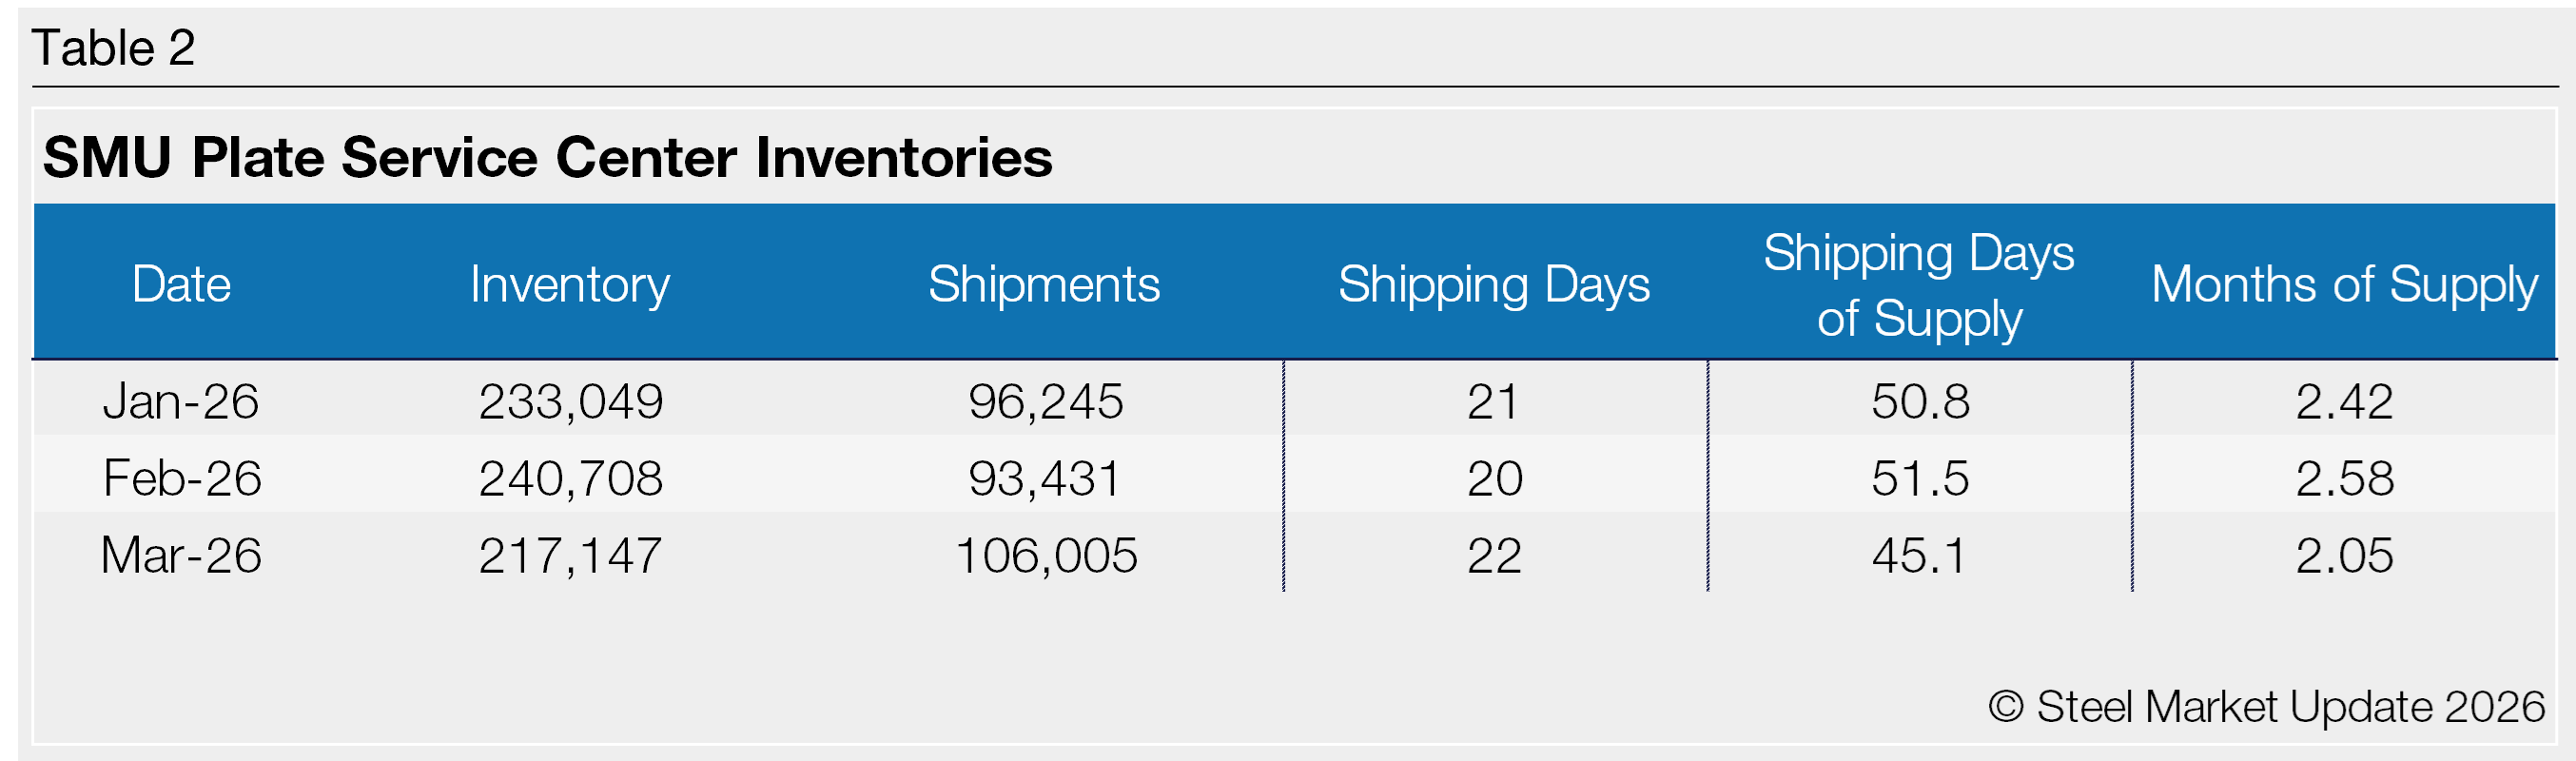
At the end of March, service centers held 45.1 shipping days of supply, down from 51.5 in February. Plate supply in March represented 2.05 months, down from 2.58 months in February.
Last month’s plate results mimic sheet dynamics: A sharp cut in intake as shipments outpaced receipts due to mill delays. March inventories were 9.8% lower m/m, while shipments saw a boost of more than 13% vs. February.
March plate supply was also down vs. year-ago levels, when service centers carried 45.7 shipping days of supply, or 2.18 months of supply.
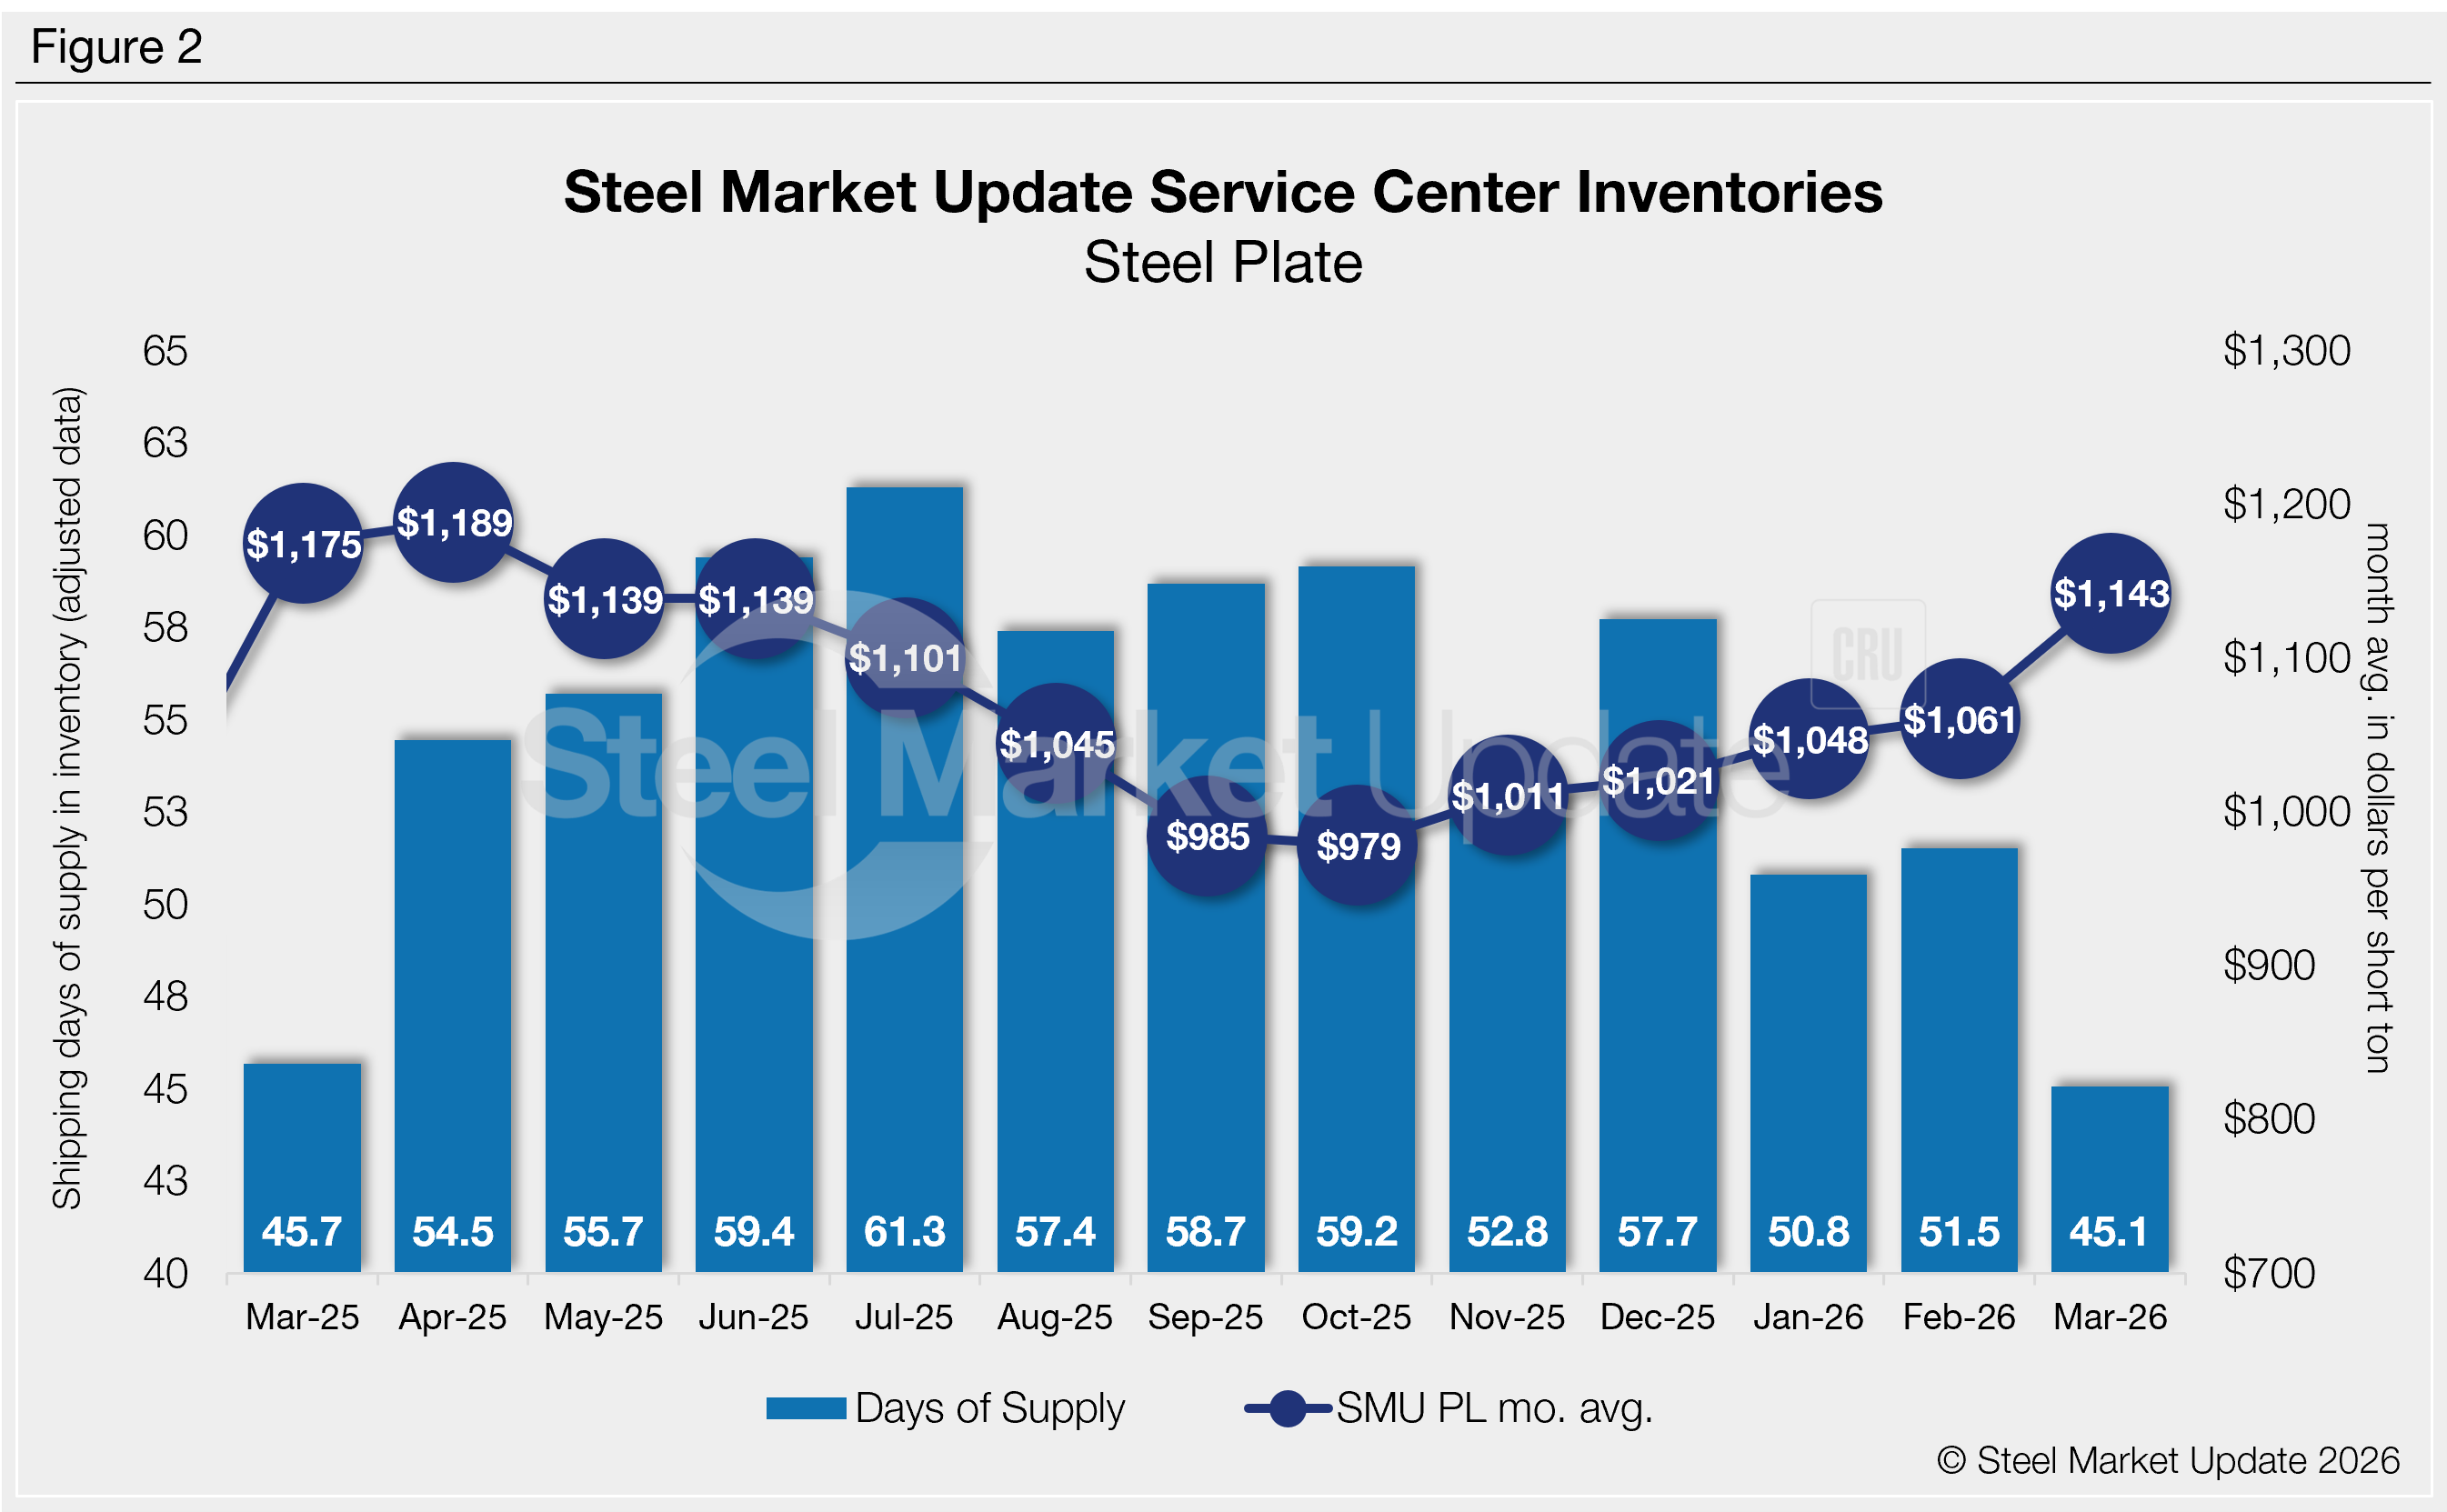
The daily shipping rate, meanwhile, was the highest since February 2020. Does this suggest peak shipping levels, or is plate demand back in a significant way? There are also some concerns about what’s driving the increase in demand. In other words, what is pull-ahead demand vs. underlying demand given that some buyers are trying to buy ahead to cover potential shortfalls as supply concerns grow?
Material on order rose in March, up nearly 16% m/m, and up more than 31% y/y. The trend was partly supported by a bump in shipping days of supply on order. At the end of March, service centers’ shipping days of supply on order were up 12.3% from February, and up nearly 27% from March 2025.
While added domestic capacity has offset lower imports, plate lead times remain extended. They now stand at nearly 7.1 weeks on average, up modestly from a month earlier, according to the latest SMU survey.
Some market participants fear that inventories are becoming too lean, especially given an uptick in project work. But others tell us plate demand has not picked up materially for the better part of the last seven months.
And given tight supplies, mills have pushed through price increases throughout Q1 and into Q2. And those increases are being passed down through the supply chain.


