Analysis

June 17, 2026
SMU's Mill Order Index accelerates in May
Written by David Schollaert
SMU’s Mill Order Index (MOI) recovered a bit in May, reclaiming some momentum lost the month prior. The result came as service center on-order volumes and new order entries continue to rise, according to our latest service center inventories data.
The trend underscores a rising on-order pipeline due to extended lead times and buyers working to secure material. New mill order entries in May were up nearly 3% vs. April as a result. And this comes even as service centers try to backfill and even pad inventories or double-buy. The dynamic remains complicated as the market continues to experience a supply-side squeeze.
Still, May intake was marginally down 0.5% month on month (m/m), outpacing outbound shipments, which lagged by 5.3% vs. April.
Service centers’ daily shipping rates—down 0.6% from April—were up, however, more than 6% vs. year-ago levels, despite fewer shipping days. Average shipping days last month were 20, down from 21 in April.
Key highlights
Recent efforts to maintain leaner inventories appear to have shifted as steel availability is squeezed. This is reflected in a jump in the percentage of inventory on order, which rose more than 9% m/m. It’s the highest total since October 2022, and exceeds current inventory levels by nearly 6%.
While service centers try to balance inventory with demand, it has become more challenging. Mill contracts are generally held to minimums, and spot tons are not readily available.
A boost in inner-buying or double-buying has been reported. And service centers relying heavily on contract tons are seeing supply lag outbound shipments. When comparing year-ago levels, inventories are down 17%, while shipments are up about 1%.
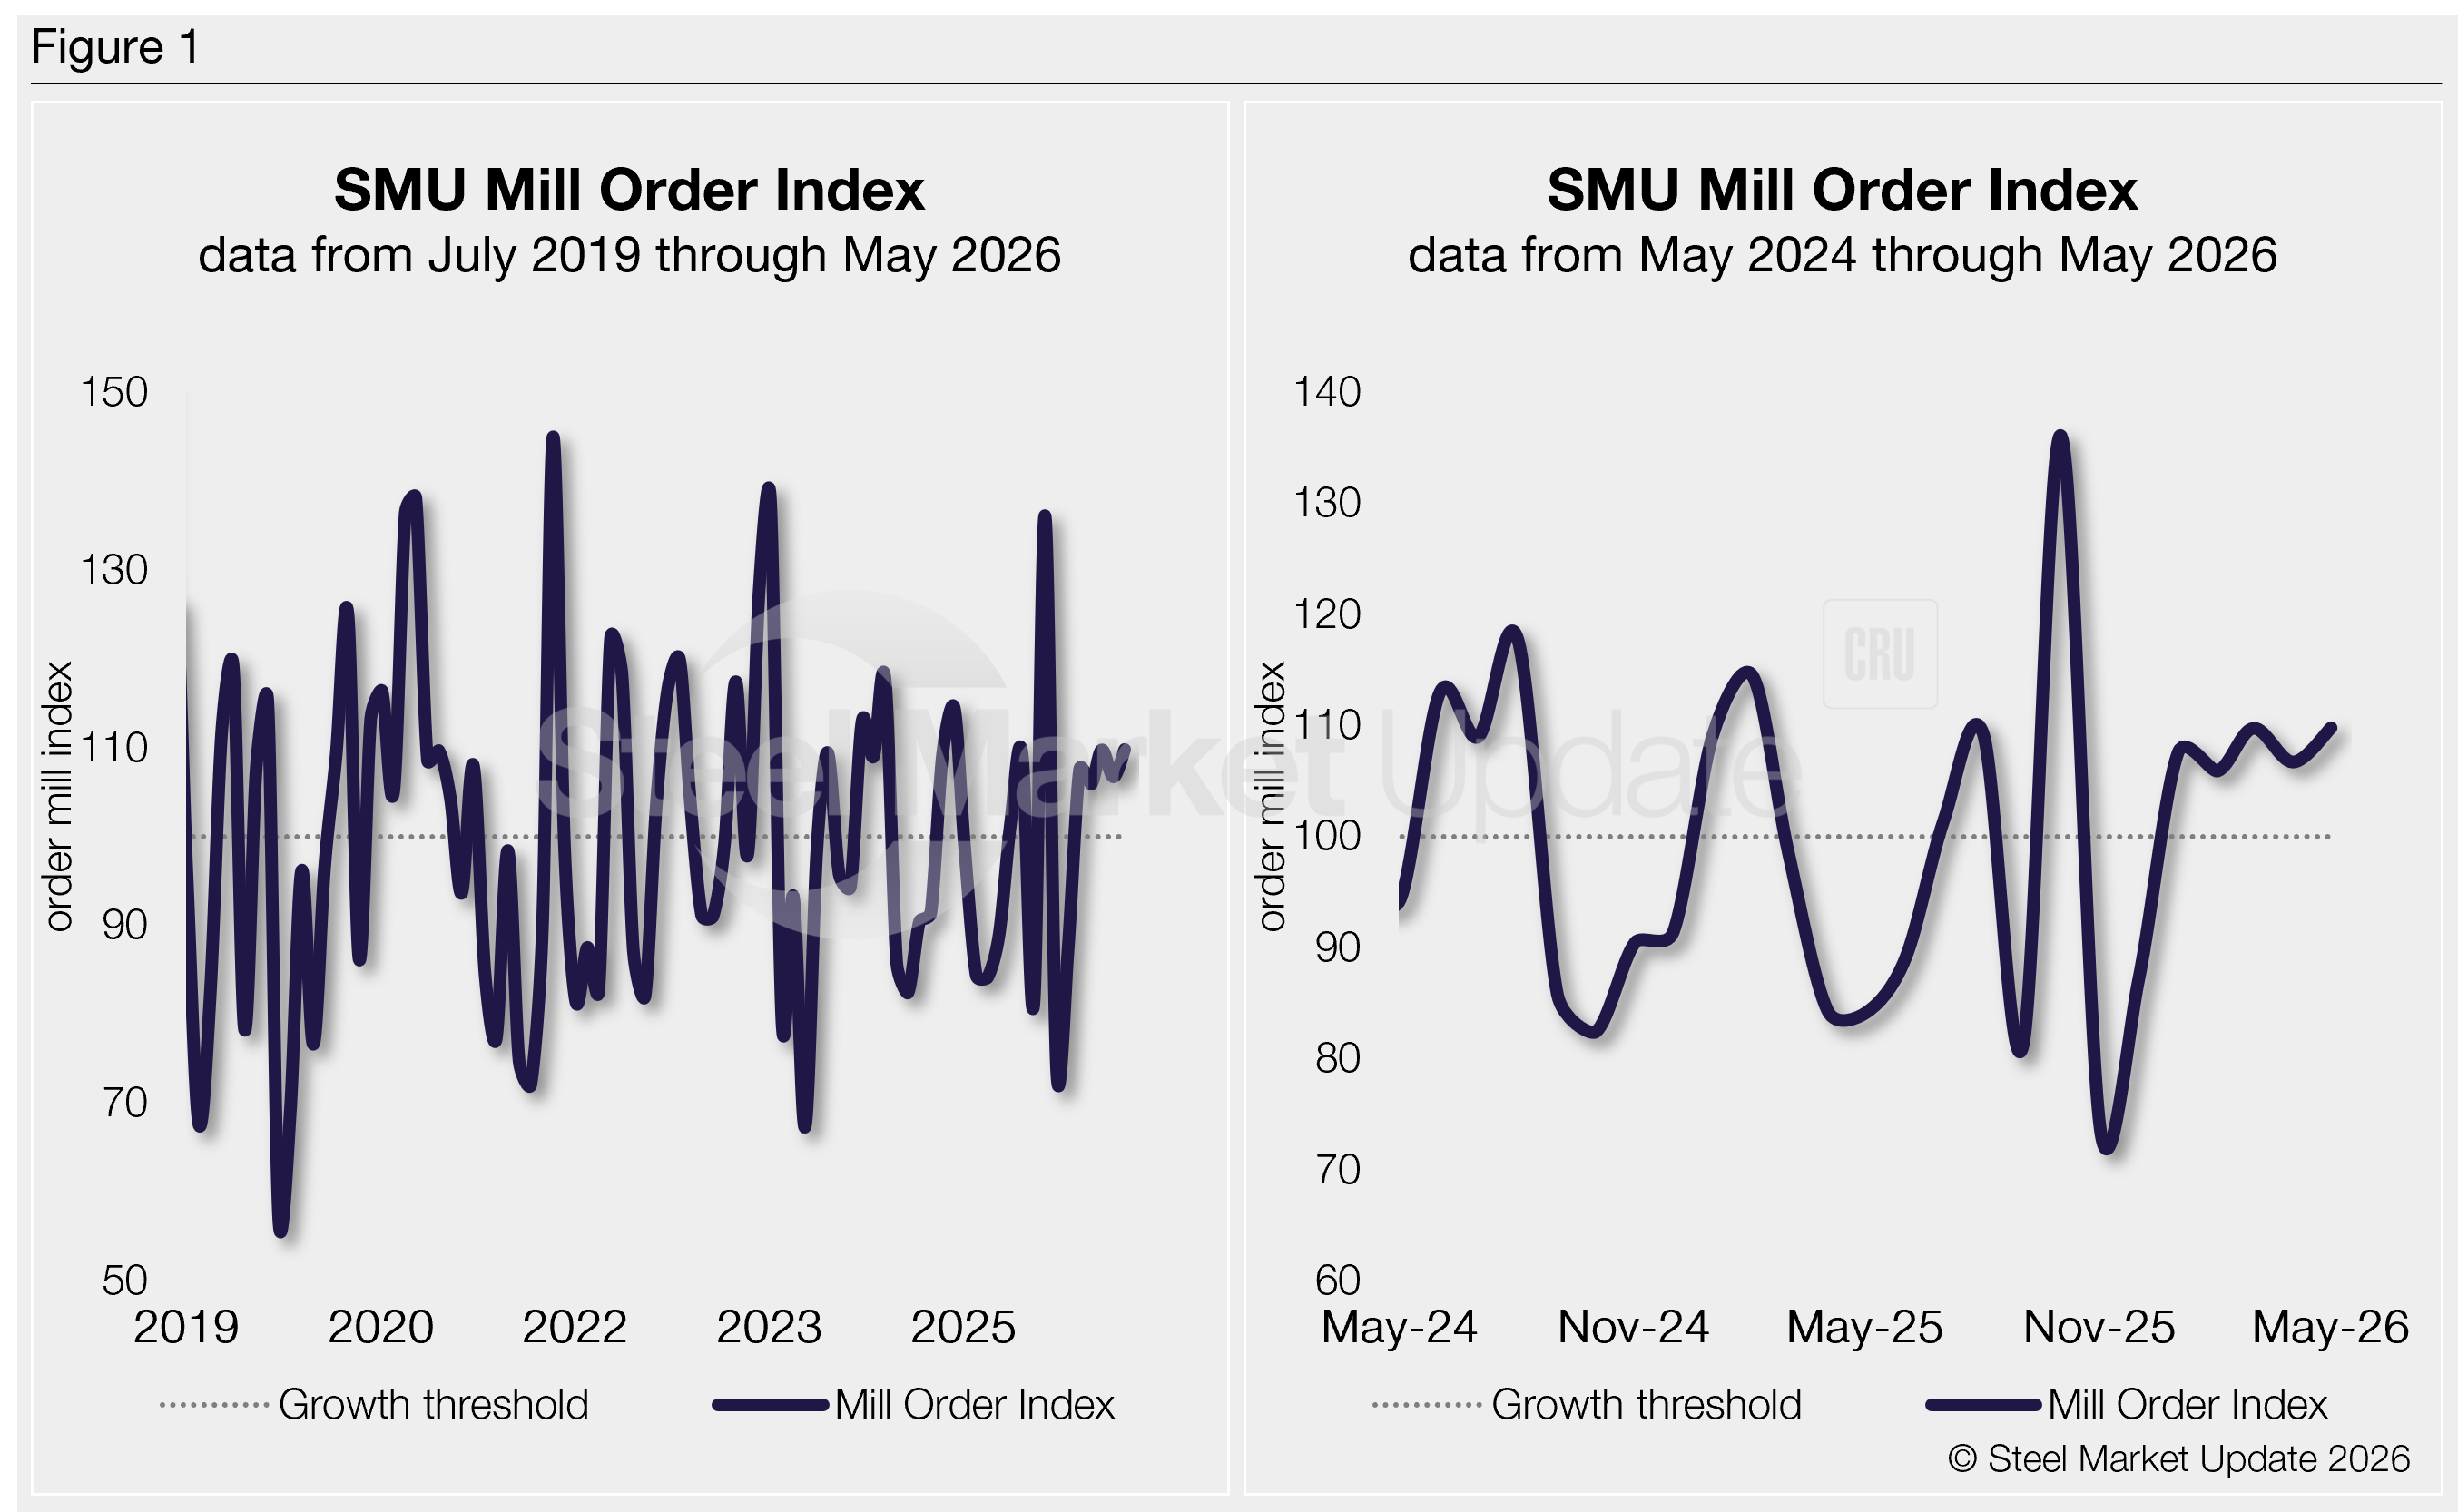
The MOI now stands at 109.8, up 2.9% from 106.7 in April. The rate was just slightly above the average year-to-date reading of 107.5, but up more than 30% y/y. Results suggest inventories remain uncomfortably lean as service centers try to rebalance stock as available units are squeezed.
Methodology
SMU derives its MOI—a relative index that evaluates the latest change in service center mill order entries—from our monthly service center inventory data. This index is a good indicator of current service center buying patterns, displaying perceived demand and lead times. This stands out because lead times typically signal upcoming moves in steel prices.
The MOI uses a base period, presently 2022-24, to establish a reference point for measuring service centers’ mill orders over time. This base period is assigned an index value of 100. Subsequent MOI values are then calculated relative to this base.
An index score above 100 indicates an increase in buying, and a score below 100 indicates a decrease.
Figure 1 shows the nearly six-year history of the index on the left and provides a closer look at the MOI readings of the past two years on the right (100 = 2022-2024 average).
Background
Market conditions in 2025 saw brief price spikes, but overall activity remained mostly steady and at times sluggish. It was held back by weak end‑use demand (as shown in the right‑side chart of Figure 1).
Intake volumes rose through much of Q1 last year as downstream buyers pulled purchases forward in anticipation of tariff‑driven price increases. That surge in service center orders pushed mill prices up quickly, even though underlying demand didn’t improve.
After peaking a year earlier, intake volumes began a gradual decline. Service centers ultimately caught the market low point in October and held their positions through the end of 2025.
What got us here
Seasonal buying patterns saw intake volumes generally improve in Q1. But gains remain subdued and well behind year-ago levels. While downstream customers were tightly managing inventories, prioritizing contract fulfillment, service‑center shipments showed just a marginal lift. In some ways, service centers and distributors mimicked those dynamics.
While new order entries saw a notable increase in October—reaching a two-year high—they quickly declined by more than 30% in November and have since been relatively stable.
Still, May’s intake was only 2.3% above the monthly average intake since last November.
The data would indicate the improvement and subsequent leveling observed in the first three months of 2026 are in line with seasonal patterns. But some unplanned outages and production delays have highlighted a supply-side squeeze and pushed prices up.
SMU’s MOI will likely rise in the immediate term and potentially into Q3. The general expectation is that inventories, while tight, could be impacted even more as new order entries rise, and lead times remain longer than normal. Production delays and planned outages for late Q2 will likely keep lead times extended. This would likely further impact the supply pipeline.
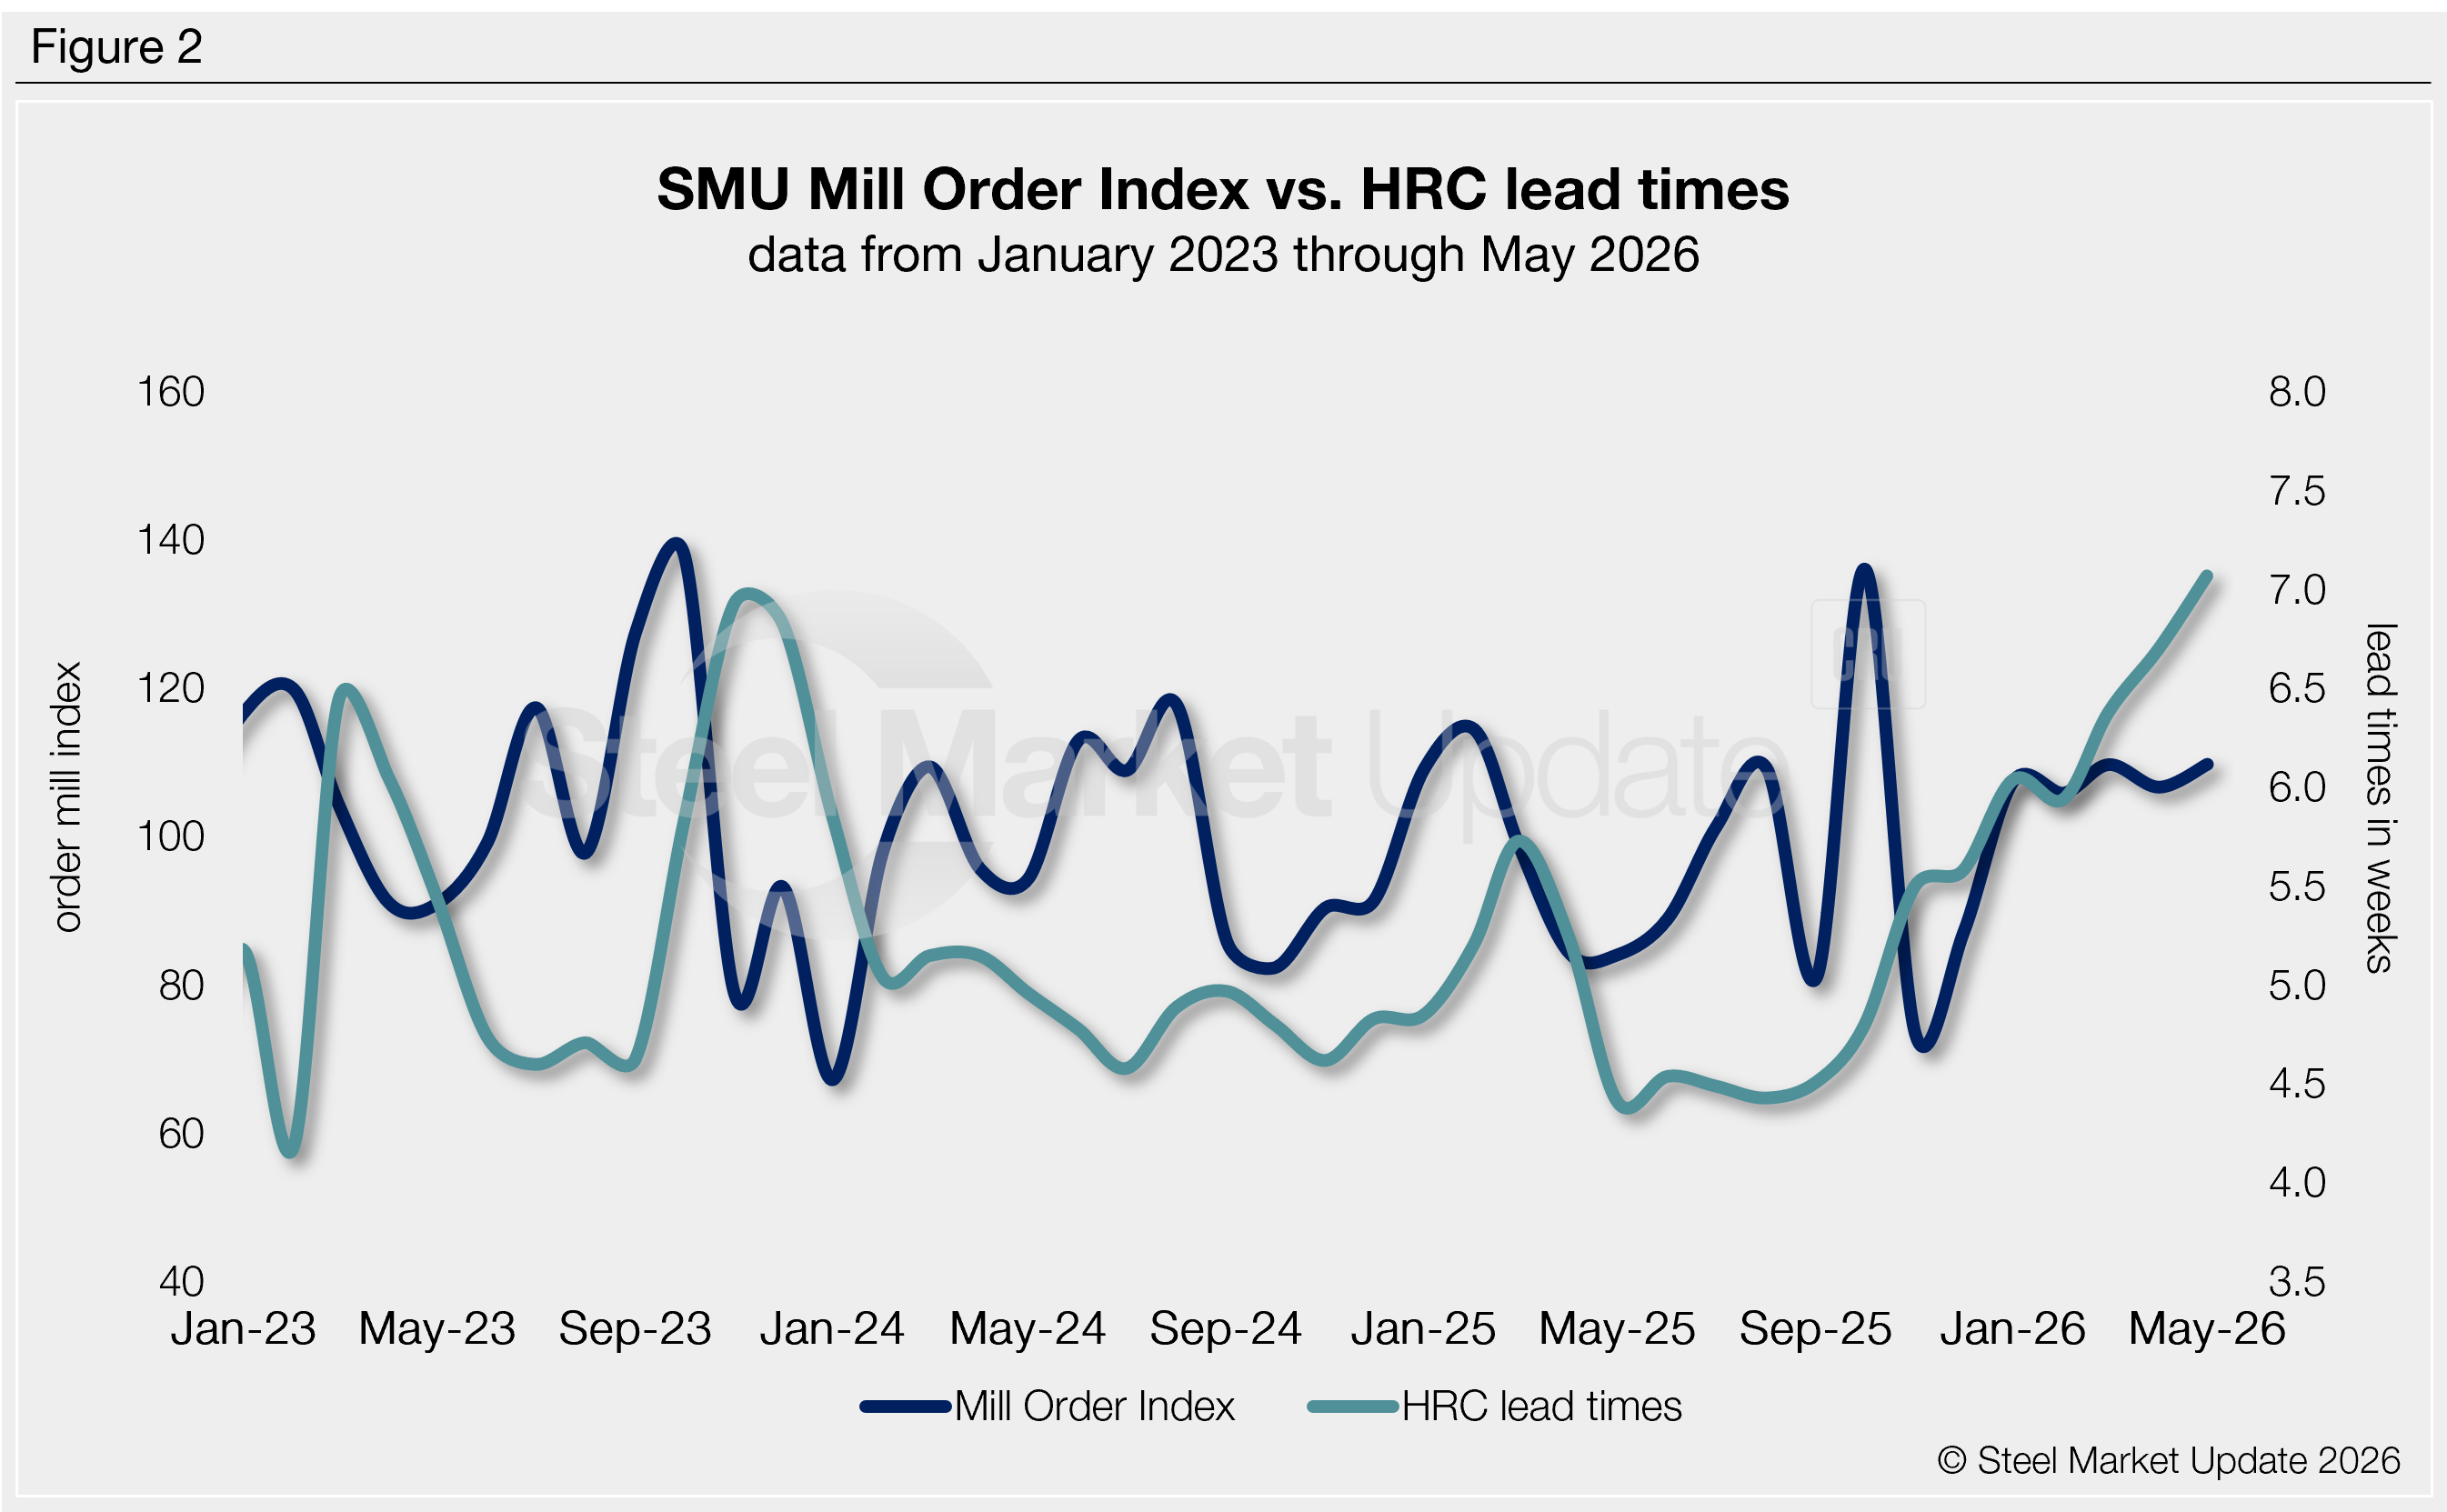
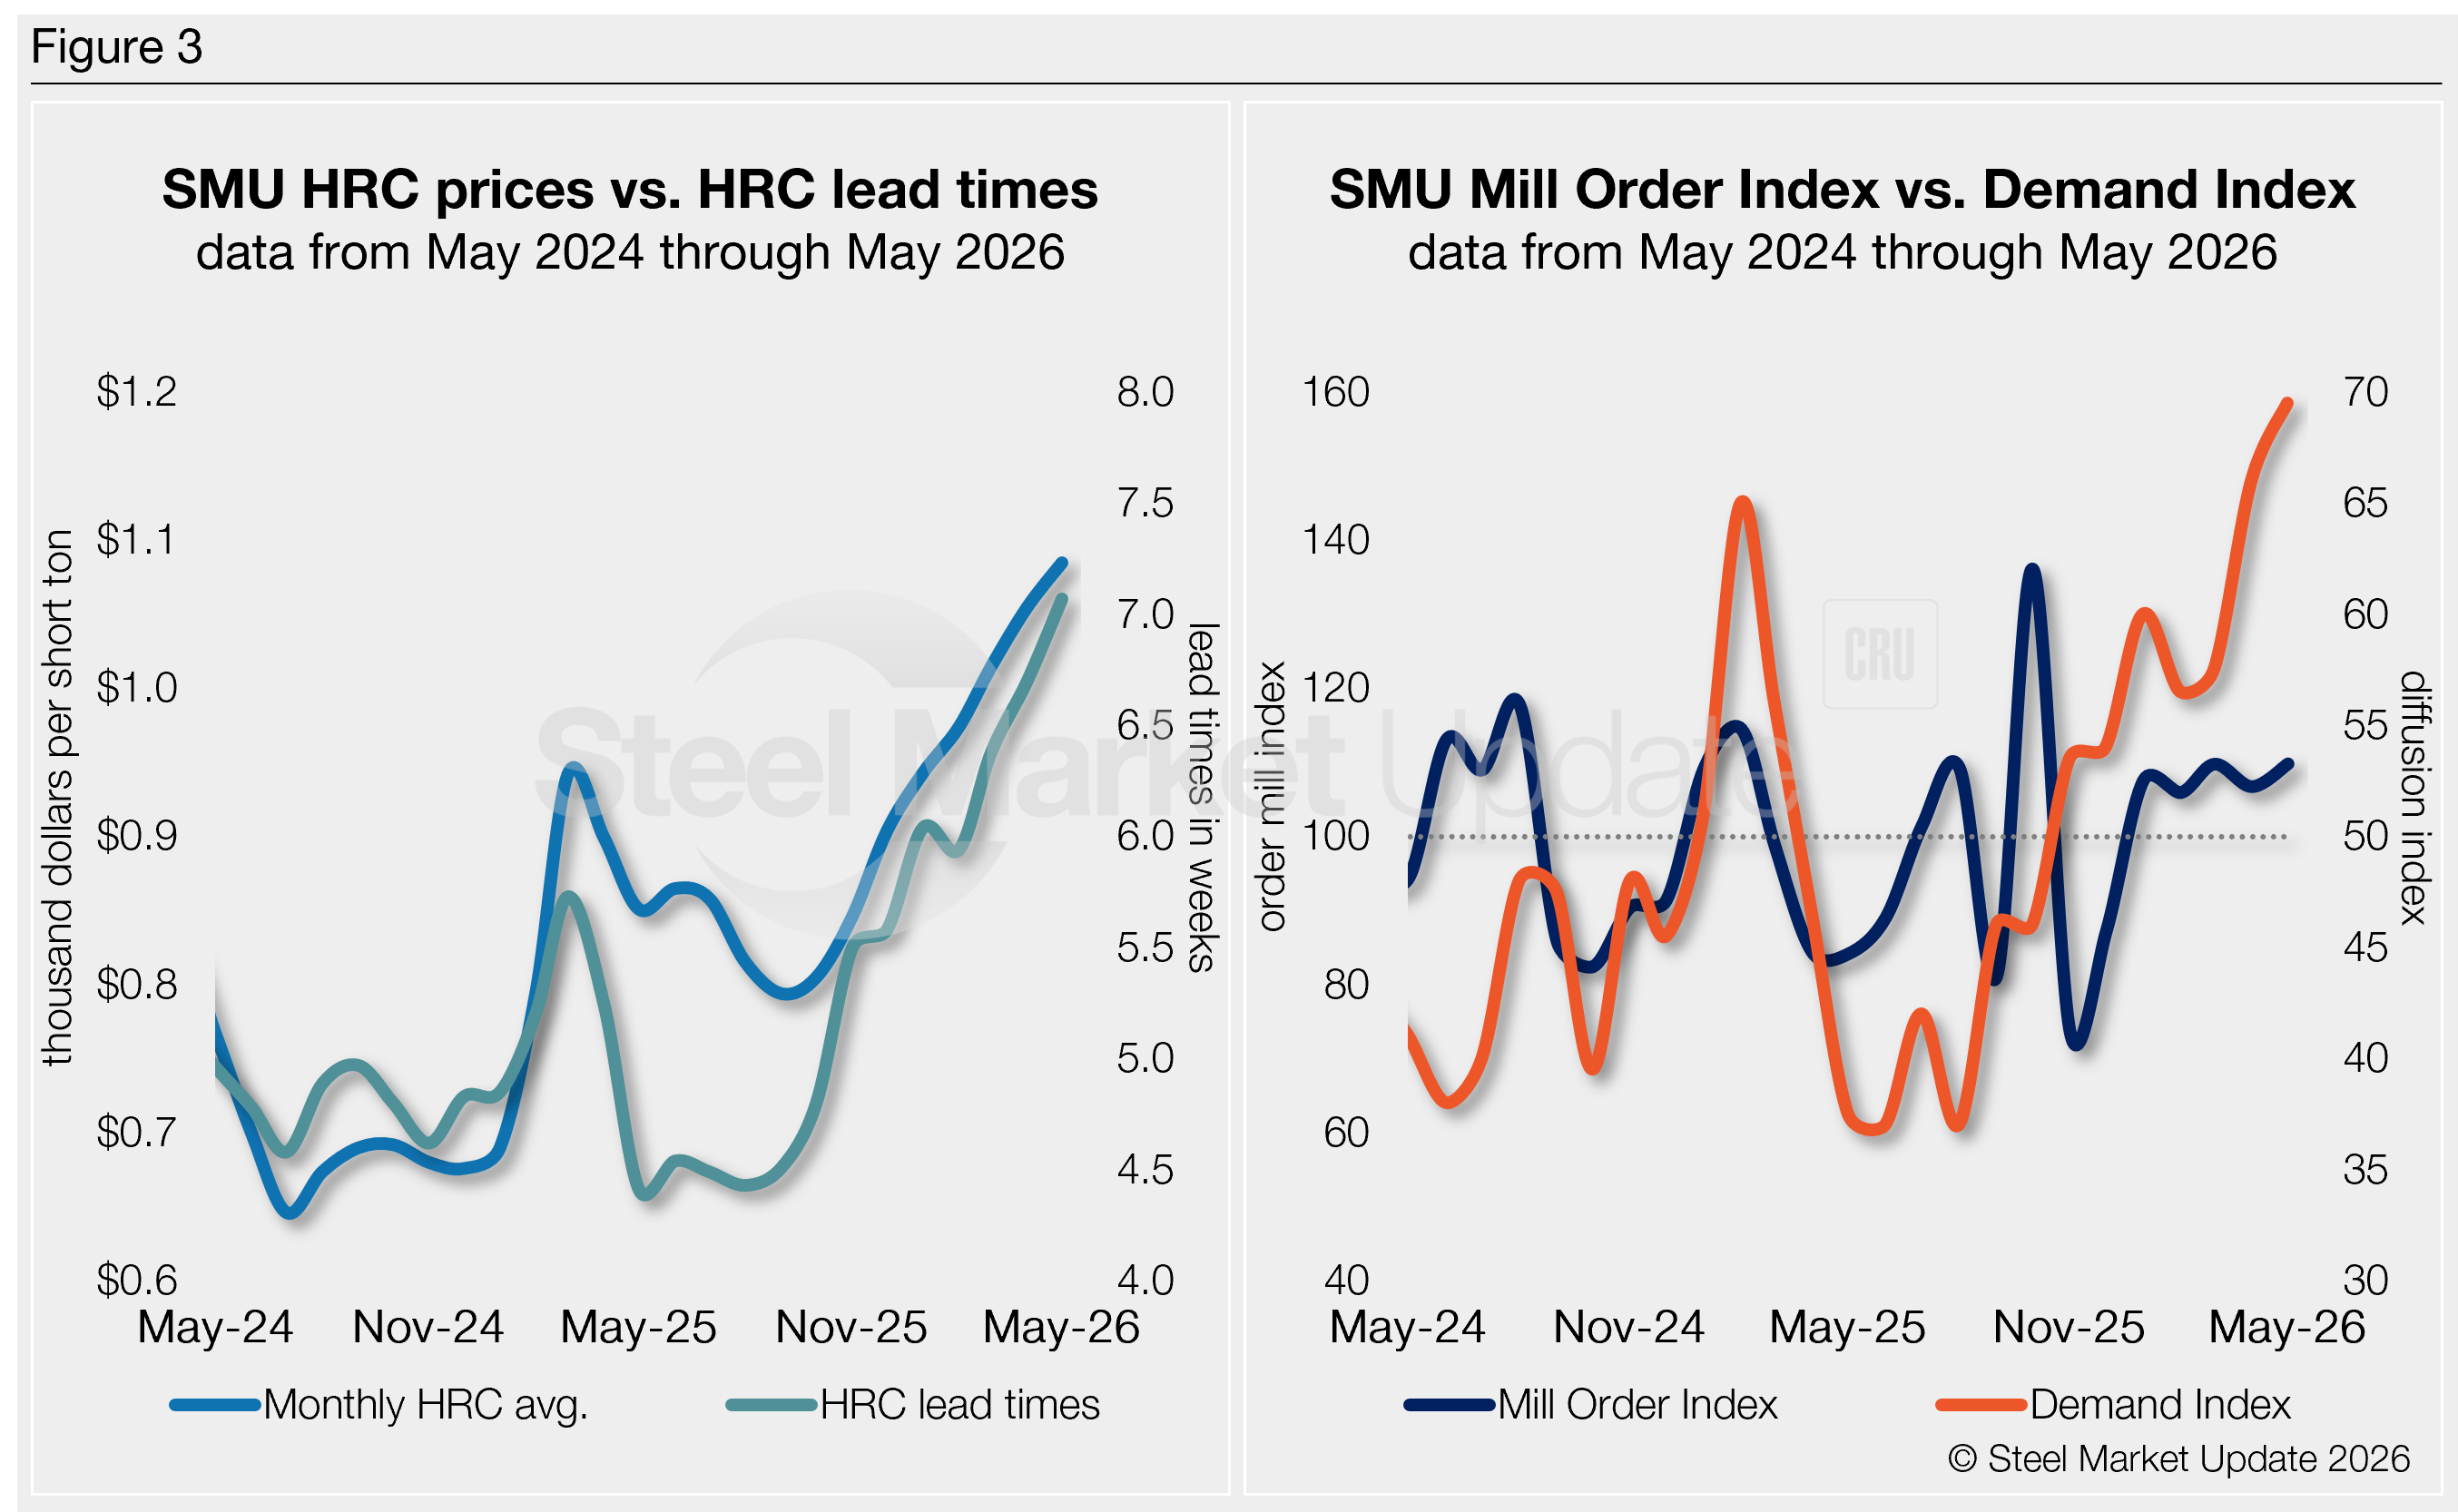
SMU’s MOI pairs well with—and for the past five years has preceded—moves in mill lead times (Figure 2), though the latest results would indicate a divergence. And SMU’s lead times have also been a leading indicator of flat-rolled steel prices, particularly for HRC (see left-side chart in Figure 3).
Our MOI also pairs well with our Steel Demand Index (see right-side chart in Figure 3), which, for nearly a decade, has preceded moves in mill lead times. But, again, the latest data denotes a disagreement.
How will things settle?
May inventories are down 17% y/y while shipments are nearly flat (+1%). HRC prices have been on the rise, now up $345 per short ton (st) since late September. And lead times have been steadily stretching out, now at 7.4 weeks on average in our latest assessment, up from 7.1 in late May.
The trend points to a downstream supply chain that’s very lean. We’ve been told by some sources that the supply chain is the most constrained it has been, outside of a black swan event.
Many still see May inventories somewhat aligned with demand, but extending lead times and this tight setup are contributing to rising prices.
Longer lead times and limited spot tons will drive prices higher. While availability appears to be less than some believe, it’s driving competition. And some sources have indicated that imports could relieve some of the tightness.
That tension likely explains why the Mill Order Index remains firm, and our Demand Index continues to expand.
We’ll continue to monitor shifts in our data as we approach Q3.