

Market Data

June 13, 2017
Producer Price Indexes of Sheet Steel, Aluminum, Plastic and Transportation
Written by Peter Wright
We start this report with comments made by Jun Wei Yeo on iron ore and coking coal. “In April to May alone, there was an over 30 percent drop in the price of iron ore. Iron ore mining companies such as Rio Tinto, BHP Billiton, and Brazil’s Vale are suffering simultaneous stock price declines. Most articles claim that the slowdown in Chinese growth and consumption are the major cause of this decline, but there are more forces at play. China is developing its iron ore mining capabilities, resulting in a decreased reliance on Australian ore imports. Mining.com recently released an article stating that once-shuttered iron mines are re-opening, adding another 30 million metric tons to the world supply. Additionally, another recent headwind is the increase in the usage of scrap in China, where Platts reports basic oxygen steelmaking plants have nearly doubled their use of scrap to as much as 17.5 percent (Mining.com). The next most essential export from Australia is coal briquettes, the price of which is rapidly declining to normal levels after cyclone Debbie disrupted the supply of coal required by China. The Australian dollar will gradually track these declines in commodity prices.”
![]() On Tuesday this week, the Bureau of Labor Statistics (BLS) released its series of Producer Price Indexes (PPI) for more than 10,000 goods and materials. For an explanation of this program, see the end of this piece. The latest release reported results through May. We run this analysis every three or four months to provide information for subscribers on any changes in the competitive position of steel against other materials and rail vs. truck transportation. The PPI data are helpful in monitoring the price direction of steel and steel products against competing materials and products. As far as we at SMU can tell from comparison with known transaction prices, these PPIs are a reasonable representation of the real world, though there may be a lag between the BLS reports and spot prices for steel products. We have also concluded that the actual index values of the PPIs of different products cannot be compared with one another because they are developed by different committees within the BLS. We believe that this data is useful in comparing the direction of prices in the short and medium term, but not the absolute value.
On Tuesday this week, the Bureau of Labor Statistics (BLS) released its series of Producer Price Indexes (PPI) for more than 10,000 goods and materials. For an explanation of this program, see the end of this piece. The latest release reported results through May. We run this analysis every three or four months to provide information for subscribers on any changes in the competitive position of steel against other materials and rail vs. truck transportation. The PPI data are helpful in monitoring the price direction of steel and steel products against competing materials and products. As far as we at SMU can tell from comparison with known transaction prices, these PPIs are a reasonable representation of the real world, though there may be a lag between the BLS reports and spot prices for steel products. We have also concluded that the actual index values of the PPIs of different products cannot be compared with one another because they are developed by different committees within the BLS. We believe that this data is useful in comparing the direction of prices in the short and medium term, but not the absolute value.
The following is an abridged version of the May report from the BLS: “The Producer Price Index for final demand was unchanged in May, seasonally adjusted, the U.S. Bureau of Labor Statistics reported today. Final demand prices rose 0.5 percent in April and edged down 0.1 percent in March. On an unadjusted basis, the final demand index increased 2.4 percent for the 12 months ended in May. Within final demand in May, a 0.3-percent increase in the index for final demand services offset a 0.5-percent decline in prices for final demand goods.
Final demand goods: Prices for final demand goods moved down 0.5 percent in May, the largest decrease since a 0.6-percent drop in February 2016. Most of the May decline can be attributed to the index for final demand energy, which fell 3.0 percent. In contrast, the index for final demand goods less foods and energy edged up 0.1 percent.
Product detail: The May decrease in the index for final demand goods was led by an 11.2-percent drop in gasoline prices. The indexes for fresh and dry vegetables, jet fuel, motor vehicles, and home heating oil also fell.
For the purpose of this report, we at SMU have extracted comparative statistics for sheet steel, aluminum and plastic products and truck and rail transportation. Table 1 is a summary of each category on a year over one, two and three year basis.
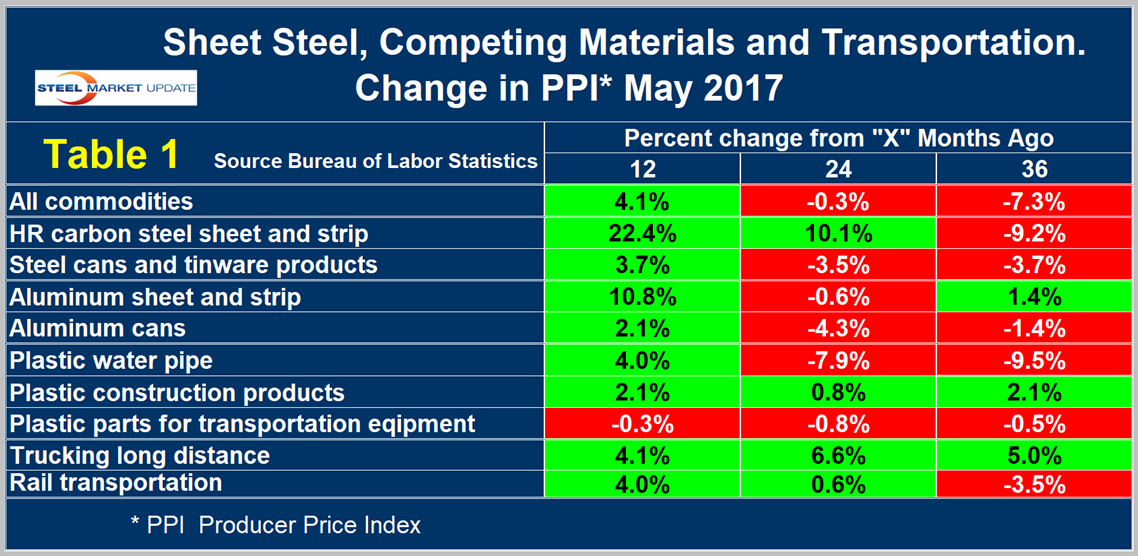
The gain/loss pattern as shown by the color codes in this latest update on a year-over-year basis is much better than in any of our reports since January 2015. Our analysis of the PPI data shows that commodity prices as a whole rose by 4.1 percent in 12 months through May, an improvement from the 7.3 percent decline in 36 months. If as expected the U.S. dollar rises during the balance of the year as the Fed raises interest rates, there will be downward pressure on commodity prices. It is evident from Table 1 that carbon steel sheet increased by much more than aluminum sheet at both the 12-month and 24-month levels, which was a recovery from the greater decline for steel at the 36-month level. The change in the PPI of steel and aluminum cans have been similar in the last 12 and 24 months. One of the items normally reported by the BLS is OCTG, but they have released no data for this commodity since February. Data for plastic pipe is current. We understand that steel dominates in most oil production and refining applications as plastic is used more often in distribution, mostly of natural gas, to end users. The PPI of plastic piping improved in the last year after declining in the previous two years. An analyst of Cleveland-based Freedom Group Inc., told AMM that plastic made significant inroads in oil and gas pipe applications in 2009 through 2012, but since then inroads have slowed. The PPI of plastic construction products and plastic parts for transportation equipment have been much more subdued than for steel in general, as a result of the stagnation in hydrocarbon feedstock prices.
Table 1 also shows price changes for truck and rail transportation and indicates that rail gained competitive advantage in the 24 and 36 month time frames, but in 12 months broke even with trucking.
The official description from the Bureau of Labor Statistics (BLS) reads as follows: The Producer Price Index is a family of indexes that measure the average change over time in the prices received by domestic producers of goods and services. PPIs measure price change from the perspective of the seller. This contrasts with other measures, such as the Consumer Price Index (CPI). CPIs measure price change from the purchaser’s perspective. Sellers’ and purchasers’ prices can differ due to government subsidies, sales and excise taxes, and distribution costs. More than 10,000 PPIs for individual products and groups of products are released each month. PPIs are available for the products of virtually every industry in the mining and manufacturing sectors of the U.S. economy. New PPIs are gradually being introduced for the products of industries in the construction, trade, finance, and services sectors of the economy. More than 100,000 price quotations per month are organized into three sets of PPIs: (1) Stage-of-processing indexes (2) commodity indexes, and (3) indexes for the net output of industries and their products. The stage-of processing structure organizes products by class of buyer and degree of fabrication. The commodity structure organizes products by similarity of end use or material composition. The entire output of various industries is sampled to derive price indexes for the net output of industries and their products.


