Product
February 25, 2013
SMU Price Momentum Indicator Enters 13th Week at Neutral
Written by John Packard
Split on Increase, Lead Times, Sentiment for Sideways Pricing – Market has Little Direction
Steel Market Update (SMU) continues to set a new record each week we hold our Price Momentum Indicator at Neutral. The longest previous record for a Neutral indication for market price direction was five weeks (back in late May/June 2011) for those who are keeping score. SMU is now entering our 13th consecutive week with our Price Momentum Indicator at Neutral – we are on shaky ground and a change could be coming soon – but for the moment we continued to remain at Neutral.
As you will see by the Comparison Price Indices article below, most of the indexes saw their price assessments for flat rolled steel move sideways or drift slightly lower this past week. We expect the same to be true in the next few weeks.
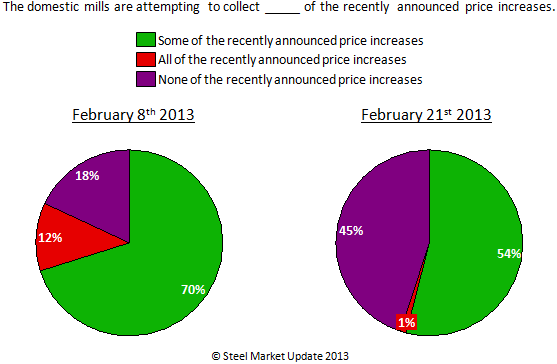
One of the reasons our Price Momentum Indicator continues to be stuck in Neutral can be found in the results of this past week’s steel survey. We found an almost even split within those responding to our survey as to those who reported paying some (or all) of the price increases (55 percent) versus those who were paying none of the increases (45 percent).
The reason why our Indicator did not revert to Higher after the price announcements can be seen when comparing the early February results to last week. The percentage of companies reporting paying some (or all) of the increase, dropped from 82 percent to 55 percent. SMU cannot move our indicator to Lower as there are still 55 percent who are reporting having paid more for their steel since the increase announcements were made. There is an obvious ongoing struggle which will be resolved when either demand improves (most likely through the reduction of inventories creating a need to purchase) or the supply/demand balance is disrupted through the removal of excess supply from the market.
At this point, SMU does not believe the $10 to $20 per gross ton increase forecast in scrap prices for March will be enough to move our Indicator off our Neutral toward Higher without further action affecting the supply/demand scenario.
On the other hand, the drift lower has broken through the $600 per ton level for benchmark hot rolled coil. It appears it is only North American excess supply which is driving HRC prices lower (imports cannot be blamed)- excess supply and the protection of markets from poaching.
We can see excess supply when we take a look at lead times. We showed you our charts in our last issue of SMU. We also capture the data in another more visual way for our members:
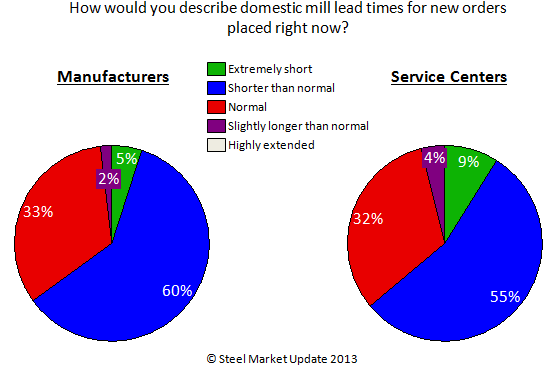
SMU needs to see the blue and green areas of these two pie charts shrink before our SMU Price Momentum Indicator can move in an optimistic way (for the domestic steel mills). At the moment, the data is leaning toward prices falling with the majority of both manufacturing companies and service centers reporting lead times as shorter than normal or worse- extremely short.
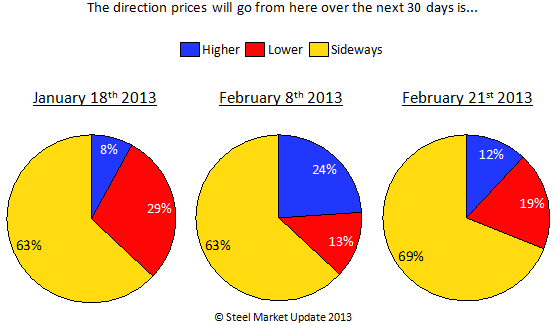
As to the steel community – it sees prices trending sideways over the next 30 days, according to our steel survey results from this past week: