

Product
August 22, 2013
Key Market Indicators August 23, 2013
Written by Peter Wright
An explanation of the Key Indicators concept is given at the end of this piece for those readers who are unfamiliar with it. The SMU Key Market Indicators and Analysis will become part of the new Premium membership when the new SMU website comes up in September.
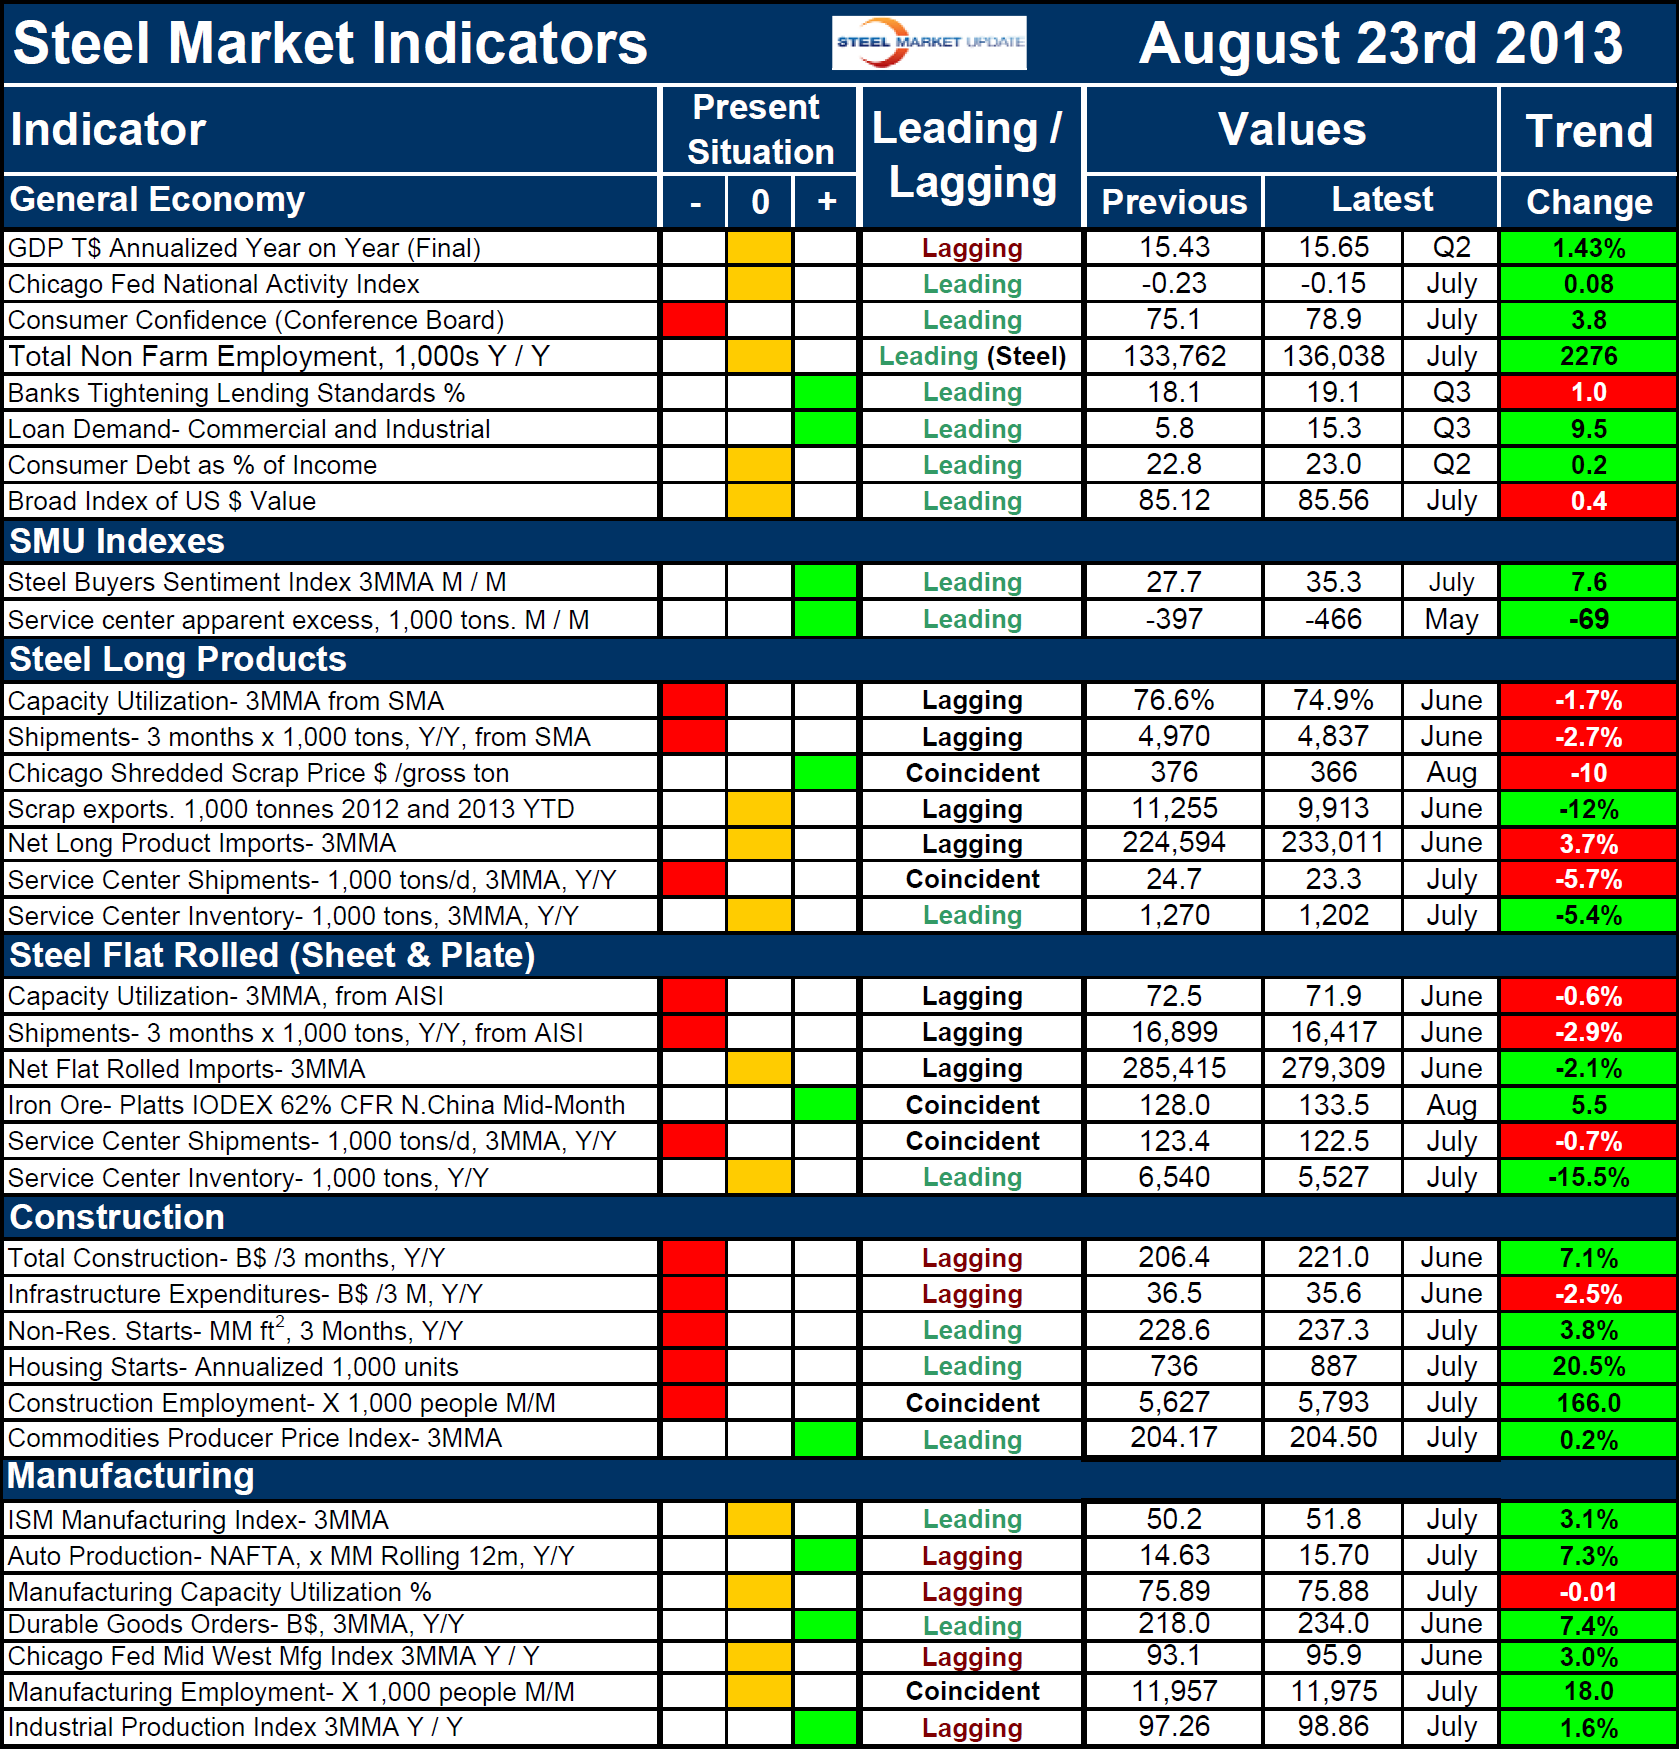
The total number of indicators considered at present is thirty six, an increase of one from last month when the Chicago Fed Mid Western Manufacturing Index was added. The present situation of ten of the indicators based on historical standards was positive on August 23rd and twelve were negative; the same as last month. The CFMWMI came in at neutral.
The present situation of the general economy is pretty much in a holding pattern with five indicators in neutral, two positive and one negative. Job creation moved returned to neutral from positive this month based on the number of part time jobs being reported by the Bureau of labor Statistics. Demand for commercial and industrial loans moved from neutral to positive.
The SMU buyer’s index and the SMU service center excess statistics are both currently positive by historical standards. Present situation indicators for long and flat steel products are essentially the same. All except one of the negative present situation indicators are in the steel and construction sectors. Even though the construction news is generally good the present situation of five of the six indicators is still negative. It is important to recognize that it will be close to 2020 before residential and non residential building construction recover and that’s based on an optimistic assumption that we don’t have another downturn before then. The volume of non residential, for example, is still lower than at any time since 1970 when our statistics began.
Manufacturing at present has evolved to the point where there are no negative present situation indicators, four of the indicators are OK by historical standards and three are positive.
The quantitative analysis of the value of each indicator over time is shown in the “Trend” column. At present trends are moving in the right direction. Twenty four of thirty six indicators are improving; this is a deterioration of two since the July update.
Six of eight indicators of the general economy are headed in the right direction. The Steel Market Update buyer’s sentiment index rose by 7.6 from mid July and the service center apparent deficit increased again, suggesting pent up demand that will have to be released sooner or later.
Flat rolled and long product steel indicators were essentially the same with a total of eight out of thirteen indicators moving in the wrong direction. Net imports of long products increased as flat products declined. Service center shipments and inventory declined for both product groups.
All of the construction indicators except infrastructure expenditures are improving as are all of the manufacturing indicators except capacity utilization which was only very slightly negative.
The key indicators analysis confirms our experience that the current market is not great but tells us that most trends which are quantified are still moving in the right direction. The trends specific to the steel market are believed to be negatively affected by political uncertainty and not representative of true demand at the end market level. We believe a continued examination of both the present situation and direction will be a valuable tool for corporate business planning.
Explanation:
The key indicators chart is designed to give a snapshot of the steel market on a specific date. The chart is stacked vertically to separate the primary indicators of the general economy, of proprietary Steel Market Update indices, of both flat rolled and long product market indicators and finally of construction and manufacturing indicators. The indicators are classified as leading, coincident or lagging as indicated.
Columns in the chart are designed to differentiate between the current situation and the direction in which the market is headed. The present situation is sub-divided into, below the historical norm (-), (OK), and above the historical norm (+). The “Values” section of the chart is a quantitative definition of the market’s direction. In cases where seasonality is an issue, the evaluation of market direction is made on a three month moving average basis and compared year over year to eliminate this effect. Where seasonality is not an issue concurrent periods are compared. The date of the latest data is identified in the third values column. Values will always be current as of the date of publication. Finally, the far right column quantifies the trend as a percentage or numerical change with color code classification to indicate positive or negative direction.


