Market Data

May 22, 2014
SMU Survey: Lead Times Stable
Written by John Packard
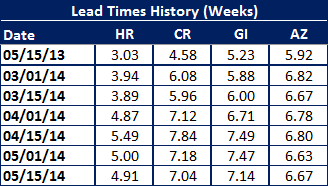
Steel mill lead times remained extended (or from a mill perspective, at reasonable levels) on all products. Benchmark hot rolled lead times averaged 4.91 weeks which is essentially unchanged from the 5.00 weeks reported at the beginning of May. Last year at this time HRC lead times averaged 3.03 weeks. We are running approximately 2 weeks longer lead times on hot rolled coil this year than last.
We are seeing similar results from the other three flat rolled products: cold rolled, galvanized and Galvalume.
Cold rolled lead times average 7.04 weeks according to those responding to this week’s steel market analysis. This is down only very slightly from the 7.18 weeks reported at the beginning of the month. Cold rolled lead times last year averaged 4.58 weeks in the middle of May or about 2.5 weeks less than where we are now.
Galvanized lead times were very close to those of cold rolled averaging 7.14 weeks, down from 7.47 weeks measured at the beginning of May. Last year lead times were approximately 2 weeks less than what we are seeing out of the domestic mills right now.
Galvalume lead times remained about the same as the beginning of the month at 6.67 weeks. Galvalume is one product where the lead times last year were relatively comparable to those being measured now. In mid-May 2013, Galvalume lead times averaged 5.92 weeks.
Lead times are based on the cumulative average of all of the responses received by manufacturing and service centers only. We do not take into consideration what the domestic mills are reporting to their customers.
Based on what we are seeing for lead times, SMU anticipates steel prices will remain “firm” at current levels. Even so, hot rolled lead times are about 0.5 weeks less than the peak of this cycle, cold rolled is 0.80 weeks less, galvanized 0.35 weeks while Galvalume remains close to the longest lead times reported this year.