Market Data
June 22, 2014
Mill Lead Times Stable to Extended
Written by John Packard
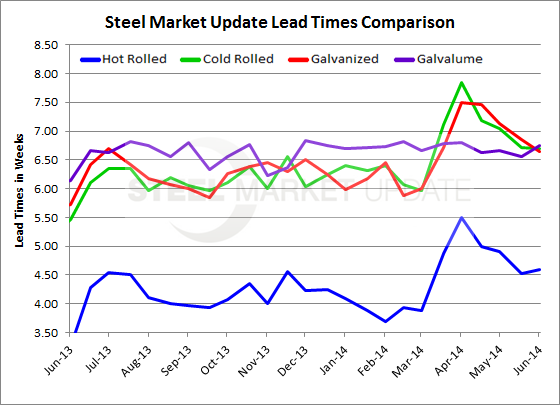
Flat rolled steel mill lead times continue to be extended compared to one year ago according to the results of the SMU steel survey completed late last week. Hot rolled lead times average 4.59 weeks, which is about the same as what was reported at the beginning of the month of June. One year ago HRC lead times were measured at 3.26 weeks. Hot rolled lead times peaked at 5.49 weeks in mid-April of this year.
Cold rolled lead times average 6.70 weeks, again about the same as earlier this month and well above the 5.46 weeks reported one year ago. The 6.70 weeks is about one week shorter than what we were seeing out of our survey during the months of April and May.
Galvanized lead times average 6.64 weeks, down slightly from the 6.86 weeks measured at the beginning of the month. Last year at this same point in the year, GI averaged 5.46 weeks. The lengthiest lead times we have seen this year was 7.84 weeks which was recorded during the middle of April.
Galvalume lead times extended slightly this past week and now average 6.75 weeks. This is very close to the mid-April 2014 peak of 6.80 weeks. Last year AZ lead times were reported as being 6.14 weeks.
With lead times stabilizing at historically (over the past few years) longer than normal levels has helped moderate the slide we had seen in pricing over the past few weeks (see lead time graph below).