

Market Data
July 31, 2014
GDP Q2 2014 First Estimate
Written by Peter Wright
On Wednesday this week the Bureau of Economic Analysis (BEA) released the advance estimate of Q2 2014 Annual Revision of the National Income and Product Accounts. In addition to the regular revision of estimates for the most recent 3 years and for the first quarter of 2014, GDP and select components were revised back to the first quarter of 1999. The total revision in GDP for the 15.25 years period from Q1 1999 through Q1 2014 was only $200B on $215T so overall very minor but there were substantial changes to individual quarters. Of most immediate note Q1 2014 was revised up from the “Final” evaluation of -2.96 percent to -2.1 percent and Q4 2013 was revised up from 2.6 percent to 3.5 percent. All exhibits in this report have been corrected back through 1999.
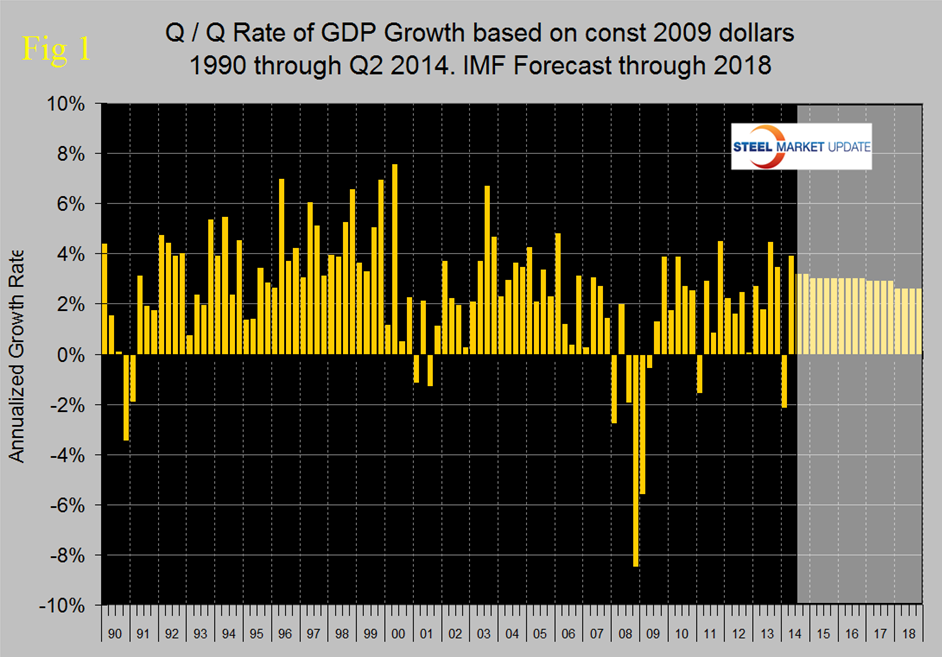 Figure 1 shows quarterly results since 1990 and the latest IMF forecast through 2018. The advance estimate for GDP growth in the second quarter was 3.89 percent, in line with Q3 and Q4 last year and indicating that the negative 1st Q result of -2.1 percent was an outlier resulting from severe winter weather, a major inventory swing and a deterioration in net exports. GDP in Q2 this year based on this first estimate was $15.986 trillion. Last week the IMF reduced its growth forecast for the US in 2014 to 1.7 percent down from the April estimate of 2.8 percent, (See below). Based on the upward revision of Q1 and the very healthy result for Q2, (assuming it holds) the IMF will no doubt raise their forecast.
Figure 2 shows the change in the major sub-components of GDP. We think it more useful to compare this latest result with Q4 last year and to ignore Q1. On that basis personal consumption which is running at 68.25 percent of GDP declined from 2.51 percent to 1.69 percent. Personal consumption includes goods and services, the goods portion of which includes both durable and non-durables.
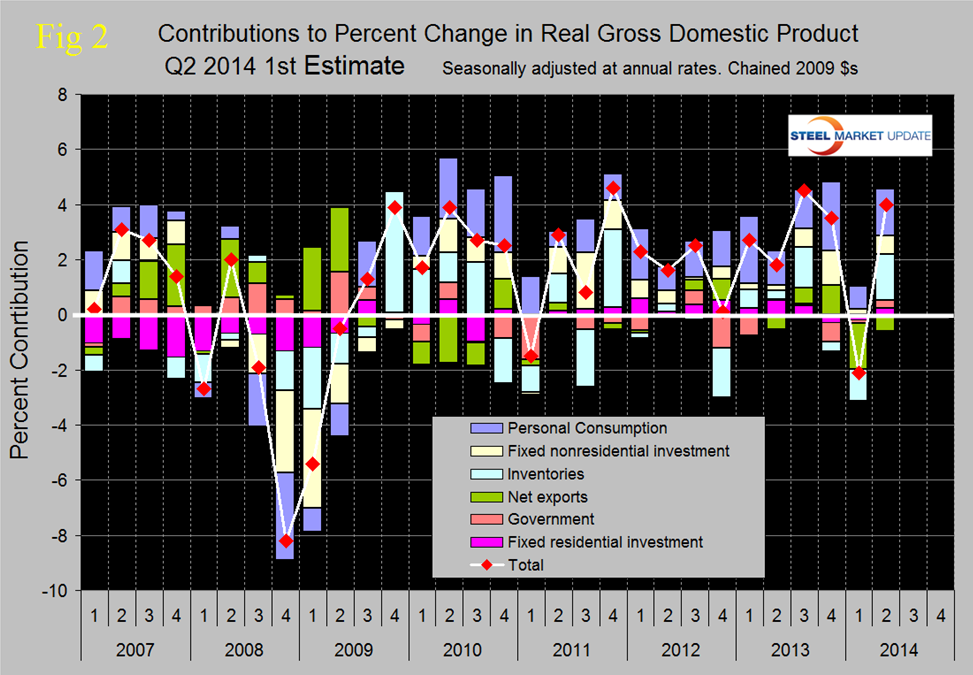
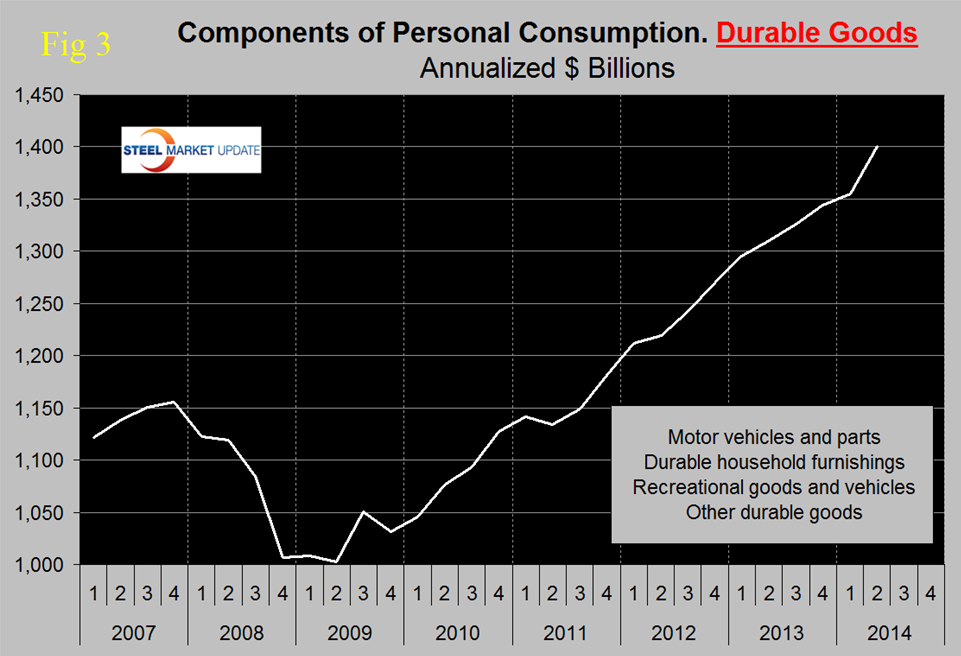
Figure 3 shows the growth of durable goods in the National Income and Product Accounts. Continuing with the comparison of Q4 2013 and Q2 2014, residential investment improved from a negative contribution of 0.28 percent to positive 0.23 percent which doesn’t seem to jive well with the Census Bureau statistics on housing starts. There was a huge swing in inventories from -0.34 percent to +1.66 percent. Increasing inventories has a positive contribution to GDP and as we explained last month over the long run inventory changes are a wash and simply move growth from one period to another. There were major swings in net exports and government comparing Q4 13 with Q2 14 as shown in Figure 2.
The official press release from the BEA reads as follows:
National Income and Product Accounts. Gross Domestic Product: Second quarter 2014 (Advance Estimate). Annual Revision: 1999 through First Quarter 2014
Real gross domestic product — the output of goods and services produced by labor and property located in the United States — increased at an annual rate of 4.0 percent in the second quarter of 2014, according to the “advance” estimate released by the Bureau of Economic Analysis. In the first quarter, real GDP decreased 2.1 percent (revised).
The Bureau emphasized that the second-quarter advance estimate released today is based on source data that are incomplete or subject to further revision by the source agency.
The increase in real GDP in the second quarter primarily reflected positive contributions from personal consumption expenditures (PCE), private inventory investment, exports, nonresidential fixed investment, state and local government spending, and residential fixed investment. Imports, which are a subtraction in the calculation of GDP, increased. Real GDP increased 4.0 percent in the second quarter, after decreasing 2.1 percent in the first.
This upturn in the percent change in real GDP primarily reflected upturns in private inventory investment and in exports, an acceleration in PCE, an upturn in state and local government spending, an acceleration in nonresidential fixed investment, and an upturn in residential fixed investment that were partly offset by an acceleration in imports.
The price index for gross domestic purchases, which measures prices paid by U.S. residents, increased 1.9 percent in the second quarter, compared with an increase of 1.4 percent in the first. Excluding food and energy prices, the price index for gross domestic purchases increased 1.7 percent, compared with an increase of 1.3 percent.
Real personal consumption expenditures increased 2.5 percent in the second quarter, compared with an increase of 1.2 percent in the first. Durable goods increased 14.0 percent, compared with an increase of 3.2 percent. Nondurable goods increased 2.5 percent; it was unchanged in the first quarter.
Services increased 0.7 percent in the second quarter, compared with an increase of 1.3 percent in the first.
Real nonresidential fixed investment increased 5.5 percent in the second quarter, compared with an increase of 1.6 percent in the first. Investment in nonresidential structures increased 5.3 percent, compared with an increase of 2.9 percent.
Investment in equipment increased 7.0 percent, in contrast to a decrease of 1.0 percent. Investment in intellectual property products increased 3.5 percent, compared with an increase of 4.6 percent. Real residential fixed investment increased 7.5 percent, in contrast to a decrease of 5.3 percent.
Real exports of goods and services increased 9.5 percent in the second quarter, in contrast to a decrease of 9.2 percent in the first. Real imports of goods and services increased 11.7 percent, compared with an increase of 2.2 percent.
Real federal government consumption expenditures and gross investment decreased 0.8 percent in the second quarter, compared with a decrease of 0.1 percent in the first. National defense increased 1.1 percent, in contrast to a decrease of 4.0 percent. Non-defense decreased 3.7 percent, in contrast to an increase of 6.6 percent. Real state and local government consumption expenditures and gross investment increased 3.1 percent, in contrast to a decrease of 1.3 percent.
The change in real private inventories added 1.66 percentage points to the second-quarter change in real GDP after subtracting 1.16 percentage points from the first-quarter change. Private businesses increased inventories $93.4 billion in the second quarter, following increases of $35.2 billion in the first quarter and $81.8 billion in the fourth quarter of 2013.
Real final sales of domestic product — GDP less change in private inventories — increased 2.3 percent in the second quarter, in contrast to a decrease of 1.0 percent in the first.
On July 23rd (before the latest BEA revisions) the IMF published the following review of the US economy:
IMF Executive Board Concludes 2014 Article IV Consultation with the United States
Economic activity in the U.S. accelerated in the second half of 2013, but an unusually harsh winter conspired with other factors—including an inventory correction, a still-struggling housing market, and slower external demand—caused momentum to fade in early 2014, leading to a contraction in growth of 2.9 percent in the first quarter.
Over the past few months, however, a broad-based improvement appears to be unfolding as evidenced by stronger employment and industrial production numbers. Looking ahead, activity is projected to accelerate in the remainder of this year to well-above potential (in the 3–3½ percent range), although the drag on growth from the first quarter contraction will not be offset. This means growth for the year as a whole will be a disappointing 1.7 percent. More positively, barring unforeseen shocks, 2015 growth should accelerate to the fastest annual pace since 2005, propelled by strong consumption growth, a declining fiscal drag, a pickup in residential investment, and easy financial conditions.
Risks around this outlook include slowing growth in emerging markets, oil price spikes related to events in Ukraine and Iraq, and earlier-than-expected interest rate rises. However, as confidence in the recovery picks up, nonresidential investment could grow more than expected and labor force participation could bounce back.
Looking at the medium term, potential growth is forecast to average just above 2 percent for the next several years, significantly below the historic average growth rate. This downgrade reflects the effects of an aging population and more modest prospects for productivity growth. This makes it critical for the authorities to take immediate steps to raise productivity, encourage innovation, augment human and physical capital, and increase labor force participation. Moreover, recent growth has not been particularly inclusive, with the latest data pointing to almost 50 million Americans living in poverty (as shown by the Census Bureau’s supplemental poverty measure) and the official poverty rate stuck above 15 percent despite the ongoing recovery. In terms of policy actions, the Federal Reserve has made important and substantive efforts to increase transparency and has adopted an adaptable approach to communication. The recent shift to qualitative forward guidance provides the Fed with greater flexibility but puts an even higher premium on clear and systematic communication to guide expectations. On the fiscal side, following the debt ceiling brinkmanship and the government shutdown in October 2013, the Bipartisan Budget Act and the subsequent raising of the debt ceiling were important steps to reduce fiscal risks. However, the need for a medium-term fiscal adjustment to ensure a downward path for the public debt remains. On the financial side, progress has been achieved on variety of fronts, including implementing the Dodd Frank Act, finalizing the Volcker rule, and designating another systemic important financial institution. In addition, the U.S. recently put in place a rule to require foreign bank organizations over a certain size to incorporate as holding companies, a move that aligns the treatment of foreign and U.S. banks that are operating in the U.S. and eliminates an existing regulatory distortion.
SMU Comment: We have reported frequently in the past on the relationship between GDP and steel consumption. Steel growth follows economic growth but is very much more volatile. In addition about a 2.5 percent growth of GDP is necessary to get any growth in steel consumption. The advance report for Q2 2014 and the revisions to the 2nd half of 2013 data are very encouraging in terms of steel consumption because all three data points were well above the 2.5 percent threshold.


