Prices

January 13, 2015
Net Imports of Sheet Products through November 2014
Written by Brett Linton
This is another article which generally goes strictly to our Premium level members. Steel Market Update looks at data in a number of different ways. We look at imports on a weekly basis and report on the trends for license data, we look at monthly data and how it relates to the prior month and previous year and we look at the data from an annual basis. For our Premium customers we take the time to evaluate imports and exports on a three month moving average. We feel this provides a more detailed or “real” picture as to what is happening which can then be compared with other time periods. The bottom line is we are trying to provide our Premium members the best data possible on trade and its impact on demand at the steel mills.
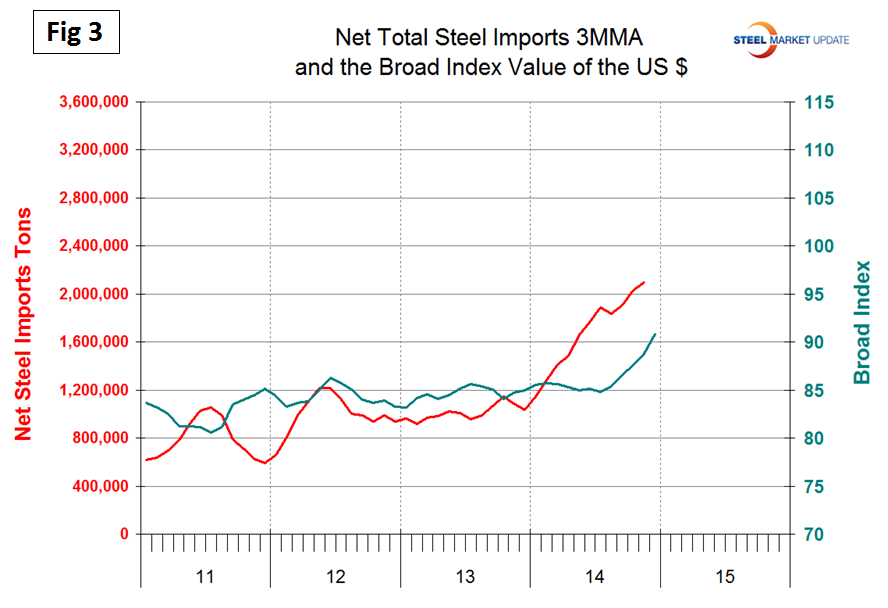
Net imports equals imports minus exports. We regard this as an important look at the overall trade picture and its effect on demand at the mill level. Figure 1 shows that net sheet product imports on a three month moving average, (3MMA) basis increased in November to a level double that which existed before the recession. The deterioration in net was almost entirely an import effect, exports have been fairly consistent though drifting down slightly since Q2 2012.
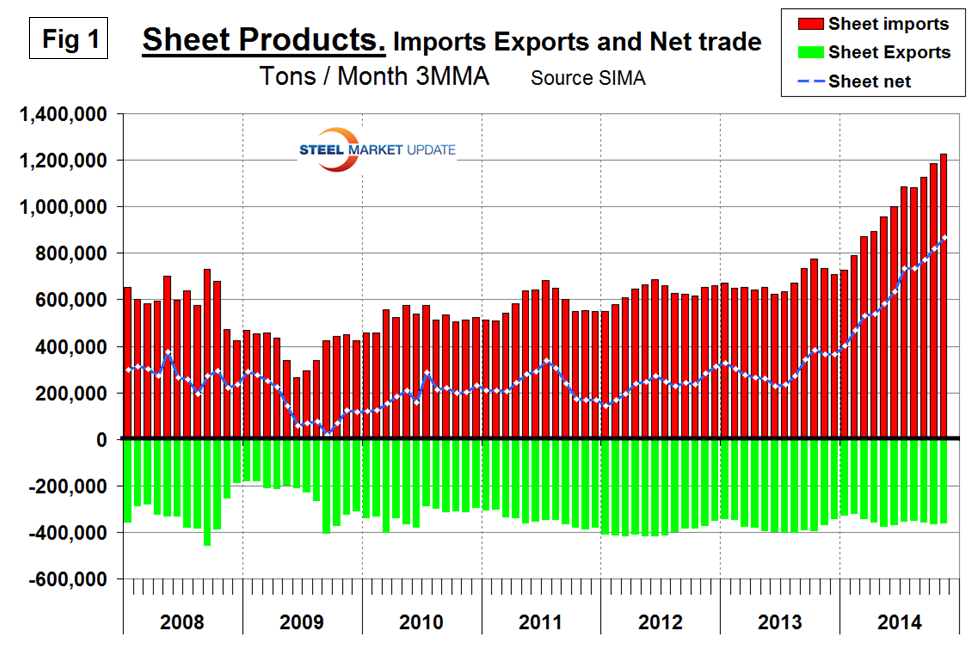
Table 1 shows net imports by product. Year to date through November, total net flat rolled imports were 9,354,635 tons of which 7,586,392 tons were sheet products. Net sheet imports more than doubled year over year being up by 4,320,852 tons. Net imports increased on all products except rail which were down slightly. Electro-galvanized was the only product to have a trade surplus in 2013 and 2014 year to date but this surplus declined in 2014. In Table 1 negative net imports, (which means a trade surplus) are shown in green.
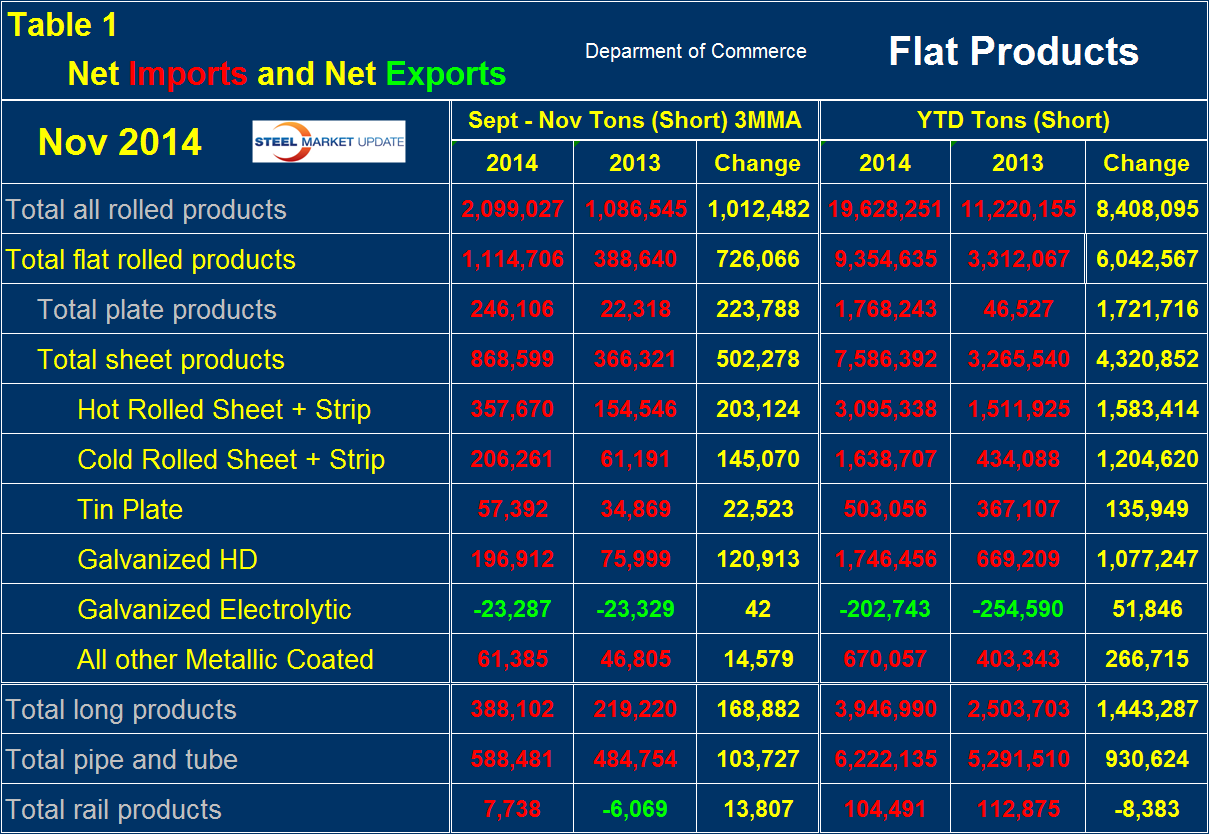
Figure 2 shows the trend of monthly net sheet product imports since January 2011 on a 3MMA basis. Hot rolled, cold rolled and HDG have increased strongly this year and are far higher than at any time since we began this analysis in January 2011. The trade surplus of electro-galvanized has recovered slightly in the last five months after contracting since late 2011.
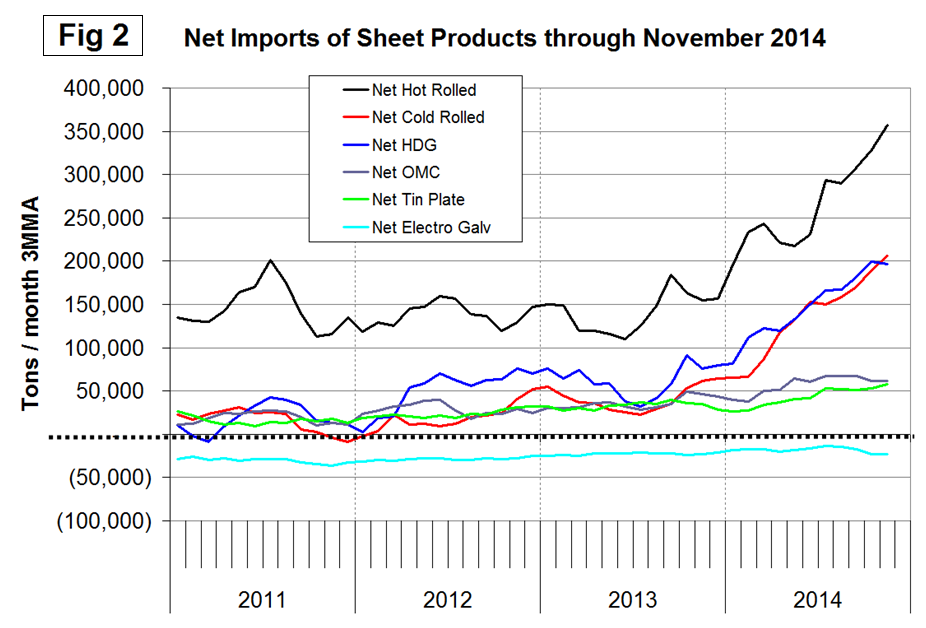
We believe there are two main drivers of the increase in net steel imports. The trade weighted value of the US $ is strengthening which makes our exports less attractive to foreign buyers and makes the US domestic market more attractive to foreign sellers. Figure 3 shows the relationship between net imports and the value of the $ since January 2011. The strengthening of the dollar is not expected to slow in the immediate future especially is the Fed raises interest rates in the course of 2015. The second reason is that steel demand in the US is increasing at the same time as global demand growth has flattened. In the period September through November on a year over year basis, the growth of global steel demand was zero. Since mid-2010, as Global steel capacity has increased, capacity utilization has decreased and now stands at 75 percent. The anticipated China problem is materializing as China’s total steel exports are approaching total US steel production.