

Analysis

March 3, 2015
Construction Expenditures (CPIP) Through January 2015
Written by Peter Wright
The following article is normally produced just for our Premium level members. We are sharing the information today with all of our readers. The article is written by Peter Wright, consultant to Steel Market Update, Gerdau and the State of Wyoming. Peter, who is a metallurgist as well as market specialist, is also one of our Steel 101 instructors. Our next program will be in the Chicago area on May 19 & 20th and will include a tour of the NLMK Indiana steel mill.
![]() Each month the Commerce Department issues its Construction Put in Place (CPIP) data, usually on the first working day covering activity two months earlier. January data was released on March 2nd.
Each month the Commerce Department issues its Construction Put in Place (CPIP) data, usually on the first working day covering activity two months earlier. January data was released on March 2nd.
Construction put in place is based on spending work as it occurs, estimated for a given month from a sample of projects. In effect, the value of a project is spread out from the project’s start to its completion. Construction starts data published by the Commerce Department for residential construction and by McGraw Hill/Dodge and Reed Construction for non-residential is completely different as in these cases the whole project is entered to the data base when ground is broken. The official CPIP press report gives no appreciation of trends on a historical basis and merely compares the current month with the previous one on a seasonally adjusted basis. The detail is hidden in the published data tables which we at SMU compile to provide a long term perspective. Our intent is to provide a route map for those subscribers who are dependent on this industry to “Follow the money.” This is a very broad and complex subject, therefore, to make this monthly write up more comprehensible, we are keeping the information format as consistent as possible.
Total Construction: Data is reported on both a seasonally adjusted and non-adjusted basis. In the SMU analysis we consider only the non-seasonally adjusted data and remove seasonality by the consideration of year over year (y/y) data. We also focus on rolling 3 and 12 months to remove the noise in single month numbers. Please note that the official news release from the Commerce Department may at first glance seem to conflict with the SMU analyses. This is because the government commentary is based on seasonally adjusted numbers.
January expenditures were $67.298 billion which breaks down to $50.131 B of private work, $15.625 B of state and locally, (S&L) funded work and $1.542 B of federally funded, (Table 1).
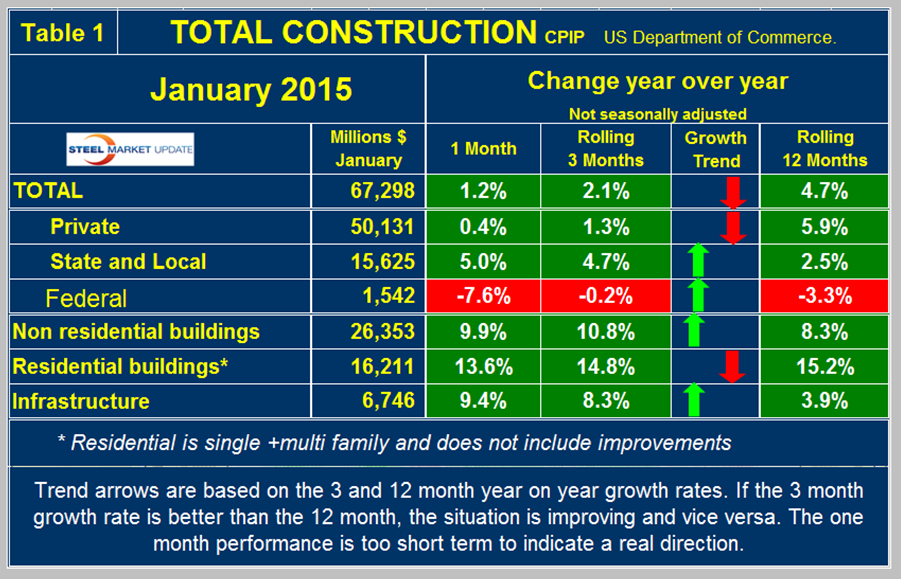
On a rolling three month basis, year over year total construction was up by 2.1 percent; the growth rate has declined on this basis every month since February last year when it was 9.6 percent. On a rolling 12 month basis, y/y total construction was up by 4.7 percent; this measure has decreased every month since June last year when it was 7.4 percent. Total construction growth is decelerating since the short term growth (3 months 2.1 percent) is less than the long term (12 months 4.7 percent). We report this as negative momentum. Note this is not a seasonal effect because our y/y analysis removes seasonality. Private work had negative momentum in January but state and local and federal momentum was positive. Federally funded construction continues to contract being down by 0.2 percent in three months through January, but this contraction is slowing. We consider three sectors within total construction. These are non-residential, residential and infrastructure. On a rolling three month basis y/y non-residential is growing at 10.8 percent and accelerating. Residential is growing at 14.8 percent and slowing. Infrastructure grew 8.3 percent y/y and accelerated in the last three months and has had positive momentum for the last five months. The growth of total construction improved from December through June but has been slowing since June as shown by the brown bars in Figure 1.
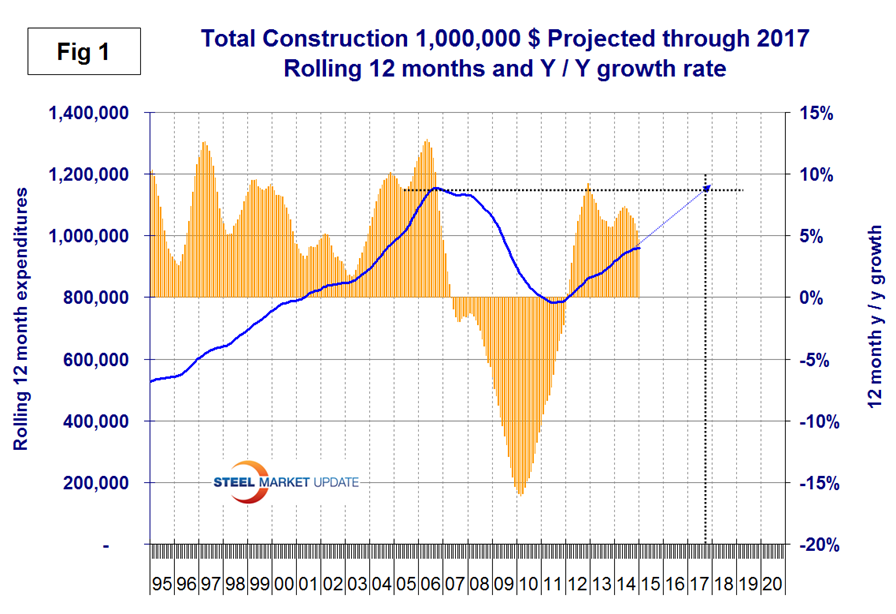
The trajectory of total annual expenditures has flattened slightly as shown by the blue line and we must now begin to question whether recovery to the previous peak will occur in 2017 as we had previously anticipated. The pre-recession peak of total construction on a rolling 12 month basis was $1,145 B in 12 months through February 2007. The low point was $768 B in 12 months through May 2011. The 12 month total through the latest data of January 2015 was $961.102 B (just short of one trillion dollars.)
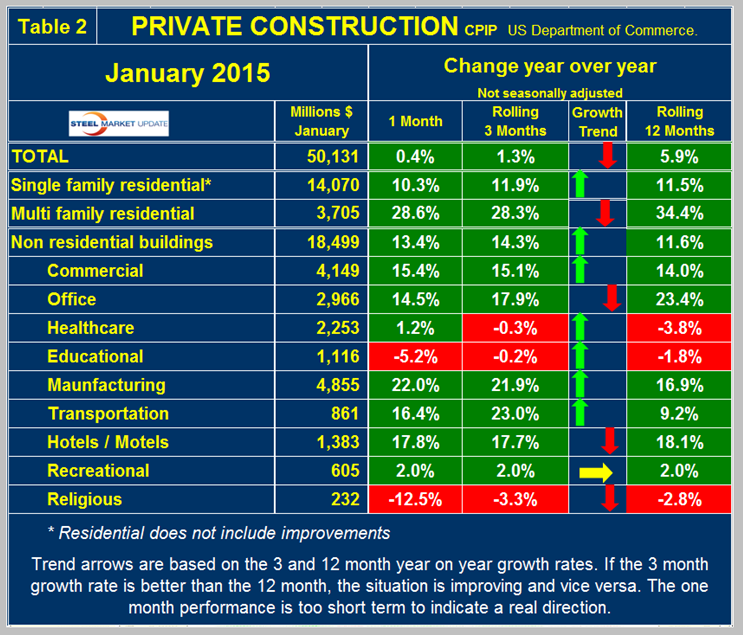
Private Construction: In the January CPIP data, the growth rate of private work slowed for the eleventh straight month from 14.4 percent in February 2014 to 1.3 percent in January 2015, (Table 2).
On a rolling 12 month basis, the growth rate of private construction has slowed every month since May last year as shown by the brown bars in Figure 2.
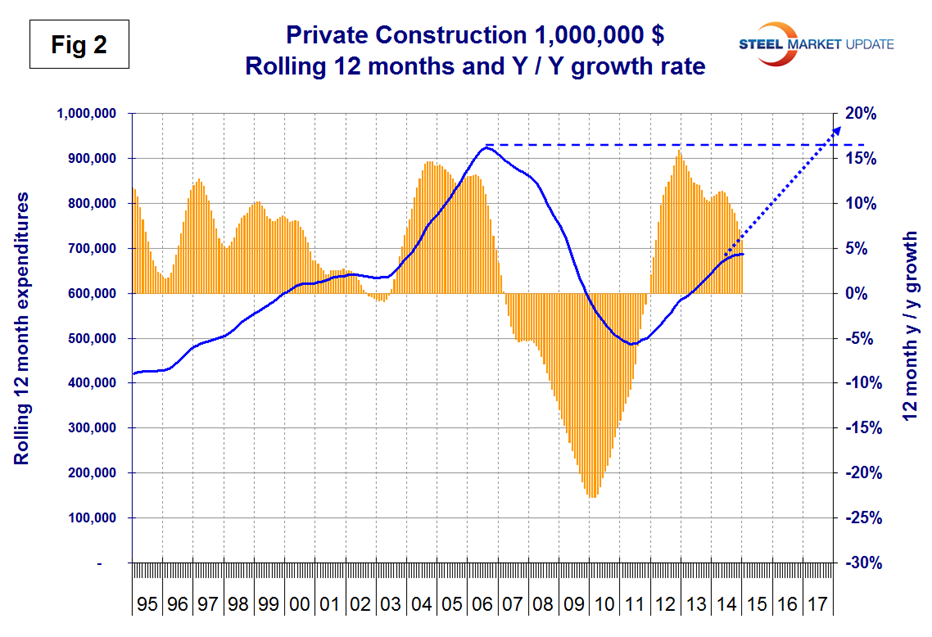
We had been projecting a full recovery of private construction sometime in 2017 but this is slipping. Table 2 breaks down the private sector into project types. A careful look at the numbers in Table 2 might suggest there is an error because the growth of total construction at 1.3 percent looks nothing like the aggregate of the individual project types. This is because the top line of $50.131 B includes residential improvements which are not included lower down in the table. In fact total residential expenditures fell by 3.5 percent when improvements are taken into account which we don’t think is very helpful from the point of view of steel analysis. Excluding improvements, our report shows that for residential buildings, both single and multi-family still have strong y/y growth but the momentum of each is different. Single family continues to have a small positive momentum but multi-family is slowing. The single family expenditures reported here have a rate of growth more than twice that of single family starts reported by the Census Bureau which have starts growing at 5.6 percent. The discrepancy in multi-family is very much greater. In this CPIP report multi-family is growing at 28.3 percent as the multifamily housing starts data shows a collapse to 2.2 percent. Note that the housing data is starts in which the total project cost is entered in the single month of groundbreaking. This suggests that the CPIP data for multi-family will also decline strongly in 2015. Private non-residential buildings grew at a 14.3 percent rate in three months through January y/y with a positive momentum. Within private non-residential, only health care, education and religious buildings had negative y/y growth on a rolling three months basis. Offices, manufacturing, hotels/motels, transportation and commercial continued to have strong year over year growth in three months through January. In over 10 years since mid-2004, religious buildings have achieved positive growth in only six of those months and in that time period expenditures have declined from $8.6 B on a rolling 12 months basis to $3.5 B in 2014.
State and Local Construction: S&L work expanded by 4.7 percent in the rolling three months through January y/y. (Table 3).
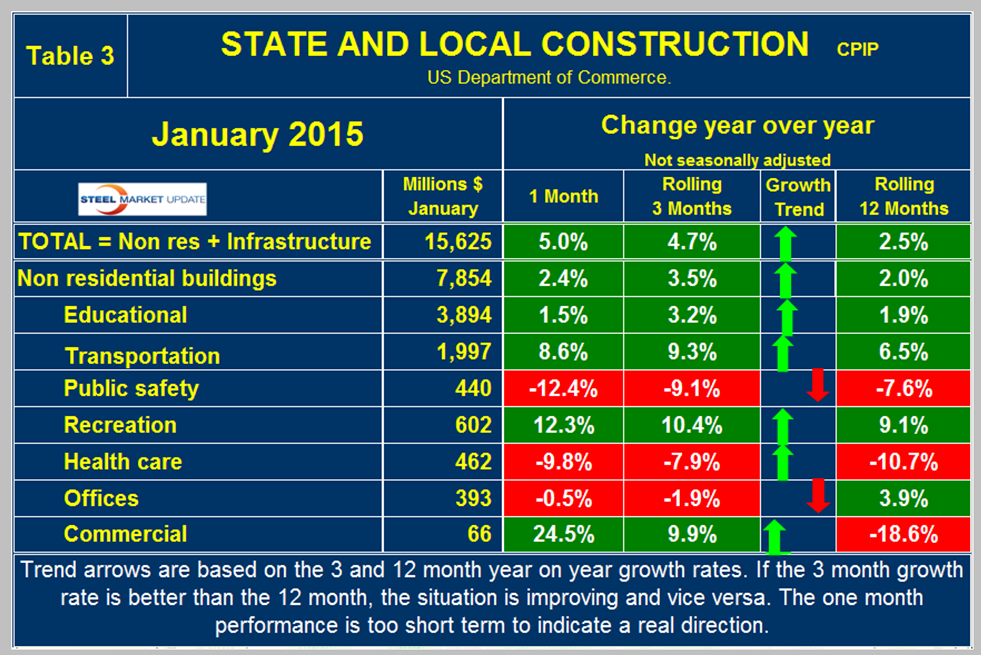
This was the ninth consecutive month of positive y/y growth on a rolling three months basis, the first time that has happened in four years and momentum is positive as indicated by the three month growth rate being higher than the twelve month. Figure 3, which is on a rolling 12 months basis, shows six consecutive months of positive growth after 54 months of contraction.
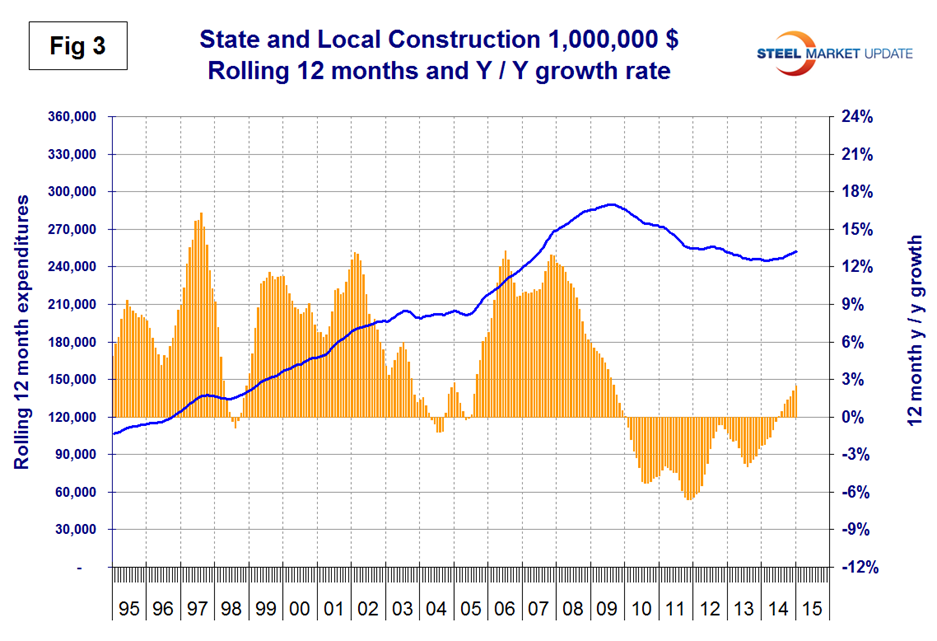
S&L non-residential building grew by 3.5 percent in three months through January y/y, and momentum continues to be positive. It looks as though state and local governments are beginning to loosen the purse strings as far as construction is concerned. Educational buildings are about 75 percent funded by state and local governments and are by far the largest sub sector of S&L non-residential at $3.9 billion in January. State and locally funded educational building construction expanded by 3.2 percent in three months through January. Recreational buildings have accelerated markedly in the last five months and grew by 10.4 percent in the latest data. Transportation terminals continue to do well with double digit y/y growth. Public safety buildings which includes jails, police and fire stations have had negative growth for 26 straight months on a rolling 3 months basis y/y. Comparing Figures Two and Three it can be seen that S&L construction did not decline proportionately as much as private work during the recession. Many state and local governments are still far from healthy, as increased revenues have been more than offset by increased future obligations, including the need to replenish reserve and rainy-day funds and to service defined benefit liabilities, pensions and Medicaid foremost. In spite of these limitations S&L construction have begun what will be a very long period of recovery to pre-recession levels.
Drilling down into the private and S&L sectors as presented in Tables 2 and 3 shows which project types should be targeted for steel sales and which should be avoided. There are some project types within S&L that are doing quite well but there are also major regional differences to be considered.
Infrastructure: expenditures have had positive growth in each of the last seventeen months through January on a rolling 3 months basis with a + 8.3 percent result in the latest data. The growth in 3 months is stronger than that in 12 months meaning that momentum is positive and presumably is a result of the temporary resolution of highway trust fund issue. Highway and streets including pavement and bridges accounts for about 2/3 of total infrastructure expenditures and have had positive growth for the last fourteen months, (Table 4).
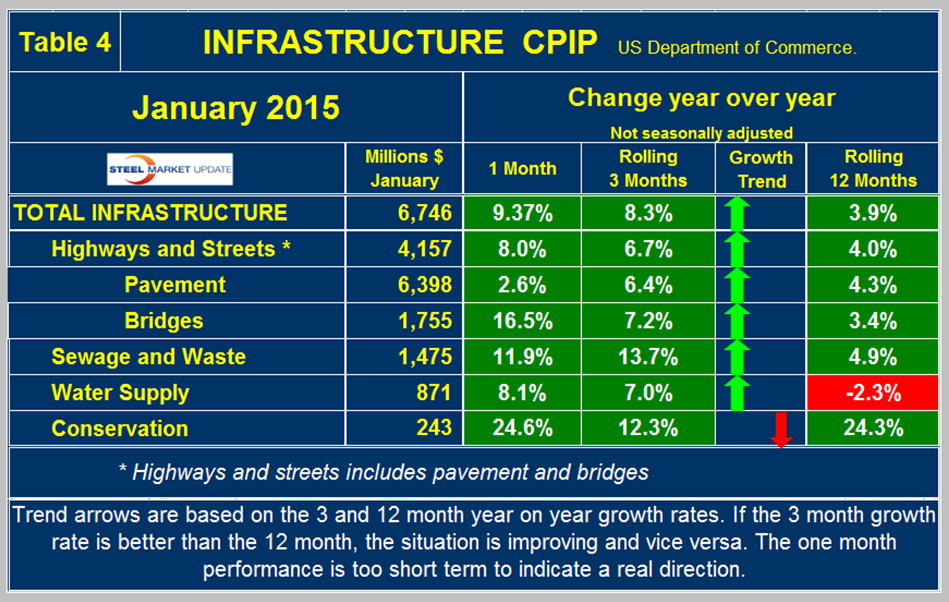
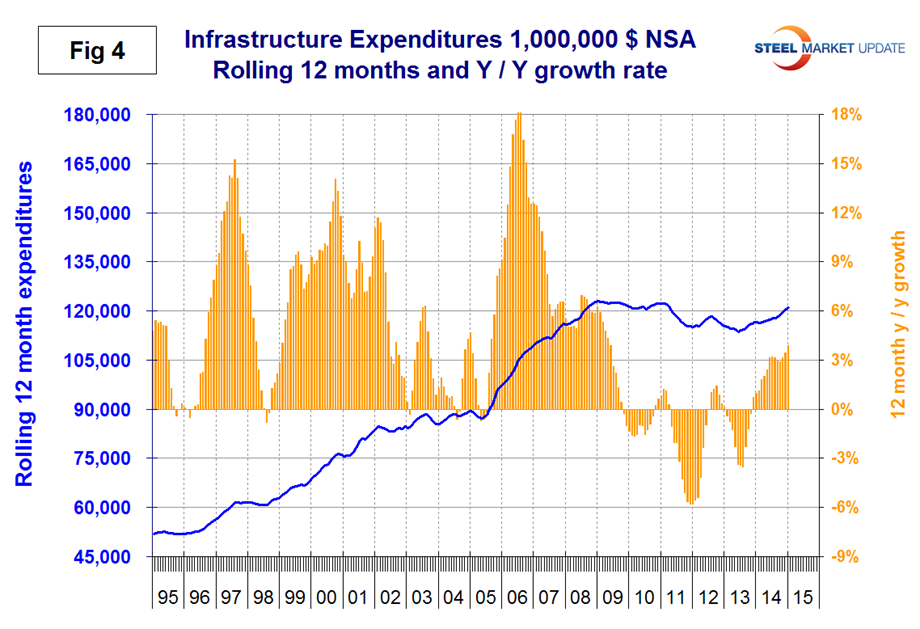
Highway pavement is the main sub-component of highways and streets and it has had positive growth for the last nine months. Bridge work has also expanded for the last nine months y/y and totaled 6.5 B in three months through January. In 2014, total expenditures on bridges was $29.5 B which was over three times the expenditures in 2000. This doesn’t seem to support the much publicized view of the proportion of unsafe bridges in the country. Water supply was up by 7.7 percent in three months through January and has positive momentum. This sector contracted for nine months from December 2013 through August 2014 and has steadily improved since last August. Conservation expenditures have been surging since November 2013 but the outlays are relatively small. On a rolling 12 month basis, infrastructure expenditures are about where they were four years ago, and have expanded for 14 straight months, (Figure 4).
You can learn more about other products which are produced for our Premium level members on our website. If you have any questions or would like to upgrade your account please contact Diana in our office: 800-432-3475 or Diana@SteelMarketUpdate.com.


