

Market Data

May 27, 2015
Consumer Confidence Trend Analysis Through May
Written by Peter Wright
The consumer confidence index as reported by the Conference Board rose one point in May to 95.4 as April was revised downwards by one point. The composite value combines the view of the present situation and expectations. The view of the present situation rose from 105.1 to 108.1 as expectations fell slightly from 87.1 to 86.9.
The three month moving average (3MMA) of the composite declined from 98.1 to 97.0 and it looks now as though the result of the 3MMA for March at 101.3 was an outlier. In which case the 3MMA will decline again in June when the March value is dropped from the calculation. The 3MMA of both the present situation and expectations are currently above the five year trend line (Figure 1).
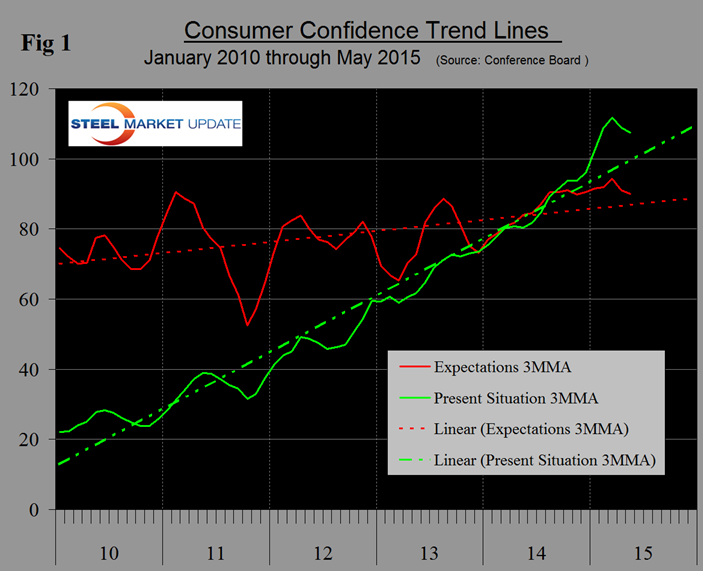
The April and May decline in the 3MMA of the composite followed 15 straight months of increase. The 3MMA of the composite at 97.0 is well above the 35 year average which stands at 90.6 since 1980. The historical pattern of the 3MMA of the composite, the view of the present situation and expectations are shown in Figure 2.
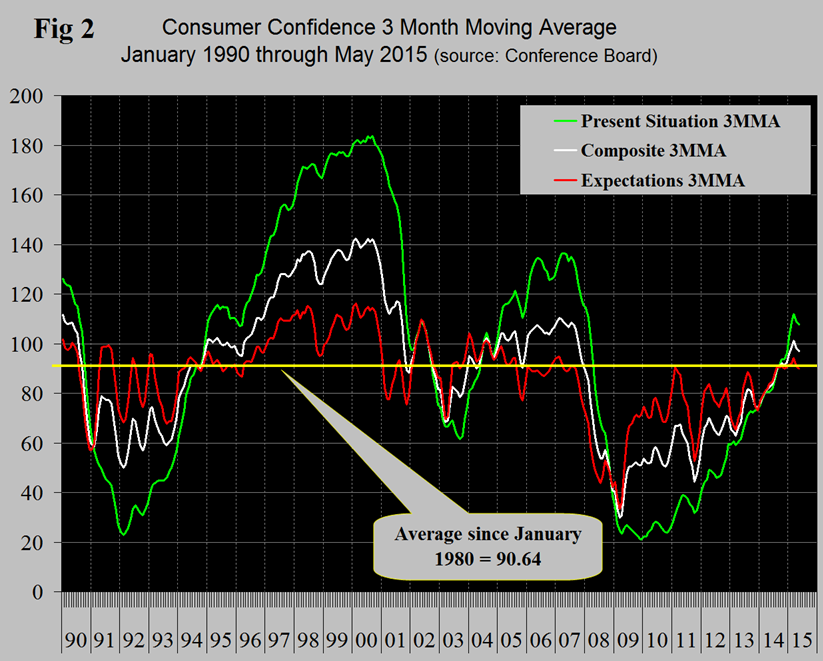
The recovery of the composite is now looking better than the turn around after the recession in 2003. The present situation component has been much more volatile over each multi-year time span than expectations since our data began 35 years ago with higher highs and lower lows. The view of the present situation moved ahead of that for expectations in October last year for the first time since the recovery began in 2009. If history repeats itself, the view of the present situation will continue to move ahead and widen the differential between it and expectations. On a year over year basis, using a 3MMA, the composite is up by 14.4 led by consumer’s view of the present situation which is up by 27.1 (Table 1 2014 and Table 1 2015).
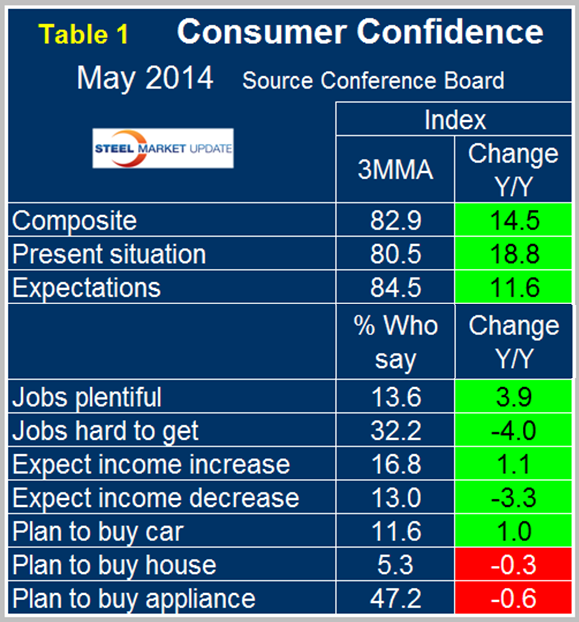
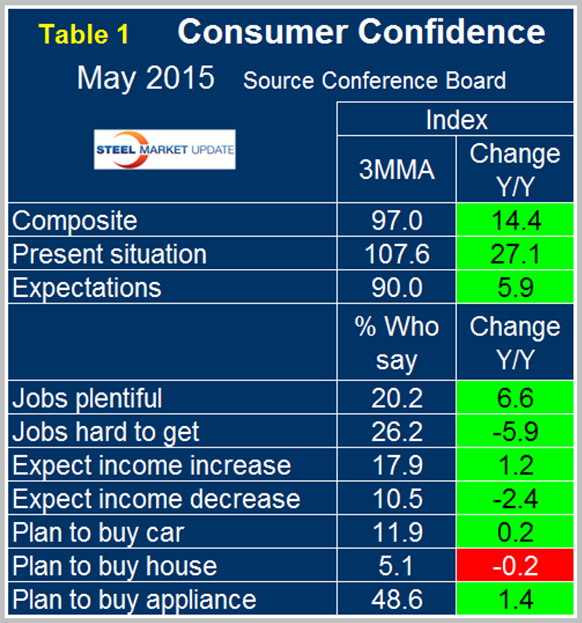
This month for the first time we have included two versions of Table 1, which are 12 months apart, to give readers a better idea of how each of the sub components have changed. The four employment sub-indexes which describe job availability and wage expectations have all strengthened in the last year as indicated by the color code green. The trends for auto and home purchase have not changed in the last year being positive and negative respectively. Year over year intentions to buy an appliance have improved from negative 0.6 to positive 1.4. Comparing the short term trend April to May, the direction of auto purchase intentions reversed course from negative 0.7 in April to positive 0.2 in May. The trends of home and appliance purchase were unchanged at negative and positive respectively. Overall, the first five months of the Conference Board index for 2015 had the best performance since Q3 2007. Consumer sentiment is being positively influenced by the job market but seems to be less influenced by lower gasoline prices and consequent improvement in disposable income than was expected by economists. It may be that consumers reading all the disturbing news out of the Middle East, don’t believe the current gas price is realistic and expect it to revert to the year ago level. The results in this report do not conflict with the poor results for residential housing starts.
The official statement from the Conference Board which considers only month over month changes reads as follows:
The Conference Board Consumer Confidence Index Increases
The monthly Consumer Confidence Survey, based on a probability-design random sample, is conducted for The Conference Board by Nielsen, a leading global provider of information and analytics around what consumers buy and watch. The cutoff date for the preliminary results was May 15.
“Consumer confidence improved modestly in May, after declining sharply in April,” said Lynn Franco, Director of Economic Indicators at The Conference Board. “After a three-month slide, the Present Situation Index increased, propelled by a more positive assessment of the labor market. Expectations, however, were relatively flat following a steep decline in April. While current conditions in the second quarter appear to be improving, consumers still remain cautious about the short-term outlook.”
Consumers’ assessment of current-day conditions improved in May. Those saying business conditions are “good” edged down from 25.5 percent to 25.2 percent. However, those claiming business conditions are “bad” also decreased from 19.2 percent to 17.4 percent. Consumers were mixed in their assessment of the job market. Those stating jobs are “plentiful” increased from 19.0 percent to 20.7 percent, while those claiming jobs are “hard to get” rose from 25.9 percent to 27.3 percent.
Consumers’ optimism about the short-term outlook edged down in May. The percentage of consumers expecting business conditions to improve over the next six months inched up from 15.4 percent to 15.6 percent, while those expecting business conditions to worsen also increased, from 9.1 percent to 10.8 percent. Consumers’ outlook for the labor market, however, improved. Those anticipating more jobs in the months ahead increased from 13.8 percent to 14.6 percent, while those anticipating fewer jobs declined from 16.4 percent to 15.5 percent. The proportion of consumers expecting growth in their incomes was unchanged at 17.4 percent, while the proportion expecting a decline increased slightly from 10.8 percent to 11.1 percent.
About The Conference Board
The Conference Board is a global, independent business membership and research association working in the public interest. Our mission is unique: To provide the world’s leading organizations with the practical knowledge they need to improve their performance and better serve society. The Conference Board is a non-advocacy, not-for-profit entity holding 501 (c) (3) tax-exempt status in the United States.


