Market Data

August 2, 2015
July Steel Data at a Glance
Written by John Packard
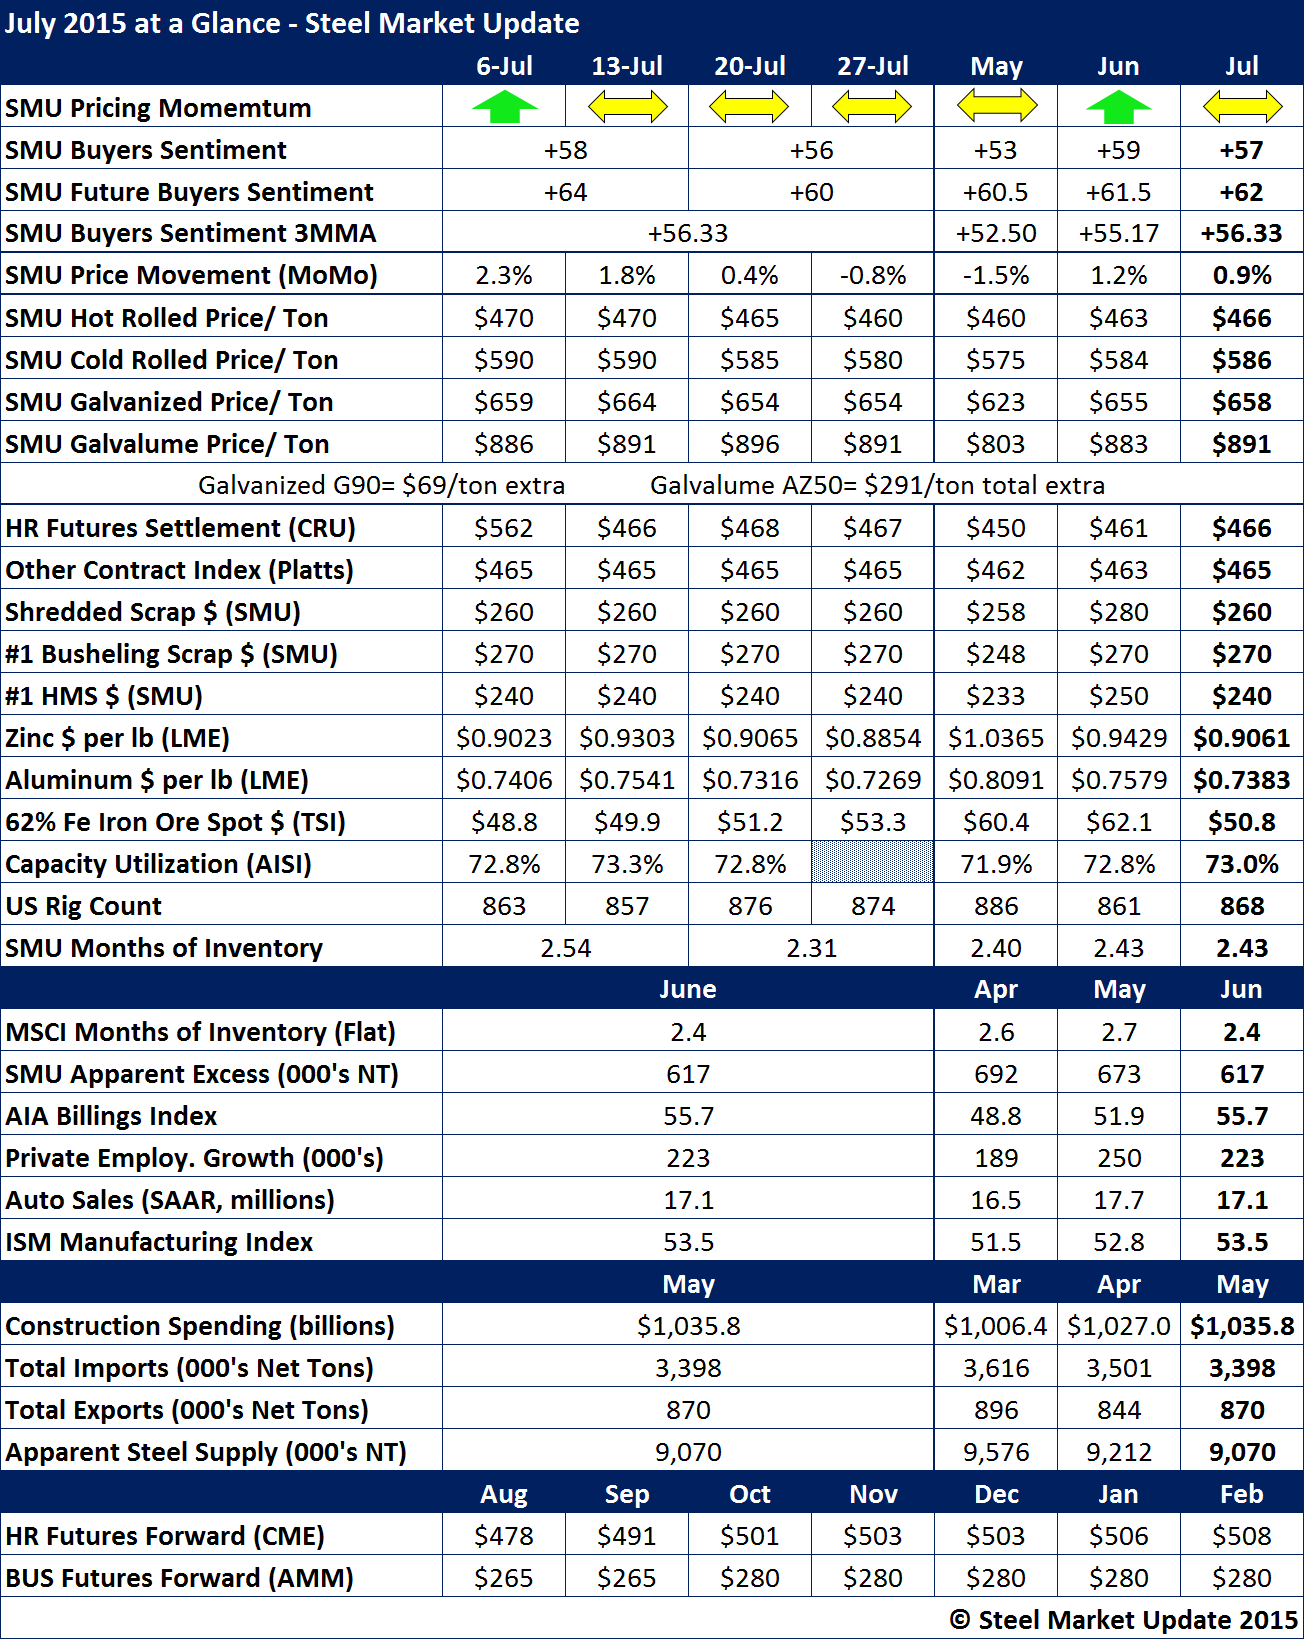
Flat rolled steel prices, and the momentum associated with steel price movement, have been stuck for quite some time as you can see by our SMU Price Momentum at the top of the table below. As a result, our benchmark hot rolled price average is $3 per ton higher than what we reported at the end of June and $6 per ton higher than that of May.
As you can see, the other two indexes watched closely by the steel community (CRU and Platts) were within one dollar ($1) of the SMU average for the month.
You can also see by our weekly numbers that hot rolled coil prices have been slipping as of late. This is due to an expansion of the range. We are expecting the domestic steel mills to file antidumping and countervailing duty cases on hot rolled during the month of August. We will see if the combination of HR, CR and coated trade cases begins to impact pricing.
SMU Steel Buyers Sentiment Index 3 month moving average (3MMA) has been improving. We believe this is due to a strengthening of the commercial construction sector and would be even better if the energy markets were to rebound.
Zinc and aluminum prices are both lower as of the end of the month. Iron ore prices are also down.
MSCI months on hand (flat rolled) dropped to 2.4 months as of the end of June. However, SMU Service Center Apparent Inventory Excess was calculated to be 617,000 net tons (our forecast is calling for tonnage to drop significantly over the next two months – if you want to learn more inquire about becoming a Premium level subscriber to SMU).
Imports are down but are still well above the 3.0 million net ton mark. Apparent steel supply continued to drop.