Market Data

August 23, 2015
Distributors Appear Poised to Have Excessive Inventories Thru End of Year
Written by John Packard
Steel Market Update (SMU) produces for our Premium level members a number of articles/analysis related to the Metal Service Center Institute (MSCI) data which is released on a monthly basis. One of the articles is our Service Center Inventories Apparent Excess/Deficit analysis.
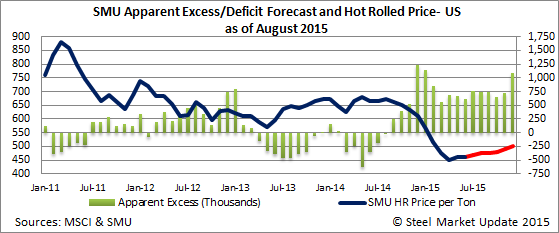
Our Apparent Excess/Deficit is the number of tons either over or under what our proprietary model considers to be a balanced inventory at that point in time. Distributors have been running an excess of flat rolled inventories since September 2014. Inventories peaked in December 2014 and into January 2015 and had been slowly dropping through March before stagnating around 600,000 plus tons.
SMU has been on the opinion that U.S. service centers would address the burgeoning flat rolled steel inventory situation as this calendar year progressed. It has been well known that service centers have been struggling with excess inventories for most of this year. Originally, SMU forecast those inventories would begin to recede by the month of July and that has not happened, instead our Apparent Excess grew during the month of July as did actual inventory levels.
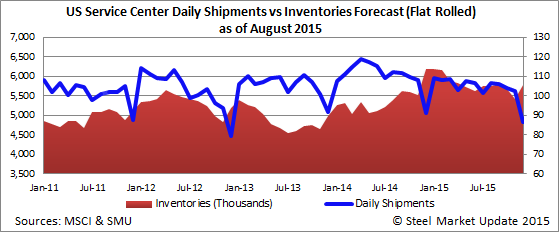
Looking at actual inventories of flat rolled steel, the MSCI data has actual inventories dropping from December 2014 through June 2015. In December 2014 inventories of flat rolled products stood at 6,186,100 tons. At the end of June flat rolled inventories had adjusted to 5,607,500 net tons.
In July inventories grew as the daily shipment rate declined compared to both the prior month as well as the previous year and was lower than the 3 year average. At the same time the daily receipt of steel increased over the prior month but, was below both the prior year and the 3 year average.
Our Apparent Excess model has flat rolled distributors carrying 767,000 tons of excess inventories. This represents an increase of 150,000 tons compared to what we reported at the end of June.
Daily Shipment Rate
As Peter Wright has pointed out in his MSCI analysis done for our Premium level members, the year over year comparison of the daily shipment rate has dropped for all of this year’s months beginning with February. The average decline over those six months was 7.4 percent lower than the previous year.
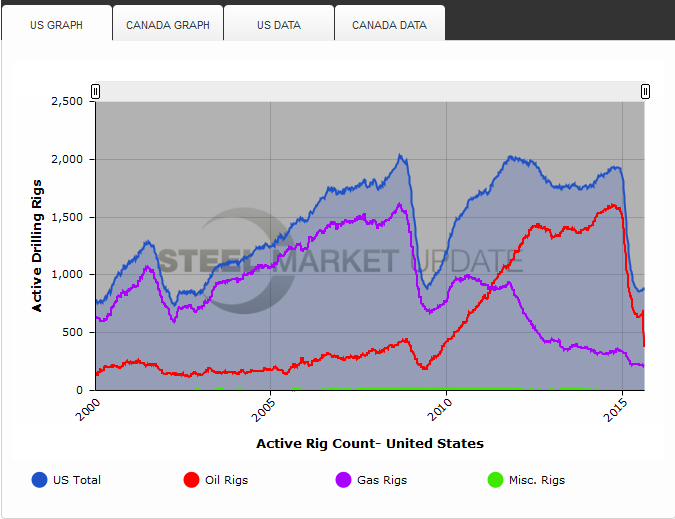
SMU has no choice but to recognize that 2015 business conditions will be much lower to the comparables from last year. One of the biggest reasons why is the impact the energy sector has had on the economy and hot rolled steel shipments. When we go back and look at the rig counts and compare 2015 against 2014 we must take into consideration the radical drop which occurred right at the end of calendar year 2014 and into early 2015.
Because of the radical drop in the energy markets, in particular new oil rigs, the amount of hot rolled coil coming into the U.S. markets did not adjust despite the Russian Suspension Agreement being vacated. For the first six months 2014 the U.S. received 1,882,456 tons of HRC for an average of 313,742 tons per month. For the first six months 2015 the number of tons received was 2,072,566 tons for an average of 345,427 tons.
Most likely what has propelled the imports during this time frame was the collapse of HRC spot pricing both domestically and all over the world as commodity prices crashed and the value of the dollar rose making the U.S. market very attractive.
The bottom line is we have, according to MSCI data, hot rolled coil inventories at 3.1 months supply at the end of July while other flat rolled products are more balanced.
This is why we are seeing hot rolled lead times as low as one week at Steel Dynamics Columbus and mills willing to negotiate HRC prices despite trade suits having been filed.
With cold rolled and coated product inventories being closer to 2.0 months supply this allows for mills to increase the spread in pricing and take a more disciplined approach to those products vs. HRC.
August-December 2015 Forecast
We are adjusting our forecast to take into consideration some of the realities of the marketplace. We are adjusting our daily shipment rate to reflect a 5 percent drop compared to the 3 year average. This is in line with the trend we have seen develop during this calendar year.
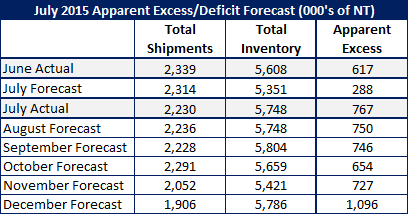
At the same time we are adjusting our receipts to be 3 percent lower than the 3 year average for the months of August, September and October and 5 percent lower during the months of November and December. With the drop in July and August imports (compared to earlier in the year) coupled with anticipated decline in imports going forward and, at the same time domestic capacity utilization rates continue to be in the 72-73 percent range, we believe this is also reasonable.
If we are correct, we would end the year with total inventories of 5.786 million tons and an Apparent Excess of 1 million tons. Shipments would have to improve dramatically in order to drop our Apparent Excess to under 600,000 tons and we are not hearing it from our service center sources at this moment.
Pricing Forecast
Flat rolled prices will be impacted by the availability of material, in other words how soon can the service centers work off their excessive inventories to the point where orders have to be placed in enough volume to impact lead times and ultimately steel prices?
At this time Steel Market Update is of the opinion that we could see flat rolled prices weakening, especially on hot rolled, over the next month of two. We think there will be a widening of the spread between cold rolled/coated and hot rolled prices as inventories are leaner on CR and coated which should allow the domestic mills to collect a small margin on those products. As we move into the end of the calendar year and the impact of the trade suits becomes clearer we could see an uptick in prices at that point in time. We do not believe hot rolled will break through $500 per ton during this calendar year – unless we were to see supply interruptions either by strike or lockout of the unions at US Steel and ArcelorMittal.