

Market Data

August 24, 2015
Consumer Confidence for August 2015
Written by Peter Wright
Consumer confidence took a big hit in July, and in out last report we wrote, “There is no multi month trend in recent data therefore we see no reason to be concerned about the July result which is slightly higher than the 25 year average.” We were not surprised by the huge bounce back in this week’s data in which the index rose from 91.0 in July to 101.5 in August. This is another example of why not to get too carried away by one month’s result in either direction.
The composite value combines the view of the present situation and expectations and its three month moving average (3MMA) rose by 2.3 points in August. The 3MMA of the view of the present situation improved by 2.7 points and expectations increased by 2.1 points. The composite value of consumer confidence has been much more erratic this year than it was in 2014. In all of last year the monthly change ranged from + 5.1 to – 4.4, this year the range has been +10.7 to -8.9 points.
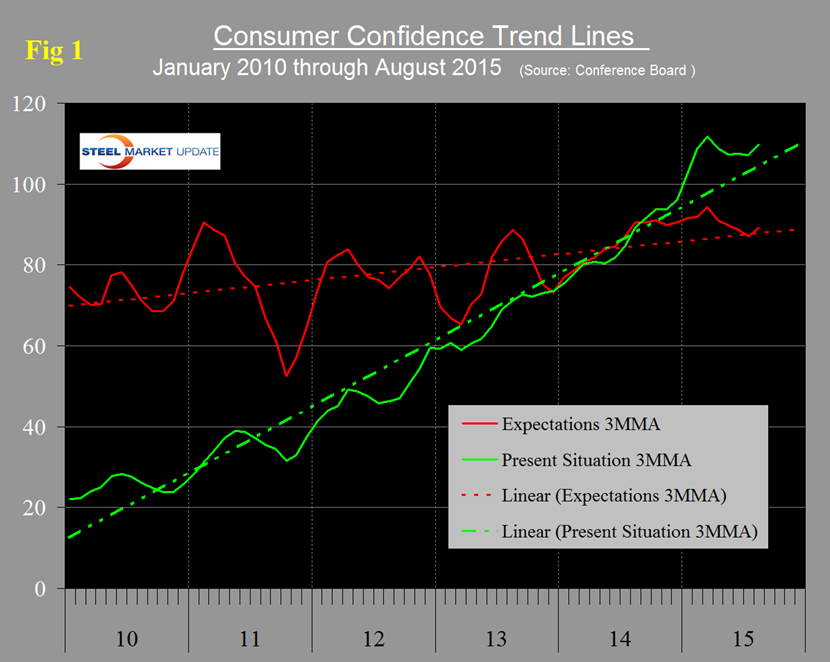
The 3MMA of the present situation continues to be above the five year trend line and that of expectations is now slightly above its 5 year trend line (Figure 1).
The historical pattern of the 3MMA of the composite, the view of the present situation and expectations are shown in Figure 2.
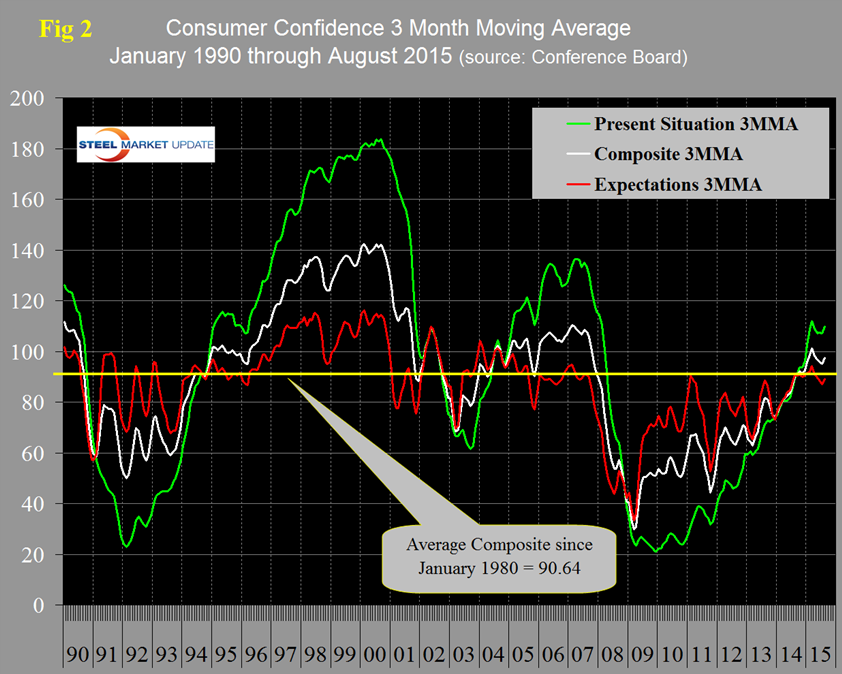
The recovery of the composite is looking better than the turn around after the recession in 2003. The present situation component has been much more volatile over each multiyear time span than expectations since our data began 35 years ago with higher highs and lower lows. The view of the present situation moved ahead of that for expectations in October last year for the first time since the recovery began in 2009. If history repeats itself, the view of the present situation will continue to move ahead and widen the differential between it and expectations.
On a year over year basis using a 3MMA, the composite is up by 7.4 led by consumer’s view of the present situation which is up by 20.4. Expectations at 89.2 are down 1.3 points year over year (Table 1).
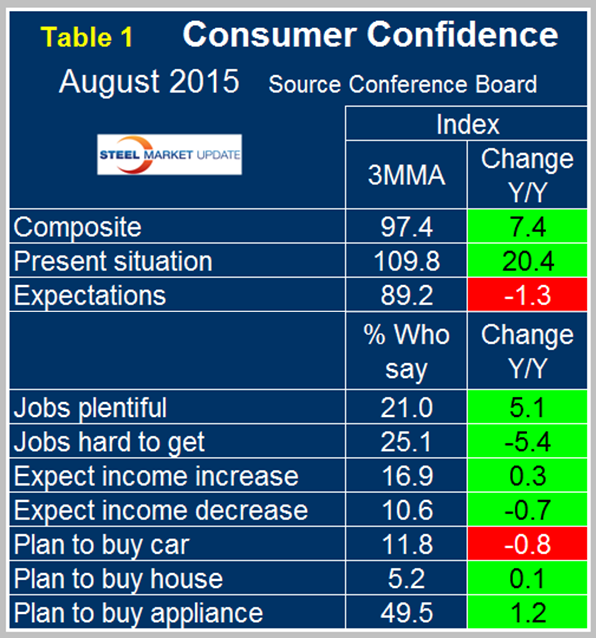
All four of the employment sub-indexes which describe job availability and wage expectations have strengthened in the last year as indicated by the color code green. In July’s report the only red employment sub-index was expectations for an income increase, this once again trended positive in August. The year over year trends for auto, home and appliance purchase were all negative in March. Intentions to buy an appliance became positive in April, intentions to buy a car became positive in May and in June and July all three were positive year over year. For the first time since April, the y/y intentions to buy a car became negative. Overall in the first eight months of 2015, the Conference Board index has had the best performance since Q3 2007.
The official news release from the Conference Board follows:
The Conference Board Consumer Confidence Index®, which had declined in July, rebounded in August. The Index now stands at 101.5 (1985=100), up from 91.0 in July. The Present Situation Index increased from 104.0 last month to 115.1 in August, while the Expectations Index improved to 92.5 from 82.3 in July.
The monthly Consumer Confidence Survey®, based on a probability-design random sample, is conducted for The Conference Board by Nielsen, a leading global provider of information and analytics around what consumers buy and watch. The cutoff date for the preliminary results was August 13.
“Consumer confidence rebounded in August, following a sharp decline in July,” said Lynn Franco, Director of Economic Indicators at The Conference Board. “Consumers’ assessment of current conditions was considerably more upbeat, primarily due to a more favorable appraisal of the labor market. The uncertainty expressed last month about the short-term outlook has dissipated and consumers are once again feeling optimistic about the near future. Income expectations, however, were little improved.”
Consumers’ assessment of current conditions was considerably more favorable in August. Those saying business conditions are “good” decreased marginally from 23.4 percent to 23.2 percent. Those claiming business conditions are “bad” declined modestly from 18.2 percent to 17.6 percent. Consumers were considerably more positive about the job market. Those stating jobs are “plentiful” increased from 19.9 percent to 21.9 percent, while those claiming jobs are “hard to get” decreased from 27.4 percent to 21.9 percent.
Consumers’ optimism about the short-term outlook also improved in August. The percentage of consumers expecting business conditions to improve over the next six months increased slightly from 15.3 percent to 15.8 percent, while those expecting business conditions to worsen declined from 10.3 percent to 8.3 percent.
Consumers’ outlook for the labor market was more upbeat. Those anticipating more jobs in the months ahead increased from 13.7 percent to 14.6 percent, while those anticipating fewer jobs decreased sharply from 19.0 percent to 13.6 percent. The proportion of consumers expecting their incomes to increase declined moderately from 17.0 percent to 16.2 percent, while the proportion expecting a decline decreased from 11.3 percent to 10.0 percent.
About The Conference Board
The Conference Board is a global, independent business membership and research association working in the public interest. Our mission is unique: To provide the world’s leading organizations with the practical knowledge they need to improve their performance and better serve society. The Conference Board is a non-advocacy, not-for-profit entity holding 501 (c) (3) tax-exempt status in the United States. www.conference-board.org
Sources: The Conference Board and SMU analysis


