Prices

August 25, 2015
July Imports and August Import Trend
Written by John Packard
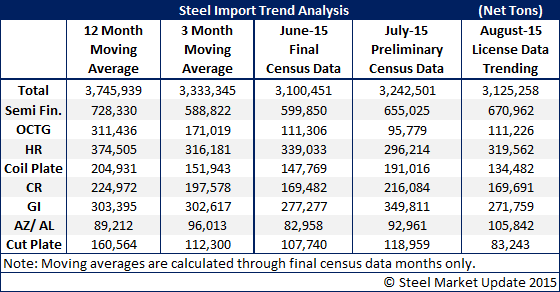
The U.S. Department of Commerce released July Preliminary Census Data and updated the license data for the month of August. In the table below we have provided the details to the July numbers which indicates imports at 3,242,501 net tons or slightly higher than the 3.1 million net tons received during the month of June. The biggest number continues to be semi-finished imports (slabs) which represent 20 percent of the total imports for the month of July.
Besides semi-finished the other product that sticks out is hot dipped galvanized at 349,811 net tons during the month of July. China was 121,397 net tons of that total. Canada was the second largest supplier at 71,187 net tons. The other countries involved in the antidumping complaint (Korea, Italy, India and Taiwan) totaled 102,683 net tons. So, for those of you keeping score, the five countries combined totaled 224,080 net tons of the 349,811 net tons shipped to the U.S. in July (64%).
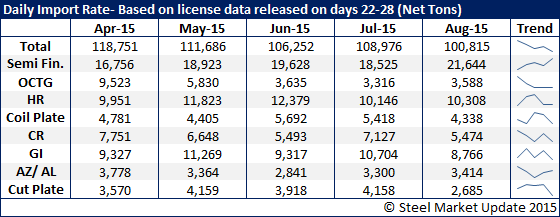
August is, at the moment, trending toward a 3.0-3.1 million net ton month. Semi-finished tonnage is poised to exceed the 3 month moving average and we are continuing to see surprisingly strong tonnage in hot rolled and Galvalume.
In the table below we are showing what the trend line is by product based on the daily import license data through 22 to 28 days of the month. The trend is for August to be lower than the previous months with semi-finished growing and most other products stable to slightly lower.